Measurement of forward $W$ and $Z$ boson production in association with jets in proton-proton collisions at $\sqrt{s}=8$ TeV
[to restricted-access page]Information
LHCb-PAPER-2016-011
CERN-EP-2016-092
arXiv:1605.00951 [PDF]
(Submitted on 03 May 2016)
JHEP 05 (2016) 131
Inspire 1454404
Tools
Abstract
The production of $W$ and $Z$ bosons in association with jets is studied in the forward region of proton-proton collisions collected at a centre-of-mass energy of 8 TeV by the LHCb experiment, corresponding to an integrated luminosity of 1.98 $\pm$ 0.02 fb$^{-1}$. The $W$ boson is identified using its decay to a muon and a neutrino, while the $Z$ boson is identified through its decay to a muon pair. Total cross-sections are measured and combined into charge ratios, asymmetries, and ratios of $W+$jet and $Z$+jet production cross-sections. Differential measurements are also performed as a function of both boson and jet kinematic variables. All results are in agreement with Standard Model predictions.
Figures and captions
|
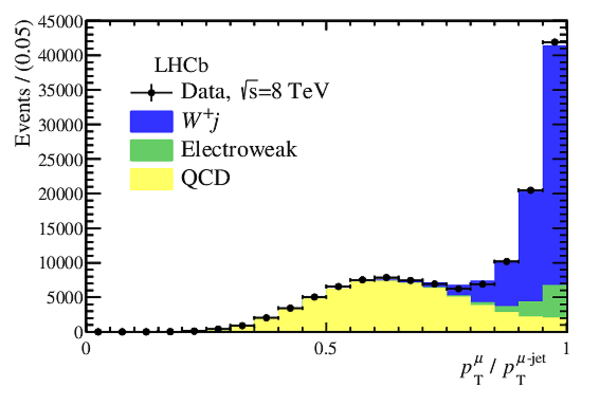
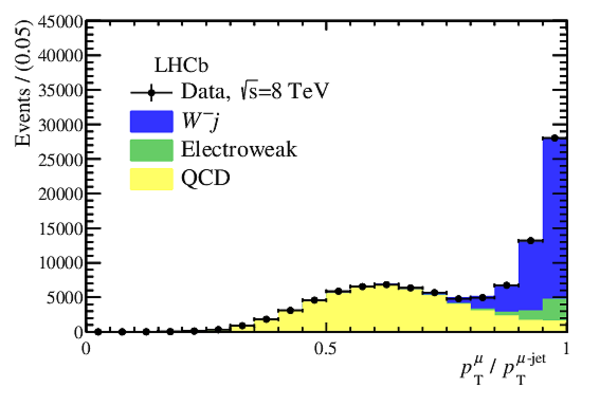
The contributions to the selected (left) $ W ^+ {j}$ and (right) $ W ^- {j}$ samples are shown, where the QCD background is obtained by a fit to the $ p_{\textrm{T}}^{\mu}$ / $ p_{\textrm{T}}^{\mu\textrm{-jet} }$ spectrum and the electroweak background is determined as described in the text. The contributions shown are the sum of the individual contributions in bins of $\eta^{\textrm{jet}}$ , where the charge asymmetry typical of $ W {j}$ production in $pp$ collisions is evident. |
Fig1l.pdf [15 KiB] HiDef png [159 KiB] Thumbnail [150 KiB] *.C file |
|
|
Fig1r.pdf [15 KiB] HiDef png [153 KiB] Thumbnail [146 KiB] *.C file |
|
|
|
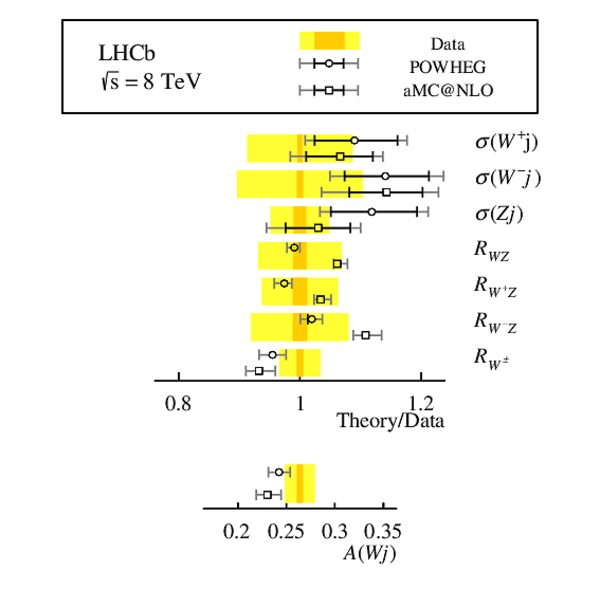
Summary of the measurements performed in the fiducial region, as defined in Sec. 1. The measurements are shown as bands, while the theoretical predictions are presented as points. For the experimental measurements, the inner band represents the statistical uncertainty, while the outer band represents the total uncertainty. For the theory points, the inner error bar represents the scale uncertainty, while the outer bar represents the total uncertainty. The cross-sections and ratios are shown normalised to the measurement, while the asymmetry is presented separately. |
Fig2.pdf [15 KiB] HiDef png [152 KiB] Thumbnail [131 KiB] *.C file |
|
|
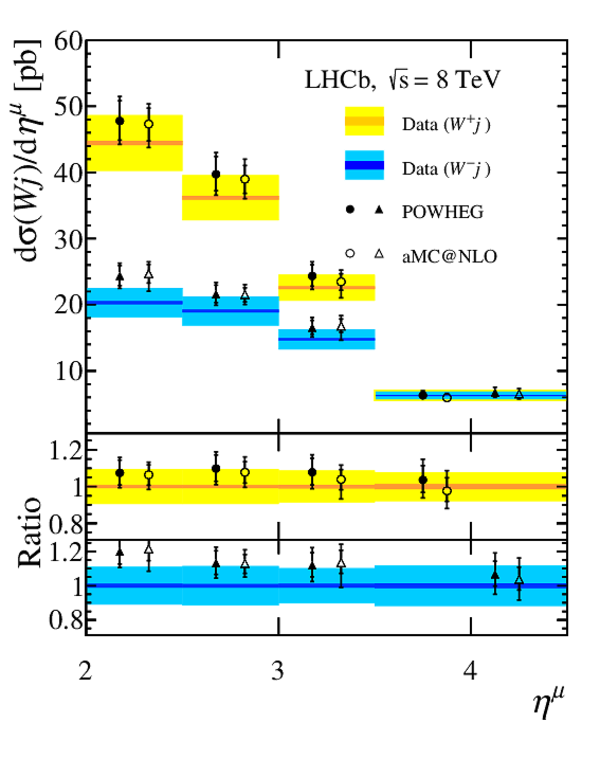
$ W {j}$ bin-averaged differential cross-sections as a function of $\eta^{\mu}$ (left) and $\eta^{\textrm{jet}}$ (right). The measurements are shown as bands representing the statistical and total uncertainties, while the theoretical predictions are shown as points (displaced horizontally for presentation) representing the same bin-averaged cross-sections as the data. The inner error bar represents the scale uncertainty, and the outer error bar represents the total uncertainty. The ratio of the predicted to measured cross-sections is shown below the distribution. The $ W ^+ {j}$ and $ W ^- {j}$ cross-sections are seen to overlap in the final bin in $\eta^{\mu}$ . |
Fig3l.pdf [18 KiB] HiDef png [218 KiB] Thumbnail [197 KiB] *.C file |
|
|
Fig3r.pdf [18 KiB] HiDef png [229 KiB] Thumbnail [214 KiB] *.C file |

|
|
|
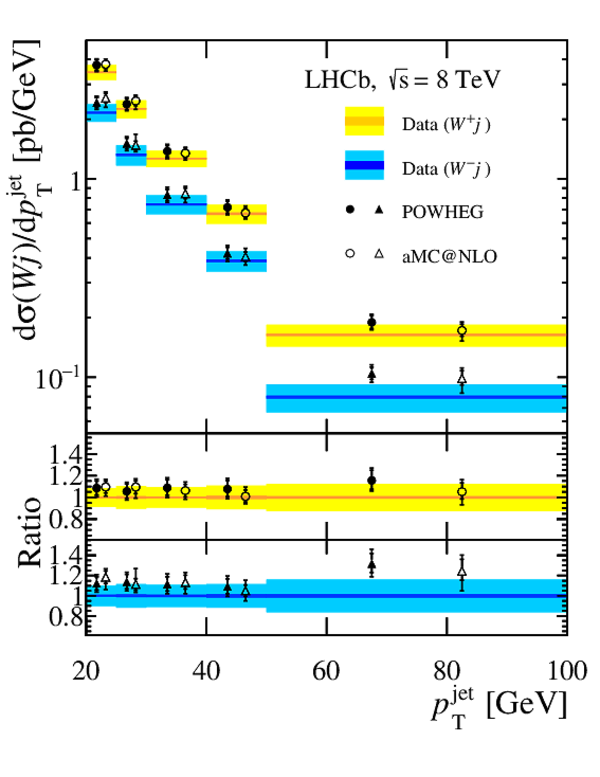
$ W {j}$ bin-averaged differential cross-sections as a function of $ p_{\textrm{T}}^{\textrm{jet}}$ . The experimental and theoretical components are shown as in Fig. 3. The ratio of the predicted to measured cross-sections is shown below the distribution. |
Fig4.pdf [19 KiB] HiDef png [242 KiB] Thumbnail [213 KiB] *.C file |
|
|
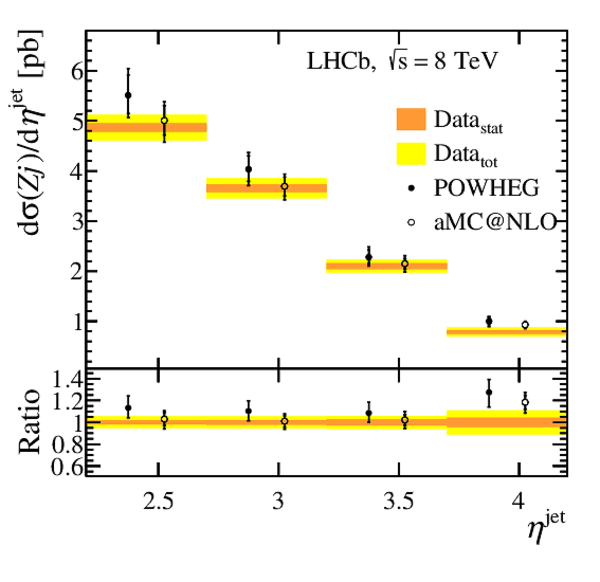
The measured bin-averaged differential $ Z {j}$ production cross-section is shown as a function of (left) $\eta^{\textrm{jet}}$ and (right) $ p_{\textrm{T}}^{\textrm{jet}}$ . The experimental measurements are shown as bands, while the theoretical predictions are shown as points, horizontally displaced for presentation. The ratio of the predicted to measured cross-sections is shown below the distribution. |
Fig5l.pdf [15 KiB] HiDef png [157 KiB] Thumbnail [153 KiB] *.C file |
|
|
Fig5r.pdf [16 KiB] HiDef png [176 KiB] Thumbnail [163 KiB] *.C file |

|
|
|
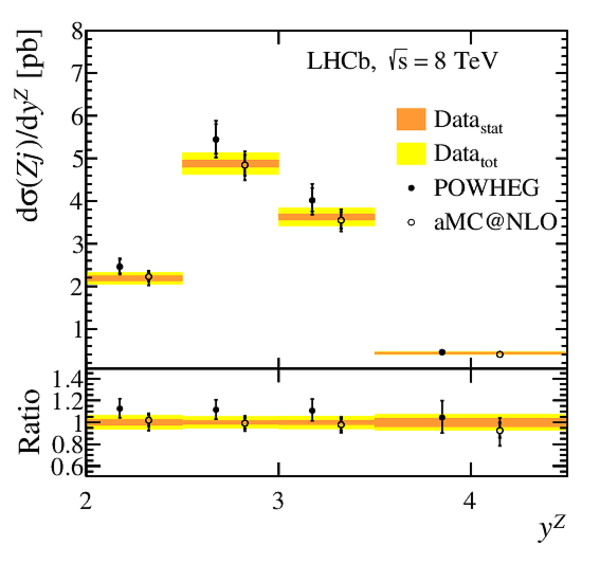
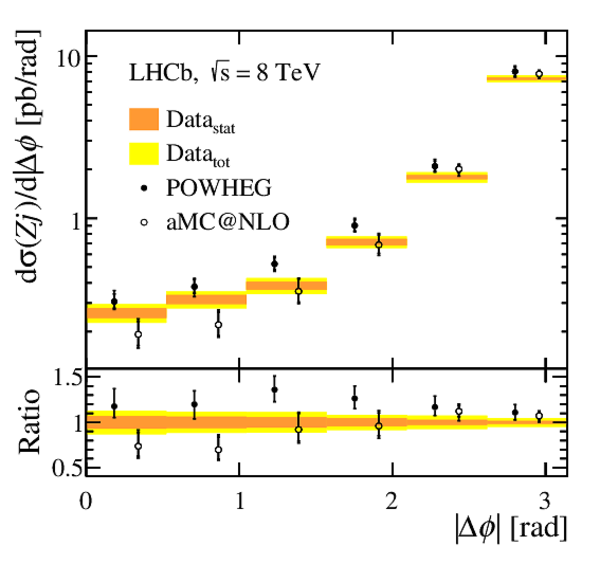
The measured bin-averaged differential $ Z {j}$ production cross-section is shown as a function of (left) $ y^{ Z }$ and (right) azimuthal separation between the $ Z $ boson and the jet. The experimental measurements are shown as bands, while the theoretical predictions are shown as points, horizontally displaced for presentation. The ratio of the predicted to measured cross-sections is shown below the distribution. |
Fig6l.pdf [15 KiB] HiDef png [154 KiB] Thumbnail [149 KiB] *.C file |
|
|
Fig6r.pdf [16 KiB] HiDef png [158 KiB] Thumbnail [147 KiB] *.C file |
|
|
|
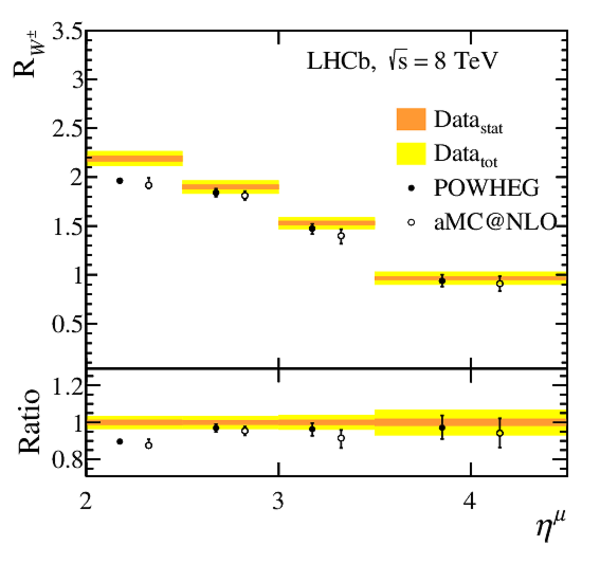
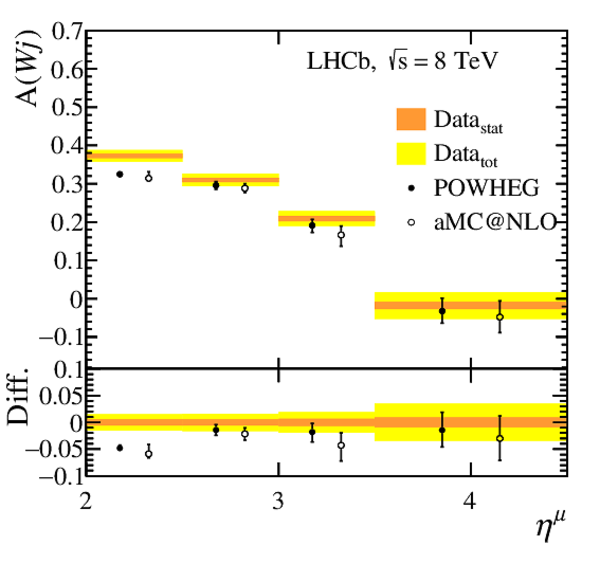
Ratio (left) and asymmetry (right) of $ W ^+ {j}$ to $ W ^- {j}$ production as a function of the lepton pseudorapidity. The experimental measurements are shown as bands, while the theoretical predictions are shown as points, horizontally displaced for presentation. The ratio of the predictions to the experimentally measured values is shown below the distribution for the charge ratio, while their difference is shown for the charge asymmetry. |
Fig7l.pdf [15 KiB] HiDef png [131 KiB] Thumbnail [126 KiB] *.C file |
|
|
Fig7r.pdf [15 KiB] HiDef png [157 KiB] Thumbnail [154 KiB] *.C file |
|
|
|
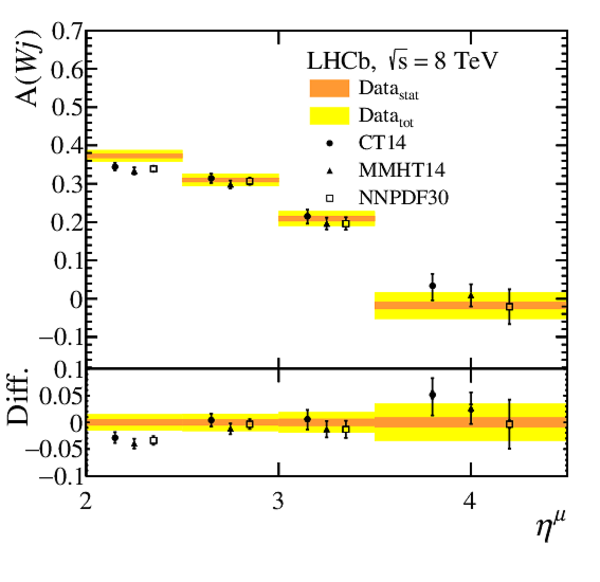
Ratio (left) and asymmetry (right) of $ W ^+ {j}$ to $ W ^- {j}$ production as a function of the lepton pseudorapidity compared to NLO calculations performed with the Fewz generator and three different PDF sets. The experimental measurements are shown as bands, while the theoretical predictions are shown as points, horizontally displaced for presentation. The same comparisons are shown below the distribution as described in Fig. 7. |
Fig8l.pdf [15 KiB] HiDef png [135 KiB] Thumbnail [128 KiB] *.C file |

|
|
Fig8r.pdf [16 KiB] HiDef png [161 KiB] Thumbnail [155 KiB] *.C file |
|
|
|
Animated gif made out of all figures. |
PAPER-2016-011.gif Thumbnail |

|
![HiDef png [159 KiB]](Directory_LHCb-PAPER-2016-011/hidef_Fig1l.png)
![HiDef png [153 KiB]](Directory_LHCb-PAPER-2016-011/hidef_Fig1r.png)
![HiDef png [152 KiB]](Directory_LHCb-PAPER-2016-011/hidef_Fig2.png)
![HiDef png [218 KiB]](Directory_LHCb-PAPER-2016-011/hidef_Fig3l.png)
![HiDef png [229 KiB]](Directory_LHCb-PAPER-2016-011/hidef_Fig3r.png)
![HiDef png [242 KiB]](Directory_LHCb-PAPER-2016-011/hidef_Fig4.png)
![HiDef png [157 KiB]](Directory_LHCb-PAPER-2016-011/hidef_Fig5l.png)
![HiDef png [176 KiB]](Directory_LHCb-PAPER-2016-011/hidef_Fig5r.png)
![HiDef png [154 KiB]](Directory_LHCb-PAPER-2016-011/hidef_Fig6l.png)
![HiDef png [158 KiB]](Directory_LHCb-PAPER-2016-011/hidef_Fig6r.png)
![HiDef png [131 KiB]](Directory_LHCb-PAPER-2016-011/hidef_Fig7l.png)
![HiDef png [157 KiB]](Directory_LHCb-PAPER-2016-011/hidef_Fig7r.png)
![HiDef png [135 KiB]](Directory_LHCb-PAPER-2016-011/hidef_Fig8l.png)
![HiDef png [161 KiB]](Directory_LHCb-PAPER-2016-011/hidef_Fig8r.png)
Tables and captions
|
Summary of the different contributions to the total uncertainty on $\sigma_{ W ^+ {j} }$ , $\sigma_{ W ^- {j} }$ , $\sigma_{ Z {j} }$ and their ratios given as a percentage of the measured observable. |
Table_1.pdf [47 KiB] HiDef png [91 KiB] Thumbnail [43 KiB] tex code |

|
![HiDef png [91 KiB]](Directory_LHCb-PAPER-2016-011/hidef_Table_1.png)
Supplementary Material [file]
| Supplementary material full pdf |
supple[..].pdf [118 KiB] |

|
Created on 27 April 2024.