Measurements of the S-wave fraction in $B^{0}\rightarrow K^{+}\pi^{-}\mu^{+}\mu^{-}$ decays and the $B^{0}\rightarrow K^{\ast}(892)^{0}\mu^{+}\mu^{-}$ differential branching fraction
[to restricted-access page]Information
LHCb-PAPER-2016-012
CERN-EP-2016-141
arXiv:1606.04731 [PDF]
(Submitted on 15 Jun 2016)
JHEP 11 (2016) 047
Inspire 1469448
Tools
Abstract
A measurement of the differential branching fraction of the decay ${B^{0}\rightarrow K^{\ast}(892)^{0}\mu^{+}\mu^{-}}$ is presented together with a determination of the S-wave fraction of the $K^+\pi^-$ system in the decay $B^{0}\rightarrow K^{+}\pi^{-}\mu^{+}\mu^{-}$. The analysis is based on $pp$-collision data corresponding to an integrated luminosity of 3 fb$^{-1}$ collected with the LHCb experiment. The measurements are made in bins of the invariant mass squared of the dimuon system, $q^2$. Precise theoretical predictions for the differential branching fraction of $B^{0}\rightarrow K^{\ast}(892)^{0}\mu^{+}\mu^{-}$ decays are available for the $q^2$ region $1.1<q^2<6.0 {\rm GeV}^2/c^4$. In this $q^2$ region, for the $K^+\pi^-$ invariant mass range $796 < m_{K\pi} < 996 {\rm MeV}/c^2$, the S-wave fraction of the $K^+\pi^-$ system in $B^{0}\rightarrow K^{+}\pi^{-}\mu^{+}\mu^{-}$ decays is found to be \begin{equation*} F_{\rm S} = 0.101\pm0.017({\rm stat})\pm0.009 ({\rm syst}), \end{equation*} and the differential branching fraction of $B^{0}\rightarrow K^{\ast}(892)^{0}\mu^{+}\mu^{-}$ decays is determined to be \begin{equation*} {\rm d}\mathcal{B}/{\rm d} q^2 = (0.342_{ -0.017}^{ +0.017}({\rm stat})\pm{0.009}({\rm syst})\pm0.023({\rm norm}))\times 10^{-7}c^{4}/{\rm GeV}^{2}. \end{equation*} The differential branching fraction measurements presented are the most precise to date and are found to be in agreement with Standard Model predictions.
Figures and captions
|
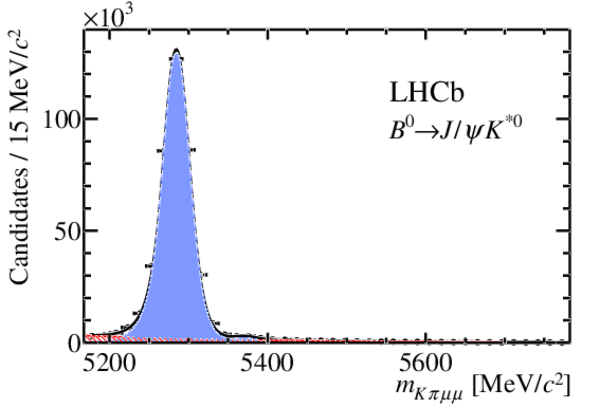
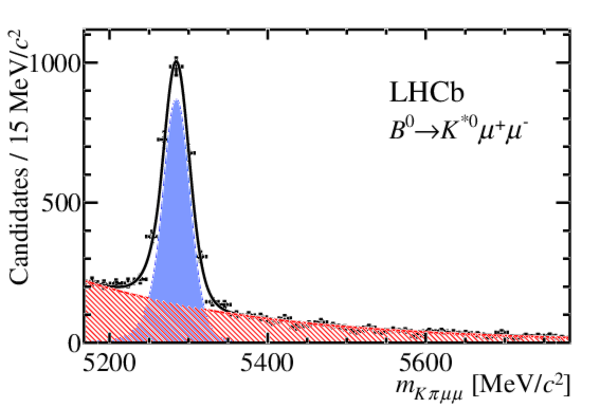
Invariant mass $ m_{K\pi\mu\mu} $ of (left) the $ B ^0 \rightarrow { J \mskip -3mu/\mskip -2mu\psi \mskip 2mu} K ^{*0} $ decay and (right) the signal decay $ B ^0 \rightarrow K ^{*0} \mu ^+ \mu ^- $ integrated over the $ q^2 $ regions described in the text. The individual signal (blue shaded area) and background (red hatched area) components are shown. The solid line denotes the total fitted distribution. |
jpsi_n[..].pdf [31 KiB] HiDef png [226 KiB] Thumbnail [144 KiB] *.C file |
|
|
rare_n[..].pdf [30 KiB] HiDef png [395 KiB] Thumbnail [210 KiB] *.C file |
|
|
|
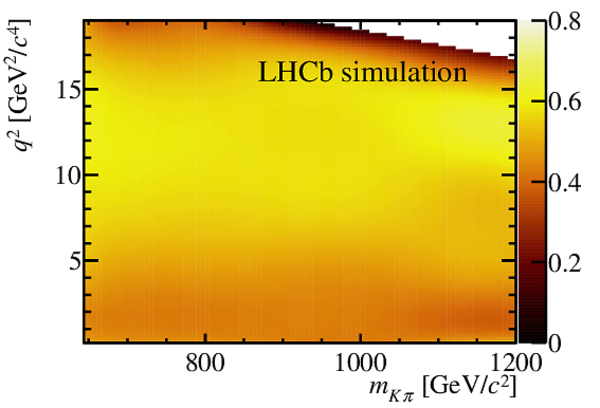
Two-dimensional projections of the efficiency (left) in the $\cos{\theta_K} $--$ q^2 $ plane and (right) in the $ m_{K\pi} $--$ q^2 $ plane, determined from a principal moments analysis of simulated four-body $ { B ^0 \rightarrow K ^+ \pi ^- \mu ^+\mu ^- } $ phase-space decays. The colour scale denotes the efficiency in arbitrary units. The lack of entries in the top right corner of the $ m_{K\pi} $--$ q^2 $ distribution is due to the limited phase space available in the decay of the $ B ^0 $ meson. |
ctkq2.pdf [80 KiB] HiDef png [1003 KiB] Thumbnail [596 KiB] *.C file |

|
|
mkpiq2.pdf [61 KiB] HiDef png [737 KiB] Thumbnail [556 KiB] *.C file |
|
|
|
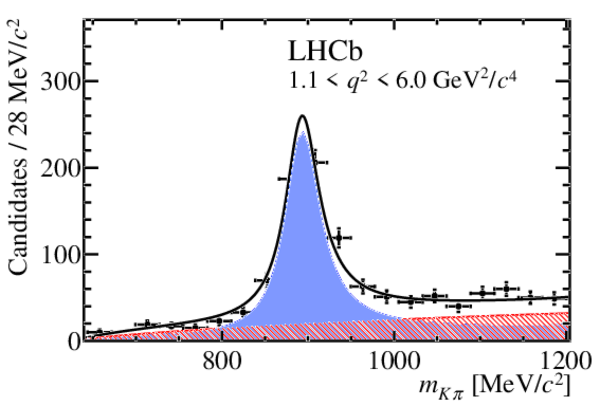
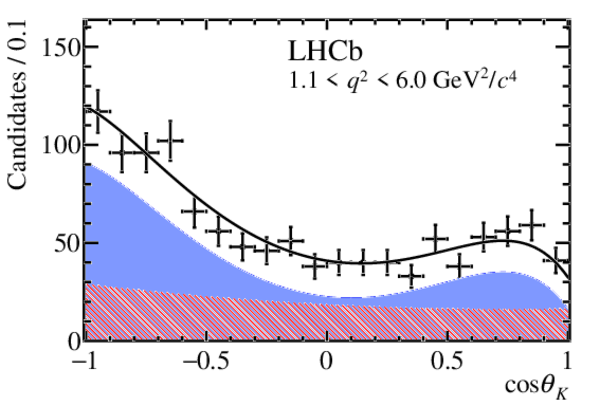
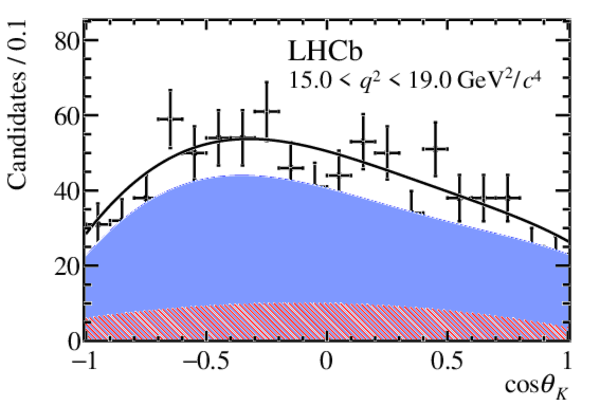
Angular and mass distributions for the $ q^2 $ bin $1.1< q^2 <6.0 {\mathrm{ Ge V^2 /}c^4} $. The distributions of $\cos{\theta_K} $ and $ m_{K\pi} $ are shown for candidates in the signal $ m_{K\pi\mu\mu} $ window of $\pm50 {\mathrm{ Me V /}c^2} $ around the known $ B ^0 $ mass. The solid line denotes the total fitted distribution. The individual components, signal (blue shaded area) and background (red hatched area), are also shown. |
mass_n[..].pdf [21 KiB] HiDef png [459 KiB] Thumbnail [248 KiB] *.C file |

|
|
mkpi_s[..].pdf [19 KiB] HiDef png [380 KiB] Thumbnail [217 KiB] *.C file |
|
|
|
ctk_si[..].pdf [18 KiB] HiDef png [556 KiB] Thumbnail [293 KiB] *.C file |
|
|
|
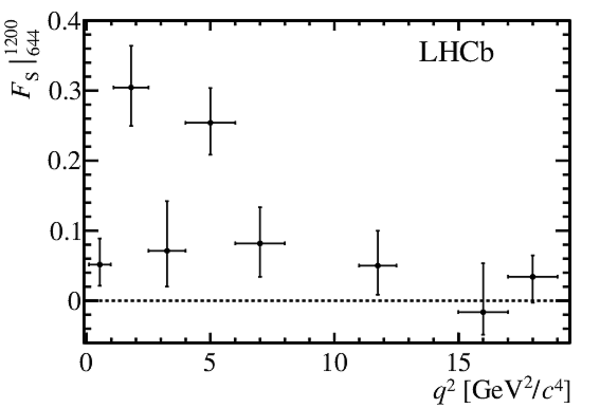
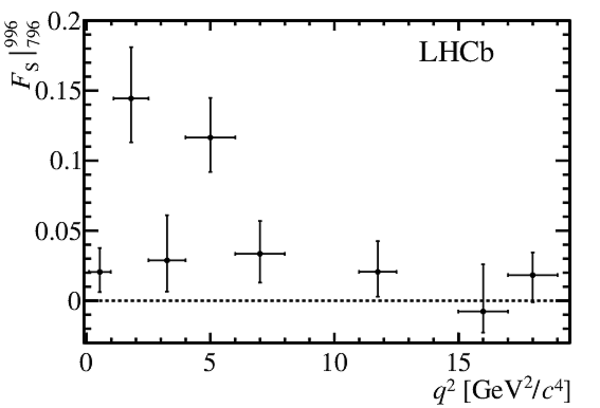
Results for the S-wave fraction ($F_{\rm S}$) in bins of $ q^2$ in the range (left) $644< m_{K\pi} <1200 {\mathrm{ Me V /}c^2} $ and (right) $796< m_{K\pi} <996 {\mathrm{ Me V /}c^2} $. The uncertainties shown are the quadratic sum of the statistical and systematic uncertainties. The shape of $F_{\rm S}$ is found to be compatible with the smoothly varying distribution of $F_{\rm L}$, as measured in Ref. [27]. |
FSWide.pdf [14 KiB] HiDef png [67 KiB] Thumbnail [40 KiB] *.C file |
|
|
FSNarr.pdf [14 KiB] HiDef png [68 KiB] Thumbnail [40 KiB] *.C file |
|
|
|
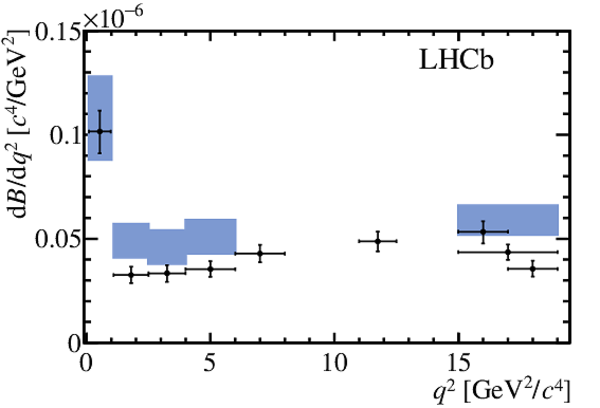
Differential branching fraction of $ { B ^0 \rightarrow K ^{*}(892)^{0} \mu ^+ \mu ^- }$ decays as a function of $ q^2 $. The data are overlaid with the SM prediction from Refs. [50,51]. No SM prediction is included in the region close to the narrow $c\bar{c}$ resonances. The result in the wider $ q^2$ bin $15.0< q^2 <19.0 {\mathrm{ Ge V^2 /}c^4} $ is also presented. The uncertainties shown are the quadratic sum of the statistical and systematic uncertainties, and include the uncertainty on the $ { B ^0 \rightarrow { J \mskip -3mu/\mskip -2mu\psi \mskip 2mu} K ^{*0} } $ and $ { J \mskip -3mu/\mskip -2mu\psi \mskip 2mu} \rightarrow \mu^+\mu^-$ branching fractions. |
dBNormal.pdf [14 KiB] HiDef png [95 KiB] Thumbnail [92 KiB] *.C file |
|
|
Angular and mass distributions for the $ q^2 $ bins $1.1< q^2 <6.0 {\mathrm{ Ge V^2 /}c^4} $ (left) and $15.0< q^2 <19.0 {\mathrm{ Ge V^2 /}c^4} $ (right). The distributions of $\cos{\theta_K} $ and $ m_{K\pi} $ are shown for candidates in the signal $ m_{K\pi\mu\mu} $ window of $\pm50 {\mathrm{ Me V /}c^2} $ around the known $ B ^0 $ mass. |
mass_n[..].pdf [21 KiB] HiDef png [459 KiB] Thumbnail [248 KiB] *.C file |
|
|
mass_n[..].pdf [21 KiB] HiDef png [368 KiB] Thumbnail [205 KiB] *.C file |

|
|
|
mkpi_s[..].pdf [19 KiB] HiDef png [380 KiB] Thumbnail [217 KiB] *.C file |
|
|
|
mkpi_s[..].pdf [19 KiB] HiDef png [277 KiB] Thumbnail [176 KiB] *.C file |

|
|
|
ctk_si[..].pdf [18 KiB] HiDef png [556 KiB] Thumbnail [293 KiB] *.C file |
|
|
|
ctk_si[..].pdf [18 KiB] HiDef png [485 KiB] Thumbnail [264 KiB] *.C file |
|
|
|
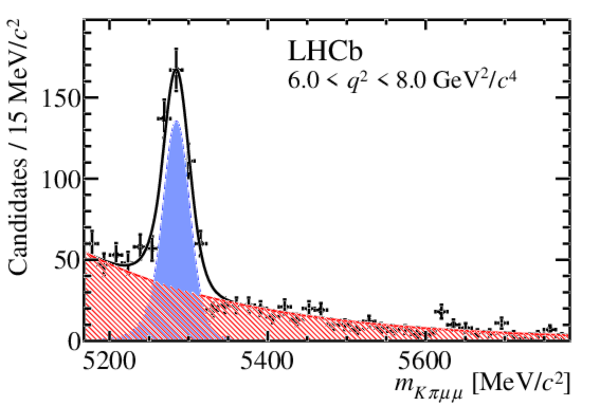
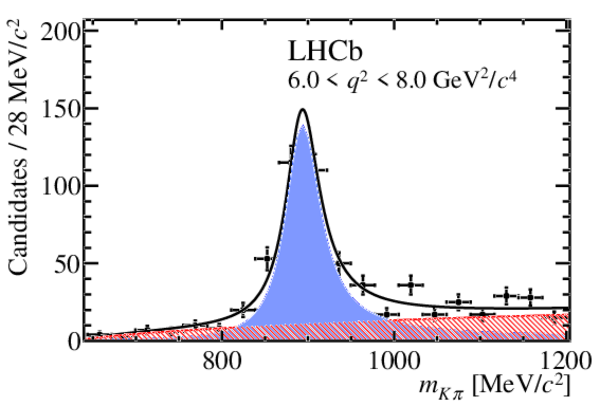
The $K^+\pi^-\mu^+\mu^-$ invariant mass distributions for the fine $ q^2 $ bins. |
mass_n[..].pdf [21 KiB] HiDef png [276 KiB] Thumbnail [170 KiB] *.C file |

|
|
mass_n[..].pdf [21 KiB] HiDef png [379 KiB] Thumbnail [209 KiB] *.C file |

|
|
|
mass_n[..].pdf [21 KiB] HiDef png [494 KiB] Thumbnail [255 KiB] *.C file |

|
|
|
mass_n[..].pdf [21 KiB] HiDef png [467 KiB] Thumbnail [248 KiB] *.C file |

|
|
|
mass_n[..].pdf [21 KiB] HiDef png [467 KiB] Thumbnail [250 KiB] *.C file |
|
|
|
mass_n[..].pdf [21 KiB] HiDef png [415 KiB] Thumbnail [226 KiB] *.C file |

|
|
|
mass_n[..].pdf [21 KiB] HiDef png [353 KiB] Thumbnail [201 KiB] *.C file |

|
|
|
mass_n[..].pdf [21 KiB] HiDef png [374 KiB] Thumbnail [205 KiB] *.C file |

|
|
|
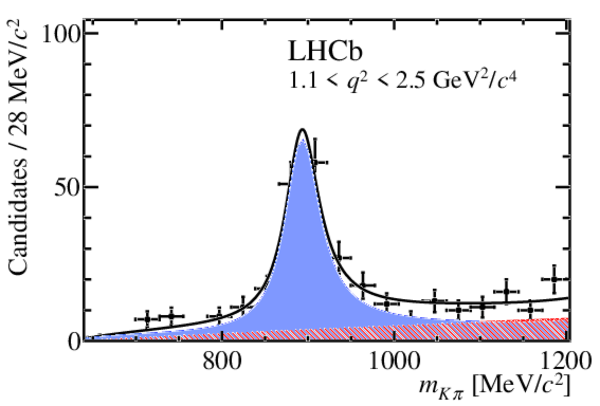
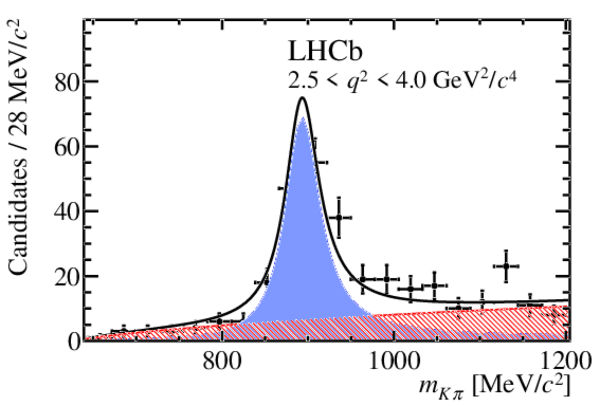
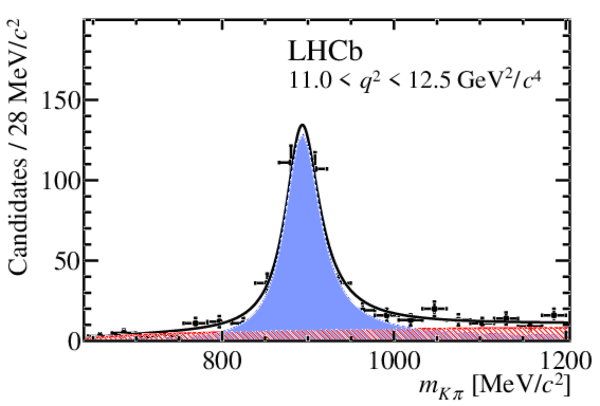
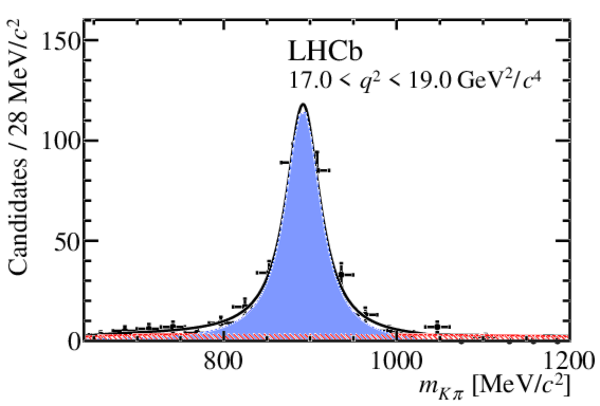
The $ K ^+ \pi ^- $ invariant mass distributions for the fine $ q^2 $ bins for candidates in the signal $ m_{K\pi\mu\mu} $ window of $\pm50 {\mathrm{ Me V /}c^2} $ around the known $ B ^0 $ mass. |
mkpi_s[..].pdf [18 KiB] HiDef png [244 KiB] Thumbnail [162 KiB] *.C file |

|
|
mkpi_s[..].pdf [19 KiB] HiDef png [325 KiB] Thumbnail [196 KiB] *.C file |
|
|
|
mkpi_s[..].pdf [19 KiB] HiDef png [408 KiB] Thumbnail [229 KiB] *.C file |
|
|
|
mkpi_s[..].pdf [19 KiB] HiDef png [390 KiB] Thumbnail [224 KiB] *.C file |

|
|
|
mkpi_s[..].pdf [19 KiB] HiDef png [376 KiB] Thumbnail [218 KiB] *.C file |
|
|
|
mkpi_s[..].pdf [19 KiB] HiDef png [303 KiB] Thumbnail [187 KiB] *.C file |
|
|
|
mkpi_s[..].pdf [18 KiB] HiDef png [265 KiB] Thumbnail [164 KiB] *.C file |

|
|
|
mkpi_s[..].pdf [18 KiB] HiDef png [262 KiB] Thumbnail [165 KiB] *.C file |
|
|
|
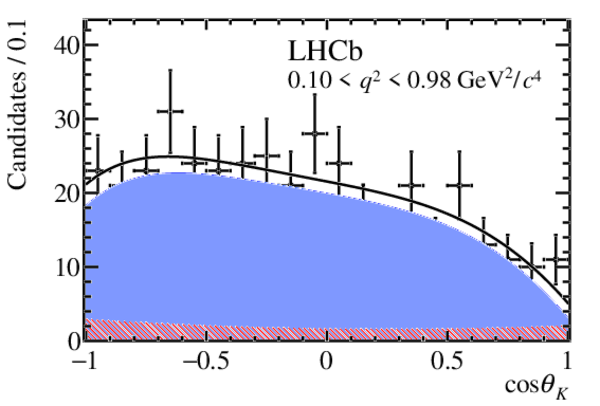
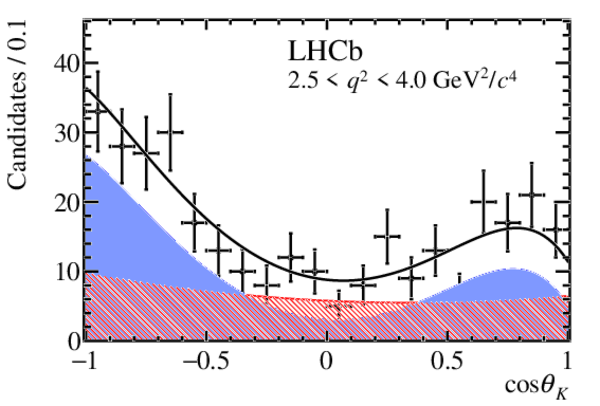
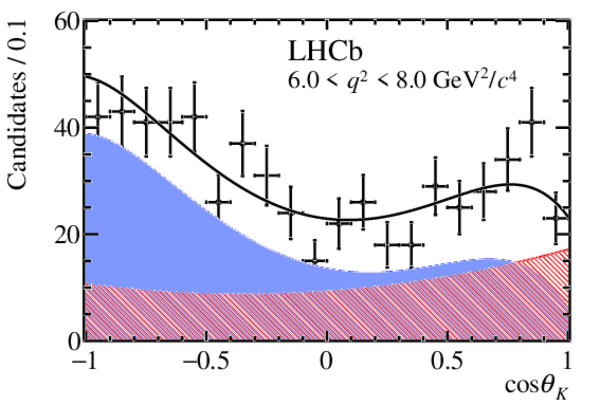
The $\cos{\theta_K}$ angular distributions for the fine $ q^2 $ bins for candidates in the signal $ m_{K\pi\mu\mu} $ window of $\pm50 {\mathrm{ Me V /}c^2} $ around the known $ B ^0 $ mass. |
ctk_si[..].pdf [18 KiB] HiDef png [329 KiB] Thumbnail [208 KiB] *.C file |
|
|
ctk_si[..].pdf [18 KiB] HiDef png [484 KiB] Thumbnail [266 KiB] *.C file |

|
|
|
ctk_si[..].pdf [19 KiB] HiDef png [618 KiB] Thumbnail [315 KiB] *.C file |
|
|
|
ctk_si[..].pdf [18 KiB] HiDef png [561 KiB] Thumbnail [293 KiB] *.C file |

|
|
|
ctk_si[..].pdf [18 KiB] HiDef png [731 KiB] Thumbnail [354 KiB] *.C file |
|
|
|
ctk_si[..].pdf [18 KiB] HiDef png [576 KiB] Thumbnail [296 KiB] *.C file |

|
|
|
ctk_si[..].pdf [18 KiB] HiDef png [462 KiB] Thumbnail [252 KiB] *.C file |

|
|
|
ctk_si[..].pdf [18 KiB] HiDef png [450 KiB] Thumbnail [247 KiB] *.C file |

|
|
|
Animated gif made out of all figures. |
PAPER-2016-012.gif Thumbnail |

|
![HiDef png [226 KiB]](Directory_LHCb-PAPER-2016-012/hidef_jpsi_nice_mass_fit.png)
![HiDef png [395 KiB]](Directory_LHCb-PAPER-2016-012/hidef_rare_nice_mass_fit.png)
![HiDef png [1003 KiB]](Directory_LHCb-PAPER-2016-012/hidef_ctkq2.png)
![HiDef png [737 KiB]](Directory_LHCb-PAPER-2016-012/hidef_mkpiq2.png)
![HiDef png [459 KiB]](Directory_LHCb-PAPER-2016-012/hidef_mass_nice_8.png)
![HiDef png [380 KiB]](Directory_LHCb-PAPER-2016-012/hidef_mkpi_signal_nice_8.png)
![HiDef png [556 KiB]](Directory_LHCb-PAPER-2016-012/hidef_ctk_signal_nice_8.png)
![HiDef png [67 KiB]](Directory_LHCb-PAPER-2016-012/hidef_FSWide.png)
![HiDef png [68 KiB]](Directory_LHCb-PAPER-2016-012/hidef_FSNarr.png)
![HiDef png [95 KiB]](Directory_LHCb-PAPER-2016-012/hidef_dBNormal.png)
![HiDef png [368 KiB]](Directory_LHCb-PAPER-2016-012/hidef_mass_nice_9.png)
![HiDef png [277 KiB]](Directory_LHCb-PAPER-2016-012/hidef_mkpi_signal_nice_9.png)
![HiDef png [485 KiB]](Directory_LHCb-PAPER-2016-012/hidef_ctk_signal_nice_9.png)
![HiDef png [276 KiB]](Directory_LHCb-PAPER-2016-012/hidef_mass_nice_0.png)
![HiDef png [379 KiB]](Directory_LHCb-PAPER-2016-012/hidef_mass_nice_1.png)
![HiDef png [494 KiB]](Directory_LHCb-PAPER-2016-012/hidef_mass_nice_2.png)
![HiDef png [467 KiB]](Directory_LHCb-PAPER-2016-012/hidef_mass_nice_3.png)
![HiDef png [467 KiB]](Directory_LHCb-PAPER-2016-012/hidef_mass_nice_4.png)
![HiDef png [415 KiB]](Directory_LHCb-PAPER-2016-012/hidef_mass_nice_5.png)
![HiDef png [353 KiB]](Directory_LHCb-PAPER-2016-012/hidef_mass_nice_6.png)
![HiDef png [374 KiB]](Directory_LHCb-PAPER-2016-012/hidef_mass_nice_7.png)
![HiDef png [244 KiB]](Directory_LHCb-PAPER-2016-012/hidef_mkpi_signal_nice_0.png)
![HiDef png [325 KiB]](Directory_LHCb-PAPER-2016-012/hidef_mkpi_signal_nice_1.png)
![HiDef png [408 KiB]](Directory_LHCb-PAPER-2016-012/hidef_mkpi_signal_nice_2.png)
![HiDef png [390 KiB]](Directory_LHCb-PAPER-2016-012/hidef_mkpi_signal_nice_3.png)
![HiDef png [376 KiB]](Directory_LHCb-PAPER-2016-012/hidef_mkpi_signal_nice_4.png)
![HiDef png [303 KiB]](Directory_LHCb-PAPER-2016-012/hidef_mkpi_signal_nice_5.png)
![HiDef png [265 KiB]](Directory_LHCb-PAPER-2016-012/hidef_mkpi_signal_nice_6.png)
![HiDef png [262 KiB]](Directory_LHCb-PAPER-2016-012/hidef_mkpi_signal_nice_7.png)
![HiDef png [329 KiB]](Directory_LHCb-PAPER-2016-012/hidef_ctk_signal_nice_0.png)
![HiDef png [484 KiB]](Directory_LHCb-PAPER-2016-012/hidef_ctk_signal_nice_1.png)
![HiDef png [618 KiB]](Directory_LHCb-PAPER-2016-012/hidef_ctk_signal_nice_2.png)
![HiDef png [561 KiB]](Directory_LHCb-PAPER-2016-012/hidef_ctk_signal_nice_3.png)
![HiDef png [731 KiB]](Directory_LHCb-PAPER-2016-012/hidef_ctk_signal_nice_4.png)
![HiDef png [576 KiB]](Directory_LHCb-PAPER-2016-012/hidef_ctk_signal_nice_5.png)
![HiDef png [462 KiB]](Directory_LHCb-PAPER-2016-012/hidef_ctk_signal_nice_6.png)
![HiDef png [450 KiB]](Directory_LHCb-PAPER-2016-012/hidef_ctk_signal_nice_7.png)
Tables and captions
|
S-wave fraction ($F_{\rm S}$) in bins of $ q^2 $ for two $ m_{K\pi} $ regions. The first uncertainty is statistical and the second systematic. |
Table_1.pdf [52 KiB] HiDef png [148 KiB] Thumbnail [72 KiB] tex code |

|
|
Differential branching fraction of $ { B ^0 \rightarrow K ^{*}(892)^{0} \mu ^+ \mu ^- } $ decays in bins of $ q^2 $. The first uncertainty is statistical, the second systematic and the third due to the uncertainty on the $ { B ^0 \rightarrow { J \mskip -3mu/\mskip -2mu\psi \mskip 2mu} K ^{*0} } $ and $ { J \mskip -3mu/\mskip -2mu\psi \mskip 2mu} \rightarrow \mu^+\mu^-$ branching fractions. |
Table_2.pdf [51 KiB] HiDef png [179 KiB] Thumbnail [86 KiB] tex code |

|
|
Summary of the main sources of systematic uncertainty on $\left.F_{\rm S}\right|_{644}^{1200} $ and $\textrm{d} \mathcal{B}/\textrm{d} q^2 $. Typical ranges are quoted in order to summarise the effect the systematic uncertainties have across the various $ q^2 $ bins. |
Table_3.pdf [58 KiB] HiDef png [57 KiB] Thumbnail [26 KiB] tex code |

|
![HiDef png [148 KiB]](Directory_LHCb-PAPER-2016-012/hidef_Table_1.png)
![HiDef png [179 KiB]](Directory_LHCb-PAPER-2016-012/hidef_Table_2.png)
![HiDef png [57 KiB]](Directory_LHCb-PAPER-2016-012/hidef_Table_3.png)
Created on 27 April 2024.