Observation of $\eta_{c}(2S) \to p \bar p$ and search for $X(3872) \to p \bar p$ decays
[to restricted-access page]Information
LHCb-PAPER-2016-016
CERN-EP-2016-175
arXiv:1607.06446 [PDF]
(Submitted on 21 Jul 2016)
Phys. Lett. B769 (2017) 305
Inspire 1477405
Tools
Abstract
The first observation of the decay $\eta_{c}(2S) \to p \bar p$ is reported using proton-proton collision data corresponding to an integrated luminosity of $3.0\rm fb^{-1}$ recorded by the LHCb experiment at centre-of-mass energies of 7 and 8 TeV. The $\eta_{c}(2S)$ resonance is produced in the decay $B^{+} \to [c\bar c] K^{+}$. The product of branching fractions normalised to that for the $J/\psi$ intermediate state, ${\cal R}_{\eta_{c}(2S)}$, is measured to be \begin{align*} {\cal R}_{\eta_{c}(2S)}\equiv\frac{{\mathcal B}(B^{+} \to \eta_{c}(2S) K^{+}) \times {\mathcal B}(\eta_{c}(2S) \to p \bar p)}{{\mathcal B}(B^{+} \to J/\psi K^{+}) \times {\mathcal B}(J/\psi\to p \bar p)} = & (1.58 \pm 0.33 \pm 0.09)\times 10^{-2}, \end{align*} where the first uncertainty is statistical and the second systematic. No signals for the decays $B^{+} \to X(3872) (\to p \bar p) K^{+}$ and $B^{+} \to \psi(3770) (\to p \bar p) K^{+}$ are seen, and the 95% confidence level upper limits on their relative branching ratios are found to be ${\cal R}_{X(3872)}<0.25\times10^{-2}$ and ${\cal R}_{\psi(3770))}<0.10$. In addition, the mass differences between the $\eta_{c}(1S)$ and the $J/\psi$ states, between the $\eta_{c}(2S)$ and the $\psi(2S)$ states, and the natural width of the $\eta_{c}(1S)$ are measured as \begin{align*} M_{J/\psi} - M_{\eta_{c}(1S)} = & 110.2 \pm 0.5 \pm 0.9 \rm MeV, M_{\psi(2S)} -M_{\eta_{c}(2S)} = & 52.5 \pm 1.7 \pm 0.6 \rm MeV, \Gamma_{\eta_{c}(1S)} = & 34.0 \pm 1.9 \pm 1.3 \rm MeV. \end{align*}
Figures and captions
|
Invariant mass spectrum of the $p \bar{p} K^+$ candidates. The total fit curve and individual fit components are superimposed on the data. |
Fig1.pdf [32 KiB] HiDef png [243 KiB] Thumbnail [179 KiB] |

|
|
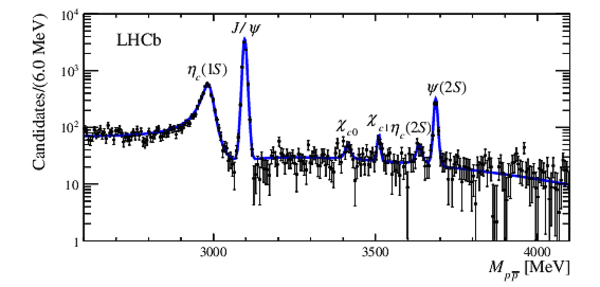
Invariant mass spectrum of the $p \bar{p}$ candidates. Background in the $B^{+} \rightarrow p \bar p K^{+}$ distribution is subtracted using the sPlot technique as described in the text. The total fit curve is superimposed. |
Fig2.pdf [62 KiB] HiDef png [204 KiB] Thumbnail [154 KiB] |
|
|
Animated gif made out of all figures. |
PAPER-2016-016.gif Thumbnail |

|
![HiDef png [243 KiB]](Directory_LHCb-PAPER-2016-016/hidef_Fig1.png)
![HiDef png [204 KiB]](Directory_LHCb-PAPER-2016-016/hidef_Fig2.png)
Tables and captions
|
Signal yields from the fit to the $p \bar p$ mass spectrum in $B^{+} \rightarrow p \bar p K^{+}$ decays. The fit fractions of the $\eta_c(1S)$ and the non-resonant component in the $J=0$ amplitude are $25\%$ and $65\%$ respectively. The fit fractions do not include uncertainties due to the ambiguities in the relative phase of the interfering amplitudes. Uncertainties are statistical only. |
Table_1.pdf [45 KiB] HiDef png [123 KiB] Thumbnail [53 KiB] tex code |

|
|
Systematic uncertainties in units of $10^{-4}$ on the $\eta_{c}(2S)$, $X(3872)$ and $\psi(3770)$ branching fraction measurements relative to that of the $ { J \mskip -3mu/\mskip -2mu\psi \mskip 2mu}$ . The efficiency contribution includes both the PID efficiency variation and the statistical error due to the finite size of the simulated samples. |
Table_2.pdf [30 KiB] HiDef png [41 KiB] Thumbnail [19 KiB] tex code |

|
|
Systematic uncertainties on the mass differences $M_{ { J \mskip -3mu/\mskip -2mu\psi \mskip 2mu} } - M_{\eta_c(1S)}$, $M_{\psi(2S)} - M_{\eta_c(2S)}$ and the $\Gamma_{\eta_c(1S)}$ measurements. The systematic uncertainty associated to the momentum scale calibration is negligible for the total width $\Gamma_{\eta_c(1S)}$ measurement. |
Table_3.pdf [52 KiB] HiDef png [37 KiB] Thumbnail [17 KiB] tex code |

|
![HiDef png [123 KiB]](Directory_LHCb-PAPER-2016-016/hidef_Table_1.png)
![HiDef png [41 KiB]](Directory_LHCb-PAPER-2016-016/hidef_Table_2.png)
![HiDef png [37 KiB]](Directory_LHCb-PAPER-2016-016/hidef_Table_3.png)
Created on 26 April 2024.