Measurement of the forward Z boson production cross-section in pp collisions at $\sqrt{s} = 13$ TeV
[to restricted-access page]Information
LHCb-PAPER-2016-021
CERN-EP-2016-170
arXiv:1607.06495 [PDF]
(Submitted on 21 Jul 2016)
JHEP 09 (2016) 136
Inspire 1477581
Tools
Abstract
A measurement of the production cross-section of Z bosons in pp collisions at $\sqrt{s} = 13$ TeV is presented using dimuon and dielectron final states in LHCb data. The cross-section is measured for leptons with pseudorapidities in the range $2.0 < \eta < 4.5$, transverse momenta $p_\text{T} > 20$ GeV and dilepton invariant mass in the range $60<m(\ell\ell)<120$ GeV. The integrated cross-section from averaging the two final states is \begin{equation*}\sigma_{\text{Z}}^{\ell\ell} = 194.3 \pm 0.9 \pm 3.3 \pm 7.6\text{ pb,}\end{equation*} where the first uncertainty is statistical, the second is due to systematic effects, and the third is due to the luminosity determination. In addition, differential cross-sections are measured as functions of the Z boson rapidity, transverse momentum and the angular variable $\phi^*_\eta$.
Figures and captions
|
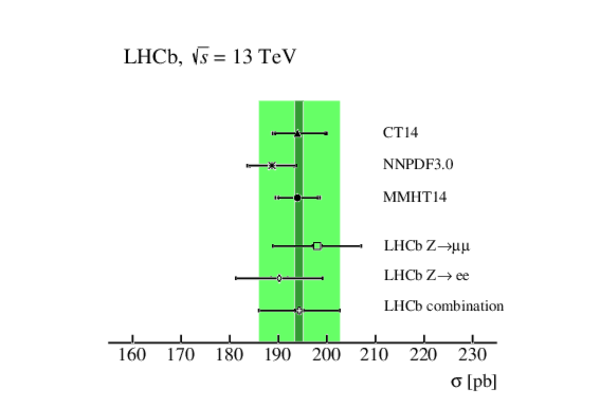
The fiducial cross-section compared between theory and data. The bands correspond to the average of the dimuon and dielectron final states, with the inner band corresponding to the statistical uncertainty and the outer band corresponding to the total uncertainty. The top three points correspond to $\mathcal{O}(\alpha_{s}^2)$ predictions with different PDF sets. The inner error bars on these points are due to the PDF uncertainty, with the outer error bars giving the contribution of all uncertainties. The bottom points correspond to the LHCb measurements in the dielectron and dimuon final states and their average, with the inner error bar showing the statistical uncertainty and the outer error bar the total uncertainty. |
Fig1.pdf [13 KiB] HiDef png [132 KiB] Thumbnail [89 KiB] *.C file |
|
|
The differential cross-section as a function of the $ Z$ boson rapidity, compared between theory and data. The bands correspond to the data, with the inner band corresponding to the statistical uncertainty and the outer band corresponding to the total uncertainty. The points correspond to $\mathcal{O}(\alpha_{s}^2)$ predictions with different PDF sets. The inner error bars on these points are due to the PDF uncertainty, with the outer error bars giving the contribution of all uncertainties. The different predictions are displaced horizontally within bins to enable ease of comparison. The upper plot shows the differential cross-section, and the lower plot shows the same information as ratios to the central values of the NNPDF3.0 predictions. |
Fig2top.pdf [20 KiB] HiDef png [254 KiB] Thumbnail [190 KiB] *.C file |

|
|
Fig2bottom.pdf [22 KiB] HiDef png [478 KiB] Thumbnail [305 KiB] *.C file |

|
|
|
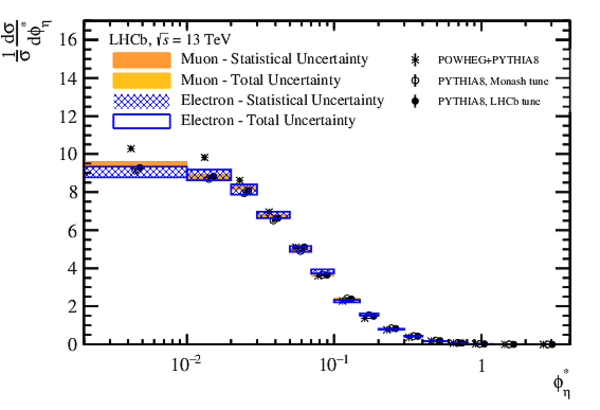
The normalised differential cross-section as a function of the $ Z$ boson $\phi^{*}_\eta$, compared between theory and data. The bands correspond to the data, with the inner band corresponding to the statistical uncertainty and the outer band corresponding to the total uncertainty. The points correspond to the theoretical predictions from the different generators and tunes. The different predictions are displaced horizontally within bins to enable ease of comparison. The upper plot shows the normalised differential cross-section, and the lower plot shows the same information as ratios to the central values of the predictions produced using the Monash 2013 tune of Pythia 8. The uncertainties on the theoretical predictions, visible at high $\phi^{*}_\eta$ , are statistical. |
Fig3top.pdf [18 KiB] HiDef png [195 KiB] Thumbnail [163 KiB] *.C file |
|
|
Fig3bottom.pdf [19 KiB] HiDef png [461 KiB] Thumbnail [285 KiB] *.C file |

|
|
|
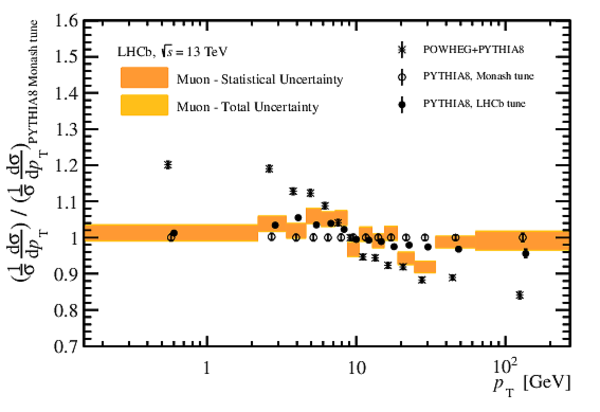
The normalised differential cross-section as a function of the $ Z$ boson transverse momentum, compared between theory and data. The bands correspond to the data, with the inner band corresponding to the statistical uncertainty and the outer band corresponding to the total uncertainty. The points correspond to the theoretical predictions from the different generators and tunes. The different predictions are displaced horizontally within bins to enable ease of comparison. The upper plot shows the normalised differential cross-section, and the lower plot shows the same information as ratios to the central values of the predictions produced using the Monash 2013 tune of Pythia 8. |
Fig4top.pdf [17 KiB] HiDef png [167 KiB] Thumbnail [156 KiB] *.C file |

|
|
Fig4bottom.pdf [18 KiB] HiDef png [173 KiB] Thumbnail [160 KiB] *.C file |
|
|
|
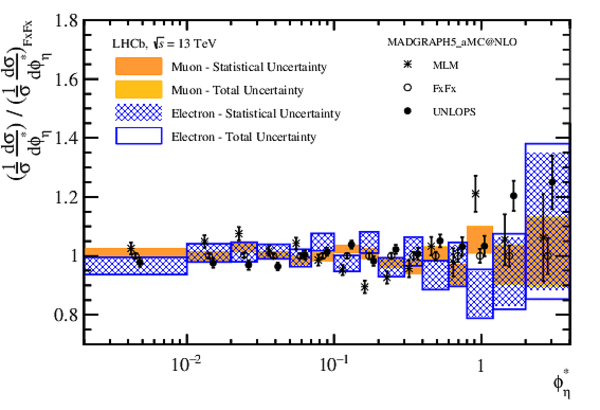
The ratio of the normalised differential cross-sections to the predictions evaluated using the FxFx scheme. The bands correspond to the data, with the inner band corresponding to the statistical uncertainty and the outer band corresponding to the total uncertainty. The different predictions are displaced horizontally within bins to enable ease of comparison. Alternative schemes give different predictions, shown as points.All predictions are generated using {MadGraph5}\_aMC@NLO. The uncertainties on the theoretical predictions are statistical. The upper plot shows the $\phi^{*}_\eta $ distribution, and the lower plot shows the $p_{\rm T}$ distribution. |
Fig5top.pdf [19 KiB] HiDef png [408 KiB] Thumbnail [245 KiB] *.C file |
|
|
Fig5bottom.pdf [18 KiB] HiDef png [172 KiB] Thumbnail [153 KiB] *.C file |

|
|
|
Animated gif made out of all figures. |
PAPER-2016-021.gif Thumbnail |

|
![HiDef png [132 KiB]](Directory_LHCb-PAPER-2016-021/hidef_Fig1.png)
![HiDef png [254 KiB]](Directory_LHCb-PAPER-2016-021/hidef_Fig2top.png)
![HiDef png [478 KiB]](Directory_LHCb-PAPER-2016-021/hidef_Fig2bottom.png)
![HiDef png [195 KiB]](Directory_LHCb-PAPER-2016-021/hidef_Fig3top.png)
![HiDef png [461 KiB]](Directory_LHCb-PAPER-2016-021/hidef_Fig3bottom.png)
![HiDef png [167 KiB]](Directory_LHCb-PAPER-2016-021/hidef_Fig4top.png)
![HiDef png [173 KiB]](Directory_LHCb-PAPER-2016-021/hidef_Fig4bottom.png)
![HiDef png [408 KiB]](Directory_LHCb-PAPER-2016-021/hidef_Fig5top.png)
![HiDef png [172 KiB]](Directory_LHCb-PAPER-2016-021/hidef_Fig5bottom.png)
Tables and captions
|
Summary of the relative uncertainties on the $ Z$ boson total cross-section. |
Table_1.pdf [41 KiB] HiDef png [58 KiB] Thumbnail [26 KiB] tex code |

|
|
The FSR correction applied as a function of the boson rapidity. |
Table_2.pdf [44 KiB] HiDef png [244 KiB] Thumbnail [118 KiB] tex code |

|
|
The FSR correction applied as a function of $\phi^{*}_\eta$ . |
Table_3.pdf [43 KiB] HiDef png [197 KiB] Thumbnail [93 KiB] tex code |

|
|
The FSR correction applied as a function of the boson transverse momentum. |
Table_4.pdf [44 KiB] HiDef png [169 KiB] Thumbnail [81 KiB] tex code |

|
|
The measured differential cross-sections as a function of the boson rapidity. The first uncertainty is due to the size of the dataset, the second is due to experimental systematic uncertainties, and the third is due to the luminosity. |
Table_5.pdf [43 KiB] HiDef png [110 KiB] Thumbnail [64 KiB] tex code |

|
|
The measured differential cross-sections as a function of $\phi^{*}_\eta$ . The first uncertainty is due to the size of the dataset, the second is due to experimental systematic uncertainties, and the third is due to the luminosity. |
Table_6.pdf [50 KiB] HiDef png [93 KiB] Thumbnail [43 KiB] tex code |

|
|
The measured differential cross-sections as a function of $p_{\rm T}$ . The first uncertainty is due to the size of the dataset, the second is due to experimental systematic uncertainties, and the third is due to the luminosity. |
Table_7.pdf [43 KiB] HiDef png [109 KiB] Thumbnail [60 KiB] tex code |

|
|
The correlation matrix for the differential cross-section measurement as a function of $ Z$ boson rapidity, for the dimuon final state, excluding the luminosity uncertainty, which is fully correlated between bins. |
Table_8.pdf [14 KiB] HiDef png [92 KiB] Thumbnail [24 KiB] tex code |

|
|
The correlation matrix for the differential cross-section measurements as a function of the $ Z$ boson rapidity, for the dielectron final state, excluding the luminosity uncertainty, which is fully correlated between bins. |
Table_9.pdf [14 KiB] HiDef png [86 KiB] Thumbnail [34 KiB] tex code |

|
|
The correlation matrix for the differential cross-section measurement as a function of $\phi^{*}_\eta$ , for the dimuon final state, excluding the luminosity uncertainty, which is fully correlated between bins. |
Table_10.pdf [14 KiB] HiDef png [81 KiB] Thumbnail [29 KiB] tex code |

|
|
The correlation matrix for the differential cross-section measurements as a function of $\phi^{*}_\eta$ , for the dielectron final state, excluding the luminosity uncertainty, which is fully correlated between bins. |
Table_11.pdf [14 KiB] HiDef png [80 KiB] Thumbnail [28 KiB] tex code |

|
|
The correlation matrix for the differential cross-section measurements as a function of boson $p_{\rm T}$ , for the dimuon final state, excluding the luminosity uncertainty, which is fully correlated between bins. |
Table_12.pdf [14 KiB] HiDef png [80 KiB] Thumbnail [25 KiB] tex code |

|
![HiDef png [58 KiB]](Directory_LHCb-PAPER-2016-021/hidef_Table_1.png)
![HiDef png [244 KiB]](Directory_LHCb-PAPER-2016-021/hidef_Table_2.png)
![HiDef png [197 KiB]](Directory_LHCb-PAPER-2016-021/hidef_Table_3.png)
![HiDef png [169 KiB]](Directory_LHCb-PAPER-2016-021/hidef_Table_4.png)
![HiDef png [110 KiB]](Directory_LHCb-PAPER-2016-021/hidef_Table_5.png)
![HiDef png [93 KiB]](Directory_LHCb-PAPER-2016-021/hidef_Table_6.png)
![HiDef png [109 KiB]](Directory_LHCb-PAPER-2016-021/hidef_Table_7.png)
![HiDef png [92 KiB]](Directory_LHCb-PAPER-2016-021/hidef_Table_8.png)
![HiDef png [86 KiB]](Directory_LHCb-PAPER-2016-021/hidef_Table_9.png)
![HiDef png [81 KiB]](Directory_LHCb-PAPER-2016-021/hidef_Table_10.png)
![HiDef png [80 KiB]](Directory_LHCb-PAPER-2016-021/hidef_Table_11.png)
![HiDef png [80 KiB]](Directory_LHCb-PAPER-2016-021/hidef_Table_12.png)
Supplementary Material [file]
| Supplementary material full pdf |
supp.pdf [101 KiB] |
|
|
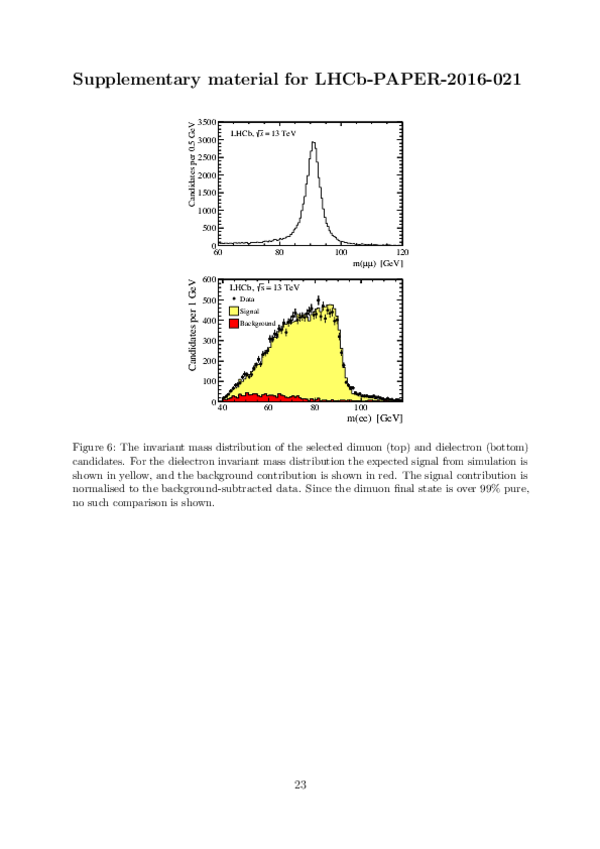
Supplementary figures for LHCb-PAPER-2016-021 |
Fig6b.pdf [23 KiB] HiDef png [252 KiB] Thumbnail [197 KiB] *C file |

|
|
Fig6t.pdf [14 KiB] HiDef png [136 KiB] Thumbnail [77 KiB] *C file |

|
|
|
Fig7.pdf [14 KiB] HiDef png [104 KiB] Thumbnail [90 KiB] *C file |

|
![HiDef png [252 KiB]](Directory_LHCb-PAPER-2016-021/supplementary/hidef_Fig6b.png)
![HiDef png [136 KiB]](Directory_LHCb-PAPER-2016-021/supplementary/hidef_Fig6t.png)
![HiDef png [104 KiB]](Directory_LHCb-PAPER-2016-021/supplementary/hidef_Fig7.png)
Created on 27 April 2024.