Search for the suppressed decays $B^{+}\rightarrow K^{+}K^{+}\pi^{-}$ and $B^{+}\rightarrow \pi^{+}\pi^{+}K^{-}$
[to restricted-access page]Information
LHCb-PAPER-2016-023
CERN-EP-2016-177
arXiv:1608.01478 [PDF]
(Submitted on 04 Aug 2016)
Phys. Lett. B765 (2017) 307
Inspire 1479452
Tools
Abstract
A search is made for the highly-suppressed B meson decays $B^{+}\rightarrow K^{+}K^{+}\pi^{-}$ and $B^{+}\rightarrow \pi^{+}\pi^{+}K^{-}$ using a data sample corresponding to an integrated luminosity of 3.0 $fb^{-1}$ collected by the LHCb experiment in proton-proton collisions at centre-of-mass energies of 7 and 8 TeV. No evidence is found for the decays, and upper limits at 90% confidence level are determined to be $\mathcal{B}(B^{+}\rightarrow K^{+}K^{+}\pi^{-}) < 1.1\times 10^{-8}$ and $\mathcal{B}(B^{+}\rightarrow \pi^{+}\pi^{+}K^{-}) < 4.6\times 10^{-8}$.
Figures and captions
|
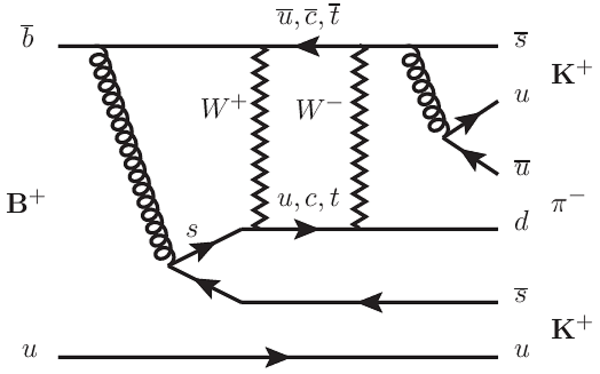
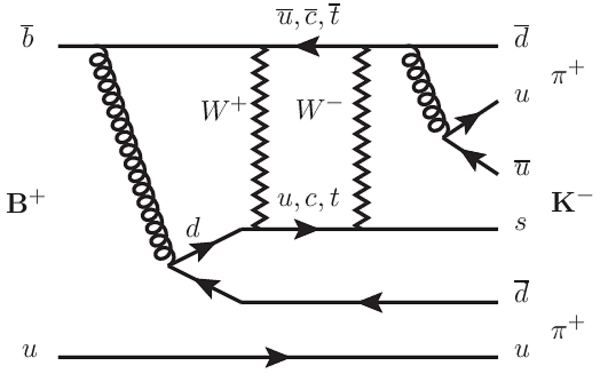
Main SM diagrams for the suppressed decays (left) $ B ^+ \rightarrow K ^+ K ^+ \pi ^- $ and (right) $ B ^+ \rightarrow \pi ^+ \pi ^+ K ^- $ . |
feyn_K[..].pdf [10 KiB] HiDef png [281 KiB] Thumbnail [146 KiB] *.C file |
|
|
feyn_p[..].pdf [10 KiB] HiDef png [282 KiB] Thumbnail [146 KiB] *.C file |
|
|
|
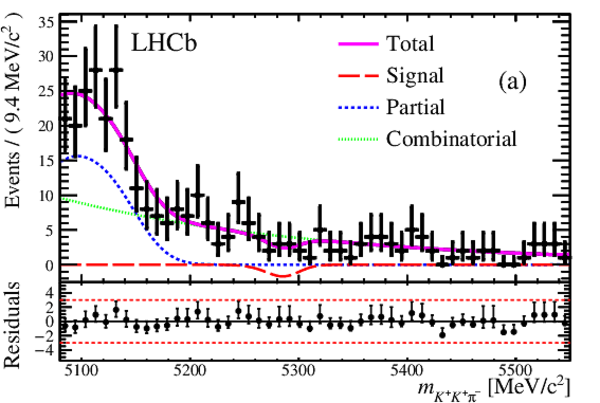
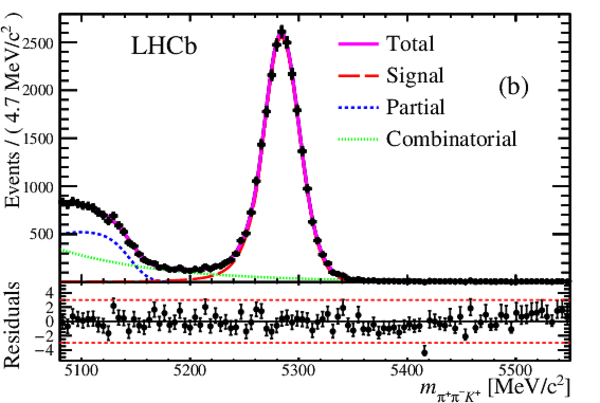
Invariant mass spectra of (a) $ B ^+ \rightarrow K ^+ K ^+ \pi ^- $ and (b) $ B ^+ \rightarrow K ^+ K ^- \pi ^+ $ candidates, with the results of the unbinned extended maximum likelihood fits overlaid. The dashed (blue) line represents the partially reconstructed background, the dotted (green) line the combinatorial background, the long dashed (red) line is the signal, and the solid (magenta) line the total. Residual differences between data and the fits are shown below the mass plots in units of standard deviation. |
KKPi_S[..].pdf [25 KiB] HiDef png [283 KiB] Thumbnail [255 KiB] *.C file |
|
|
KKPi_O[..].pdf [43 KiB] HiDef png [314 KiB] Thumbnail [272 KiB] *.C file |

|
|
|
Invariant mass spectra of (a) $ B ^+ \rightarrow \pi ^+ \pi ^+ K ^- $ and (b) $ B ^+ \rightarrow \pi ^+ \pi ^- K ^+ $ candidates, with the results of the unbinned extended maximum likelihood fits overlaid. The dashed (blue) line represents the partially reconstructed background, the dotted (green) line the combinatorial background, the long dashed (red) line is the signal, the dot-dash (dark green) line the $ B ^0_ s $ four-body backgrounds, and the solid (magenta) line the total. Residual differences between data and the fits are shown below the mass plots in units of standard deviation. |
KPiPi_[..].pdf [25 KiB] HiDef png [266 KiB] Thumbnail [234 KiB] *.C file |

|
|
KPiPi_[..].pdf [43 KiB] HiDef png [284 KiB] Thumbnail [247 KiB] *.C file |
|
|
|
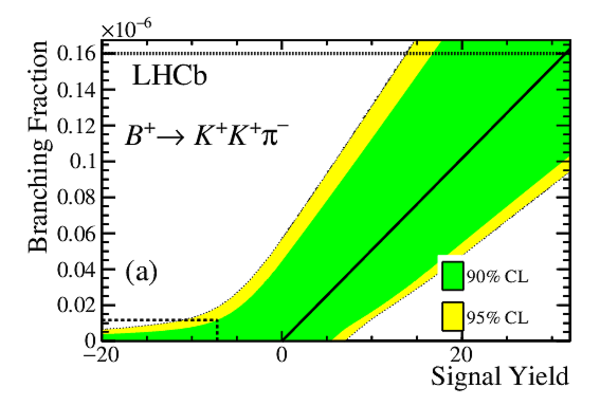
Feldman-Cousins 90% (green) and 95% (yellow) confidence level (CL) bands for (a) $ B ^+ \rightarrow K ^+ K ^+ \pi ^- $ and (b) $ B ^+ \rightarrow \pi ^+ \pi ^+ K ^- $ , including statistical and systematic uncertainties. The black solid line shows the expected central value of the true branching fraction as a function of the fitted number of signal events. The horizontal dotted lines show the 90% CL upper limits on the branching fractions prior to the present measurement. The dashed lines in the lower left corner of each figure show the equivalent 90% CL upper limits reported in this paper. |
limits[..].pdf [63 KiB] HiDef png [195 KiB] Thumbnail [165 KiB] *.C file |
|
|
limits[..].pdf [25 KiB] HiDef png [185 KiB] Thumbnail [159 KiB] *.C file |

|
|
|
Animated gif made out of all figures. |
PAPER-2016-023.gif Thumbnail |

|
![HiDef png [281 KiB]](Directory_LHCb-PAPER-2016-023/hidef_feyn_KKpi_Bp.png)
![HiDef png [282 KiB]](Directory_LHCb-PAPER-2016-023/hidef_feyn_pipiK_Bp.png)
![HiDef png [283 KiB]](Directory_LHCb-PAPER-2016-023/hidef_KKPi_SS_dofitplot_upper.png)
![HiDef png [314 KiB]](Directory_LHCb-PAPER-2016-023/hidef_KKPi_OS_dofitplot_upper.png)
![HiDef png [266 KiB]](Directory_LHCb-PAPER-2016-023/hidef_KPiPi_SS_dofitplot_upper.png)
![HiDef png [284 KiB]](Directory_LHCb-PAPER-2016-023/hidef_KPiPi_OS_dofitplot_upper.png)
![HiDef png [195 KiB]](Directory_LHCb-PAPER-2016-023/hidef_limits-kkp_fitted.png)
![HiDef png [185 KiB]](Directory_LHCb-PAPER-2016-023/hidef_limits-ppk_fitted.png)
Tables and captions
|
Systematic uncertainties on the $ B ^+ \rightarrow K ^+ K ^+ \pi ^- $ and $ B ^+ \rightarrow \pi ^+ \pi ^+ K ^- $ branching fractions in units of $10^{-8}$ and $10^{-9}$, respectively. |
Table_1.pdf [48 KiB] HiDef png [64 KiB] Thumbnail [30 KiB] tex code |

|
![HiDef png [64 KiB]](Directory_LHCb-PAPER-2016-023/hidef_Table_1.png)
Created on 27 April 2024.