Measurement of forward $W\to e\nu$ production in $pp$ collisions at $\sqrt{s}=8$ TeV
[to restricted-access page]Information
LHCb-PAPER-2016-024
CERN-EP-2016-179
arXiv:1608.01484 [PDF]
(Submitted on 04 Aug 2016)
JHEP 10 (2016) 030
Inspire 1479453
Tools
Abstract
A measurement of the cross-section for $W \to e\nu$ production in $pp$ collisions is presented using data corresponding to an integrated luminosity of $2 $fb$^{-1}$ collected by the LHCb experiment at a centre-of-mass energy of $\sqrt{s}=8 $TeV. The electrons are required to have more than $20 $GeV of transverse momentum and to lie between 2.00 and 4.25 in pseudorapidity. The inclusive $W$ production cross-sections, where the $W$ decays to $e\nu$, are measured to be \begin{equation*} \sigma_{W^{+} \to e^{+}\nu_{e}}=1124.4\pm 2.1\pm 21.5\pm 11.2\pm 13.0 \mathrm{pb}, \end{equation*} \begin{equation*} \sigma_{W^{-} \to e^{-}\bar{\nu}_{e}}= 809.0\pm 1.9\pm 18.1\pm 7.0\pm \phantom{0}9.4 \mathrm{pb}, \end{equation*} where the first uncertainties are statistical, the second are systematic, the third are due to the knowledge of the LHC beam energy and the fourth are due to the luminosity determination. Differential cross-sections as a function of the electron pseudorapidity are measured. The $W^{+}/W^{-}$ cross-section ratio and production charge asymmetry are also reported. Results are compared with theoretical predictions at next-to-next-to-leading order in perturbative quantum chromodynamics. Finally, in a precise test of lepton universality, the ratio of $W$ boson branching fractions is determined to be \begin{equation*} \mathcal{B}(W \to e\nu)/\mathcal{B}(W \to \mu\nu)=1.020\pm 0.002\pm 0.019, \end{equation*} where the first uncertainty is statistical and the second is systematic.
Figures and captions
|
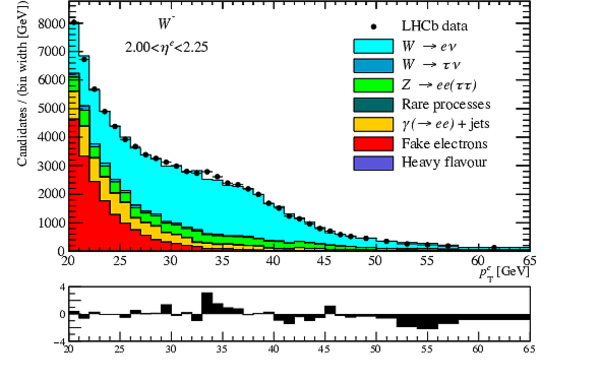
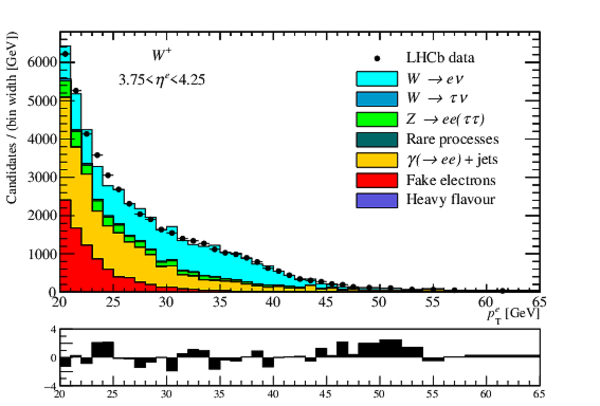
The inclusive fit to the $p^e_{\rm T}$ distribution of the full dataset. The $\chi^2/\mathrm{ndf}$ of the fit is 1.1 with 33 degrees of freedom. |
Fig1.pdf [52 KiB] HiDef png [206 KiB] Thumbnail [199 KiB] *.C file |

|
|
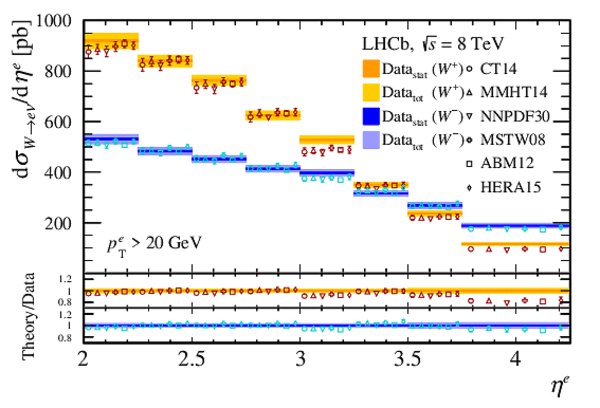
The differential $ W ^+$ and $ W ^-$ cross-sections in bins of $\eta^{ e }$. Measurements, represented as bands, are compared to NNLO predictions with different parameterisations of the PDFs (markers are displaced horizontally for presentation). The bottom panel displays the theory predictions divided by the measured cross-sections. |
Fig2.pdf [26 KiB] HiDef png [346 KiB] Thumbnail [242 KiB] *.C file |
|
|
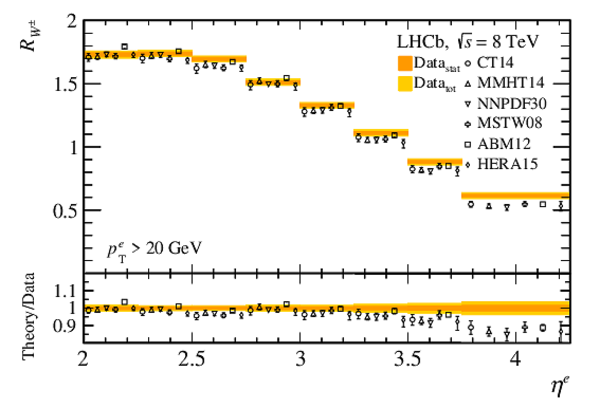
The $ W ^+$ to $ W ^-$ cross-section ratio in bins of $\eta^{ e }$. Measurements, represented as bands, are compared to NNLO predictions with different parameterisations of the PDFs (markers are displaced horizontally for presentation). The bottom panel displays the theory predictions divided by the measured cross-section ratios. |
Fig3.pdf [21 KiB] HiDef png [190 KiB] Thumbnail [168 KiB] *.C file |
|
|
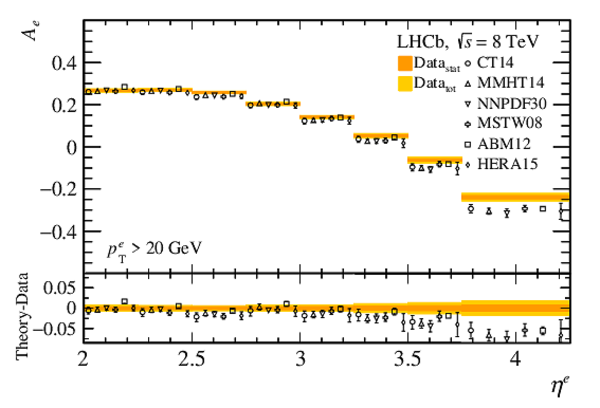
The $ W $ boson production charge asymmetry in bins of $\eta^{ e }$. Measurements, represented as bands, are compared to NNLO predictions with different parameterisations of the PDFs (markers are displaced horizontally for presentation). The bottom panel displays the difference between theory predictions and the measured charge asymmetry. |
Fig4.pdf [20 KiB] HiDef png [197 KiB] Thumbnail [176 KiB] *.C file |
|
|
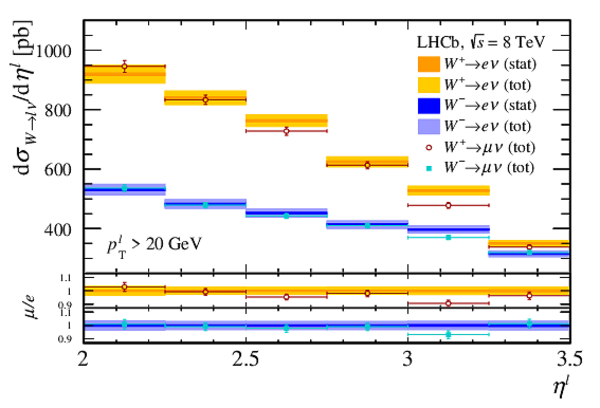
The differential $ W ^+$ and $ W ^-$ cross-sections in bins of $\eta^{l}$. The measurement using electrons, represented as bands, is compared to the measurement in the muon final state. The bottom panel displays the muon results divided by the measurements in the electron final state. |
Fig5.pdf [18 KiB] HiDef png [168 KiB] Thumbnail [149 KiB] *.C file |
|
|
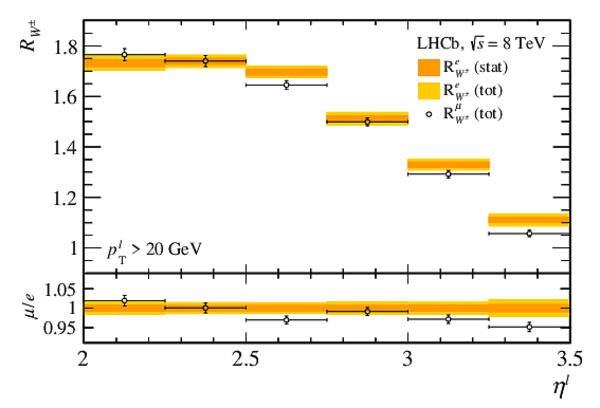
The $ W ^+$ to $ W ^-$ cross-section ratio in bins of $\eta^{l}$. The measurement using electrons, represented as bands, is compared to the measurement in the muon final state. The bottom panel displays the muon results divided by the measurements in the electron final state. |
Fig6.pdf [15 KiB] HiDef png [108 KiB] Thumbnail [101 KiB] *.C file |
|
|
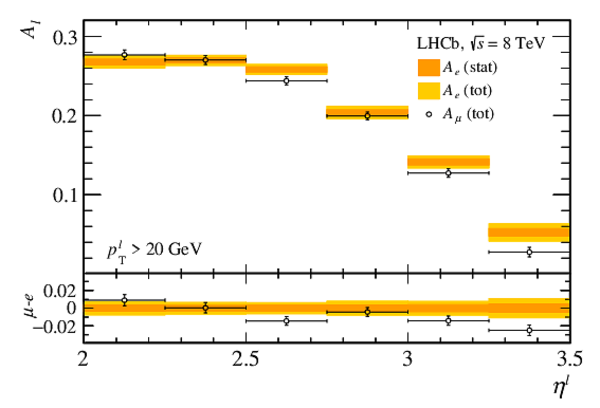
The $ W $ boson production charge asymmetry in bins of $\eta^{l}$. The measurement using electrons, represented as bands, is compared to the measurement in the muon final state. The bottom panel displays the difference between the muon and electron final states. |
Fig7.pdf [15 KiB] HiDef png [105 KiB] Thumbnail [96 KiB] *.C file |
|
|
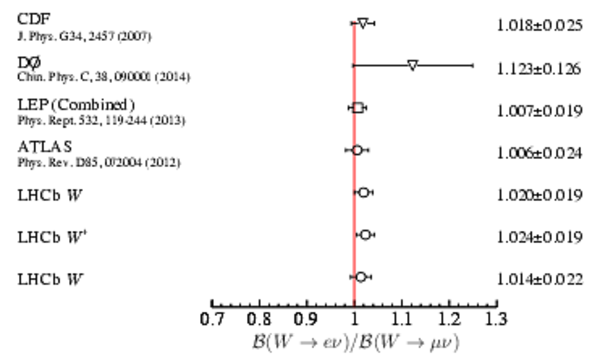
The ratio of branching fractions for the electron and muon final states determined for $ W $ , $ W ^+$ , and $ W ^-$ is compared to hadron collider and LEP results. The theory expectation is represented by the red line. |
Fig8.pdf [176 KiB] HiDef png [168 KiB] Thumbnail [167 KiB] *.C file |
|
|
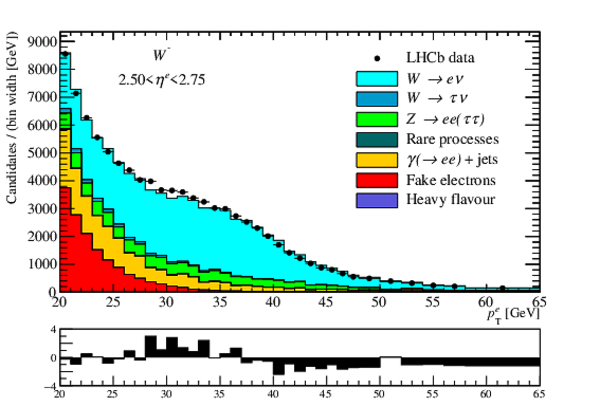
Fits to $p^e_{\rm T}$ for $ e ^-$ in bins of $\eta^{ e }$. Pulls are shown underneath. |
Fig9a.pdf [49 KiB] HiDef png [193 KiB] Thumbnail [172 KiB] *.C file |
|
|
Fig9b.pdf [49 KiB] HiDef png [198 KiB] Thumbnail [175 KiB] *.C file |

|
|
|
Fig9c.pdf [21 KiB] HiDef png [209 KiB] Thumbnail [192 KiB] *.C file |
|
|
|
Fig9d.pdf [21 KiB] HiDef png [205 KiB] Thumbnail [190 KiB] *.C file |

|
|
|
Fig9e.pdf [21 KiB] HiDef png [200 KiB] Thumbnail [186 KiB] *.C file |

|
|
|
Fig9f.pdf [21 KiB] HiDef png [201 KiB] Thumbnail [186 KiB] *.C file |

|
|
|
Fig9g.pdf [21 KiB] HiDef png [195 KiB] Thumbnail [180 KiB] *.C file |

|
|
|
Fig9h.pdf [21 KiB] HiDef png [194 KiB] Thumbnail [179 KiB] *.C file |

|
|
|
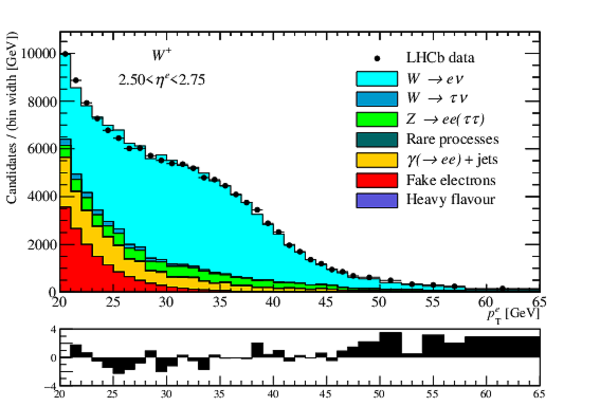
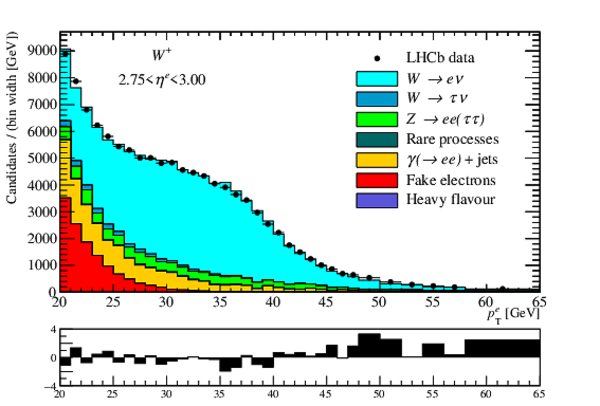
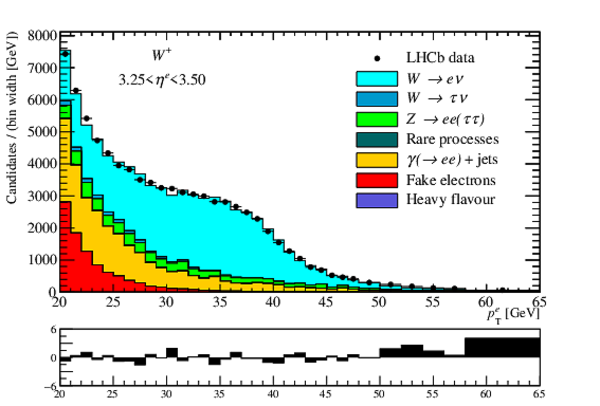
Fits to $p^e_{\rm T}$ for $ e ^+$ in bins of $\eta^{ e }$. Pulls are shown underneath. |
Fig10a.pdf [20 KiB] HiDef png [192 KiB] Thumbnail [174 KiB] *.C file |

|
|
Fig10b.pdf [20 KiB] HiDef png [192 KiB] Thumbnail [174 KiB] *.C file |

|
|
|
Fig10c.pdf [20 KiB] HiDef png [193 KiB] Thumbnail [176 KiB] *.C file |
|
|
|
Fig10d.pdf [21 KiB] HiDef png [211 KiB] Thumbnail [194 KiB] *.C file |
|
|
|
Fig10e.pdf [21 KiB] HiDef png [205 KiB] Thumbnail [190 KiB] *.C file |

|
|
|
Fig10f.pdf [21 KiB] HiDef png [205 KiB] Thumbnail [189 KiB] *.C file |
|
|
|
Fig10g.pdf [21 KiB] HiDef png [196 KiB] Thumbnail [182 KiB] *.C file |

|
|
|
Fig10h.pdf [21 KiB] HiDef png [193 KiB] Thumbnail [178 KiB] *.C file |
|
|
|
Animated gif made out of all figures. |
PAPER-2016-024.gif Thumbnail |

|
![HiDef png [206 KiB]](Directory_LHCb-PAPER-2016-024/hidef_Fig1.png)
![HiDef png [346 KiB]](Directory_LHCb-PAPER-2016-024/hidef_Fig2.png)
![HiDef png [190 KiB]](Directory_LHCb-PAPER-2016-024/hidef_Fig3.png)
![HiDef png [197 KiB]](Directory_LHCb-PAPER-2016-024/hidef_Fig4.png)
![HiDef png [168 KiB]](Directory_LHCb-PAPER-2016-024/hidef_Fig5.png)
![HiDef png [108 KiB]](Directory_LHCb-PAPER-2016-024/hidef_Fig6.png)
![HiDef png [105 KiB]](Directory_LHCb-PAPER-2016-024/hidef_Fig7.png)
![HiDef png [168 KiB]](Directory_LHCb-PAPER-2016-024/hidef_Fig8.png)
![HiDef png [193 KiB]](Directory_LHCb-PAPER-2016-024/hidef_Fig9a.png)
![HiDef png [198 KiB]](Directory_LHCb-PAPER-2016-024/hidef_Fig9b.png)
![HiDef png [209 KiB]](Directory_LHCb-PAPER-2016-024/hidef_Fig9c.png)
![HiDef png [205 KiB]](Directory_LHCb-PAPER-2016-024/hidef_Fig9d.png)
![HiDef png [200 KiB]](Directory_LHCb-PAPER-2016-024/hidef_Fig9e.png)
![HiDef png [201 KiB]](Directory_LHCb-PAPER-2016-024/hidef_Fig9f.png)
![HiDef png [195 KiB]](Directory_LHCb-PAPER-2016-024/hidef_Fig9g.png)
![HiDef png [194 KiB]](Directory_LHCb-PAPER-2016-024/hidef_Fig9h.png)
![HiDef png [192 KiB]](Directory_LHCb-PAPER-2016-024/hidef_Fig10a.png)
![HiDef png [192 KiB]](Directory_LHCb-PAPER-2016-024/hidef_Fig10b.png)
![HiDef png [193 KiB]](Directory_LHCb-PAPER-2016-024/hidef_Fig10c.png)
![HiDef png [211 KiB]](Directory_LHCb-PAPER-2016-024/hidef_Fig10d.png)
![HiDef png [205 KiB]](Directory_LHCb-PAPER-2016-024/hidef_Fig10e.png)
![HiDef png [205 KiB]](Directory_LHCb-PAPER-2016-024/hidef_Fig10f.png)
![HiDef png [196 KiB]](Directory_LHCb-PAPER-2016-024/hidef_Fig10g.png)
![HiDef png [193 KiB]](Directory_LHCb-PAPER-2016-024/hidef_Fig10h.png)
Tables and captions
|
Summary of the relative uncertainties on the $ W ^+ $ and $ W ^- $ boson cross-sections and on the cross-section ratio. Uncertainties marked with $^{\dagger}$ are assumed to be uncorrelated between bins; all others are taken to be correlated. |
Table_1.pdf [63 KiB] HiDef png [110 KiB] Thumbnail [49 KiB] tex code |

|
|
The Born level cross-section for $W^{+}$ boson production in bins of electron pseudorapidity. The first uncertainties are statistical, the second are systematic, the third are due to the knowledge of the LHC beam energy and the fourth are due to the luminosity measurement. The rightmost column gives values of the additional factor, $f^{\textup{FSR}}$, by which the results should be multiplied in order to give the cross-sections after FSR. |
Table_2.pdf [64 KiB] HiDef png [110 KiB] Thumbnail [59 KiB] tex code |

|
|
The Born level cross-section for $W^{-}$ boson production in bins of electron pseudorapidity. The first uncertainties are statistical, the second are systematic, the third are due to the knowledge of the LHC beam energy and the fourth are due to the luminosity measurement. The rightmost column gives values of the additional factor, $f^{\textup{FSR}}$, by which the results should be multiplied in order to give the cross-sections after FSR. |
Table_3.pdf [64 KiB] HiDef png [112 KiB] Thumbnail [59 KiB] tex code |

|
|
The $W^{+}$ to $W^{-}$ cross-section ratio in bins of electron pseudorapidity. The first uncertainties are statistical, the second are systematic and the third are due to the knowledge of the LHC beam energy. |
Table_4.pdf [41 KiB] HiDef png [141 KiB] Thumbnail [70 KiB] tex code |

|
|
The $ W $ boson production charge asymmetry in bins of electron pseudorapidity. The first uncertainties are statistical, the second are systematic and the third are due to the knowledge of the LHC beam energy. |
Table_5.pdf [34 KiB] HiDef png [142 KiB] Thumbnail [44 KiB] tex code |

|
|
Correlation coefficients of the systematic uncertainties for the differential $W^{+}$ cross-section measurement between bins of $\eta^{e}$. |
Table_6.pdf [13 KiB] HiDef png [58 KiB] Thumbnail [27 KiB] tex code |

|
|
Correlation coefficients of the systematic uncertainties for the differential $W^{-}$ cross-section measurement between bins of $\eta^{e}$. |
Table_7.pdf [13 KiB] HiDef png [58 KiB] Thumbnail [27 KiB] tex code |

|
|
Correlation coefficients of the systematic uncertainties for the differential $W^{+}$ and $W^{-}$ cross-section measurements between bins of $\eta^{e}$. The horizontal bin indices label bins of $\eta^{e}$ for electrons while vertical indices label bins for positrons. |
Table_8.pdf [13 KiB] HiDef png [92 KiB] Thumbnail [43 KiB] tex code |

|
![HiDef png [110 KiB]](Directory_LHCb-PAPER-2016-024/hidef_Table_1.png)
![HiDef png [110 KiB]](Directory_LHCb-PAPER-2016-024/hidef_Table_2.png)
![HiDef png [112 KiB]](Directory_LHCb-PAPER-2016-024/hidef_Table_3.png)
![HiDef png [141 KiB]](Directory_LHCb-PAPER-2016-024/hidef_Table_4.png)
![HiDef png [142 KiB]](Directory_LHCb-PAPER-2016-024/hidef_Table_5.png)
![HiDef png [58 KiB]](Directory_LHCb-PAPER-2016-024/hidef_Table_6.png)
![HiDef png [58 KiB]](Directory_LHCb-PAPER-2016-024/hidef_Table_7.png)
![HiDef png [92 KiB]](Directory_LHCb-PAPER-2016-024/hidef_Table_8.png)
Supplementary Material [file]
|
This ZIP file contains supplemetary material for the publication LHCb-PAPER-2016-024. The files are: supplementary.pdf : An overview of the extra tables chis.tex : Fit qualities signalFractions.tex : Signal fractions in bins of lepton pseudorapidity |
supple[..].pdf [86 KiB] HiDef png [119 KiB] Thumbnail [48 KiB] *C file |

|
![HiDef png [119 KiB]](Directory_LHCb-PAPER-2016-024/supplementary/hidef_supplementary-app.png)
Created on 27 April 2024.