Differential branching fraction and angular moments analysis of the decay $B^0 \to K^+ \pi^- \mu^+ \mu^-$ in the $K^*_{0,2}(1430)^0$ region
[to restricted-access page]Information
LHCb-PAPER-2016-025
CERN-EP-2016-215
arXiv:1609.04736 [PDF]
(Submitted on 15 Sep 2016)
JHEP 12 (2016) 065
Inspire 1486676
Tools
Abstract
Measurements of the differential branching fraction and angular moments of the decay $B^0 \to K^+ \pi^- \mu^+ \mu^-$ in the $K^+\pi^-$ invariant mass range $1330<m(K^+ \pi^-)<1530 MeV/c^2$ are presented. Proton-proton collision data are used, corresponding to an integrated luminosity of 3 $fb^{-1}$ collected by the LHCb experiment. Differential branching fraction measurements are reported in five bins of the invariant mass squared of the dimuon system, $q^2$, between 0.1 and 8.0 $GeV^2/c^4$. For the first time, an angular analysis sensitive to the S-, P- and D-wave contributions of this rare decay is performed. The set of 40 normalised angular moments describing the decay is presented for the $q^2$ range 1.1--6.0 $GeV^2/c^4$.
Figures and captions
|
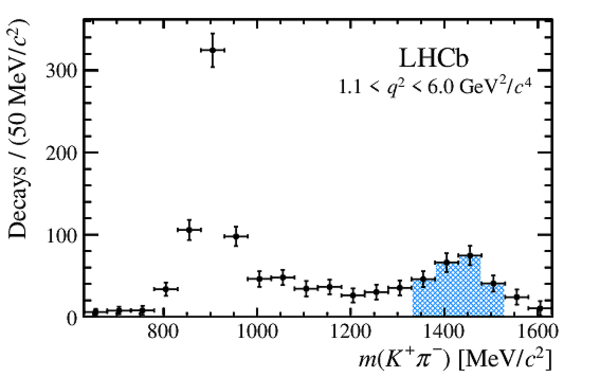
Background-subtracted $ m( K ^+ \pi ^- )$ distribution for $ B ^0 \rightarrow K ^+ \pi ^- \mu ^+\mu ^- $ decays in the range $1.1< q^2 <6.0 {\mathrm{ Ge V^2 /}c^4} $. The region $1330< m( K ^+ \pi ^- ) <1530 {\mathrm{ Me V /}c^2} $ is indicated by the blue, hatched area. |
Fig1.pdf [17 KiB] HiDef png [191 KiB] Thumbnail [142 KiB] *.C file |
|
|
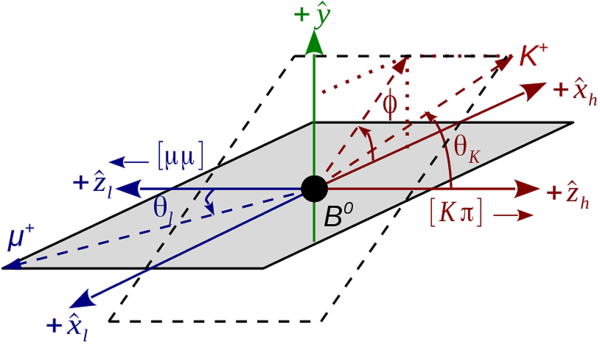
Angle conventions for (a) $\overline{ B }{} {}^0 \rightarrow K ^- \pi ^+ \mu ^- \mu ^+ $ and (b) $ B ^0 \rightarrow K ^+ \pi ^- \mu ^+ \mu ^- $, as described in Ref. [12]. The leptonic and hadronic frames are back-to-back with a common $\hat{y}$ axis. For the dihedral angle $\phi$ between the leptonic and hadronic decay planes, there is an additional sign flip $\phi\rightarrow -\phi$ compared to previous LHCb analyses [1,2,3,4]. |
Fig2a.pdf [19 KiB] HiDef png [251 KiB] Thumbnail [155 KiB] *.C file |

|
|
Fig2b.pdf [19 KiB] HiDef png [251 KiB] Thumbnail [155 KiB] *.C file |
|
|
|
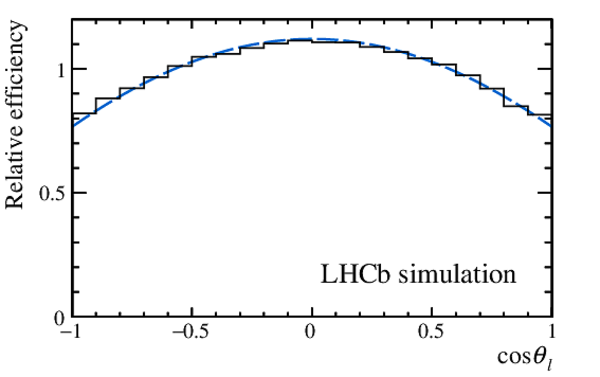
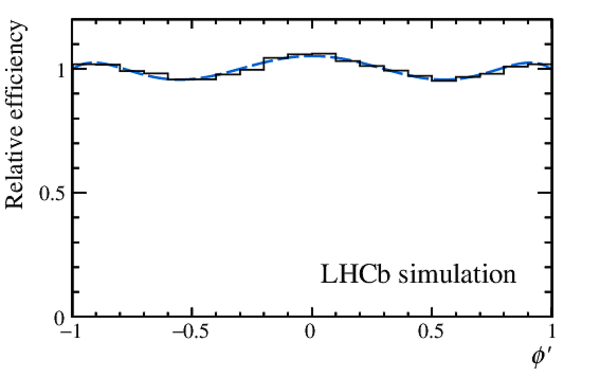
Relative efficiency in $\cos{\theta_\ell}$ , $\cos{\theta_K}$ and $\phi'$ in the region $1.1< q^2 <6.0 {\mathrm{ Ge V^2 /}c^4} $ and $1330< m( K ^+ \pi ^- ) <1530 {\mathrm{ Me V /}c^2} $ as determined from a moment analysis of simulated $ B ^0 \rightarrow K ^+ \pi ^- \mu ^+\mu ^- $ decays, shown as a histogram. The efficiency function is shown by the blue, dashed line. |
Fig3a.pdf [13 KiB] HiDef png [104 KiB] Thumbnail [85 KiB] *.C file |
|
|
Fig3b.pdf [13 KiB] HiDef png [109 KiB] Thumbnail [87 KiB] *.C file |

|
|
|
Fig3c.pdf [14 KiB] HiDef png [96 KiB] Thumbnail [78 KiB] *.C file |
|
|
|
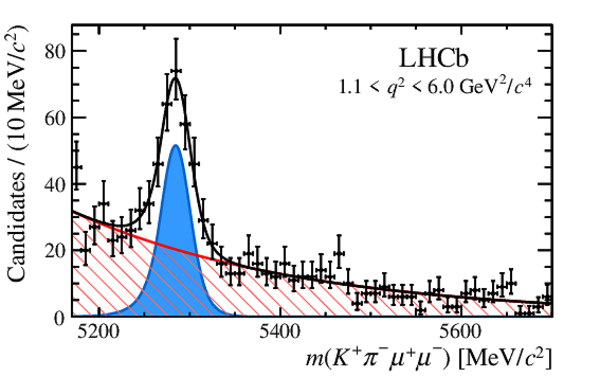
Invariant mass $ m( K ^+ \pi ^- \mu ^+ \mu ^- )$ for (left) the control decay $ B ^0 \rightarrow { J \mskip -3mu/\mskip -2mu\psi \mskip 2mu} K ^{*0} $ and (right) the signal decay $ B ^0 \rightarrow K ^+ \pi ^- \mu ^+\mu ^- $ in the bin $1.1 < q^2 < 6.0 {\mathrm{ Ge V^2 /}c^4} $. The solid black line represents the total fitted function. The individual components of the signal (blue, shaded area) and combinatorial background (red, hatched area) are also shown. |
Fig4a.pdf [20 KiB] HiDef png [151 KiB] Thumbnail [117 KiB] *.C file |

|
|
Fig4b.pdf [21 KiB] HiDef png [304 KiB] Thumbnail [220 KiB] *.C file |
|
|
|
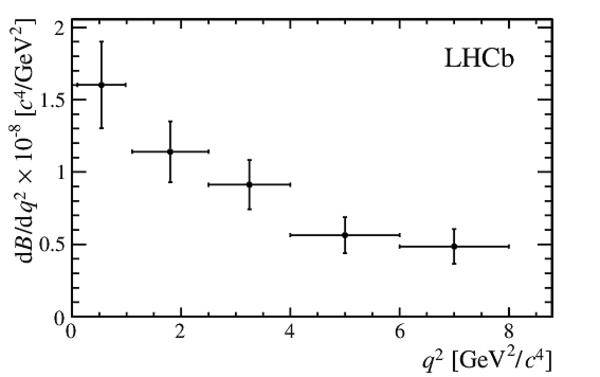
Differential branching fraction of $ B ^0 \rightarrow K ^+ \pi ^- \mu ^+\mu ^- $ in bins of $ q^2$ for the range $1330< m( K ^+ \pi ^- ) <1530 {\mathrm{ Me V /}c^2} $. The error bars indicate the sums in quadrature of the statistical and systematic uncertainties. |
Fig5.pdf [14 KiB] HiDef png [59 KiB] Thumbnail [32 KiB] *.C file |
|
|
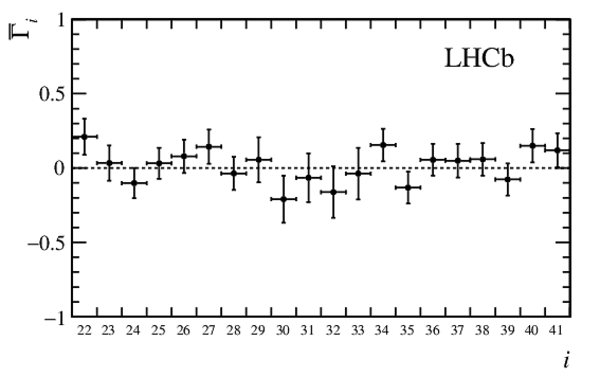
Measurement of the normalised moments, $\overline{\Gamma}_{i}$, of the decay $ B ^0 \rightarrow K ^+ \pi ^- \mu ^+\mu ^- $ in the range $1.1< q^2 <6.0 {\mathrm{ Ge V^2 /}c^4} $ and $1330< m( K ^+ \pi ^- ) <1530 {\mathrm{ Me V /}c^2} $. The error bars indicate the sums in quadrature of the statistical and systematic uncertainties. |
Fig6a.pdf [15 KiB] HiDef png [67 KiB] Thumbnail [41 KiB] *.C file |

|
|
Fig6b.pdf [15 KiB] HiDef png [73 KiB] Thumbnail [44 KiB] *.C file |
|
|
|
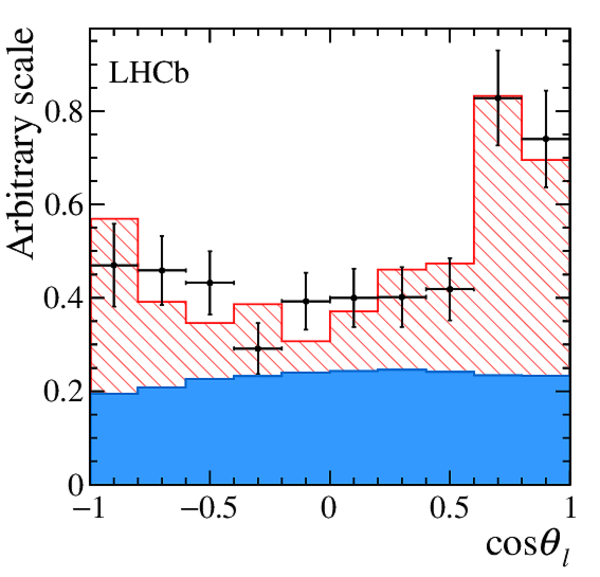
The distributions of each of the decay angles within the signal region. The acceptance-corrected data is represented by the points with error bars. The estimated signal distribution is shown by the blue, shaded histogram. The projected background from the upper mass sideband is shown by the red, hatched histogram, which is stacked onto the signal histogram. |
Fig7a.pdf [15 KiB] HiDef png [335 KiB] Thumbnail [232 KiB] *.C file |
|
|
Fig7b.pdf [15 KiB] HiDef png [388 KiB] Thumbnail [258 KiB] *.C file |

|
|
|
Fig7c.pdf [15 KiB] HiDef png [389 KiB] Thumbnail [257 KiB] *.C file |

|
|
|
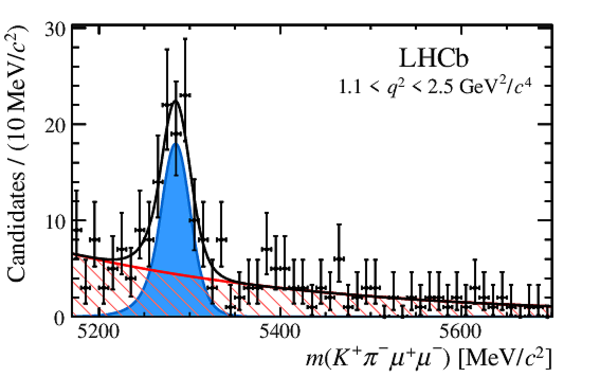
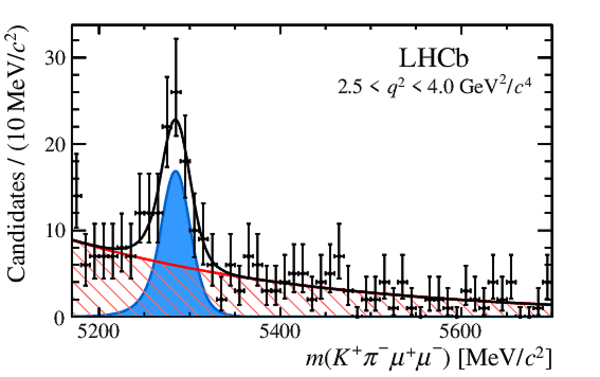
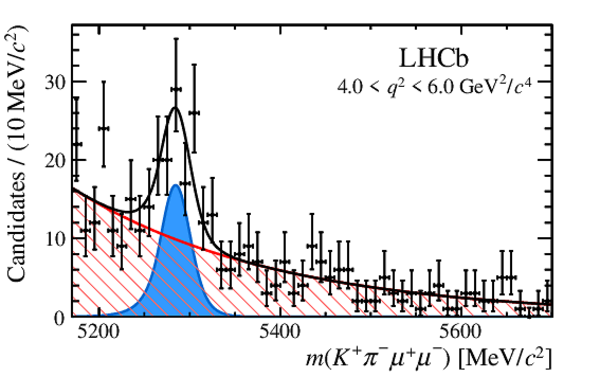
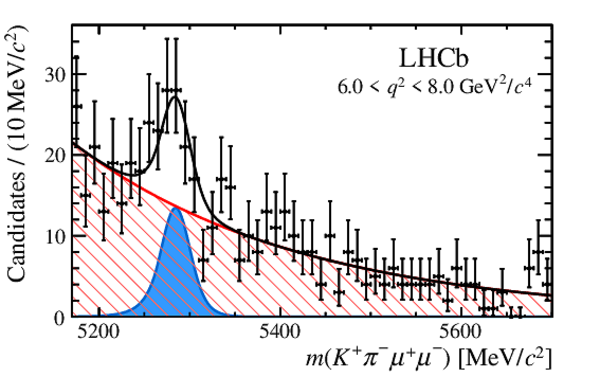
Invariant mass $ m( K ^+ \pi ^- \mu ^+ \mu ^- )$ distributions of the signal decay $ B ^0 \rightarrow K ^+ \pi ^- \mu ^+\mu ^- $ in each of the $ q^2$ bins used for the differential branching fraction measurement. The solid black line represents the total fitted function. The individual components of the signal (blue, shaded area) and combinatorial background (red, hatched area) are also shown. |
Fig8a.pdf [20 KiB] HiDef png [244 KiB] Thumbnail [178 KiB] *.C file |

|
|
Fig8b.pdf [20 KiB] HiDef png [276 KiB] Thumbnail [201 KiB] *.C file |
|
|
|
Fig8c.pdf [20 KiB] HiDef png [280 KiB] Thumbnail [206 KiB] *.C file |
|
|
|
Fig8d.pdf [20 KiB] HiDef png [311 KiB] Thumbnail [225 KiB] *.C file |
|
|
|
Fig8e.pdf [20 KiB] HiDef png [349 KiB] Thumbnail [245 KiB] *.C file |
|
|
|
Fig8f.pdf [21 KiB] HiDef png [304 KiB] Thumbnail [220 KiB] *.C file |

|
|
|
Animated gif made out of all figures. |
PAPER-2016-025.gif Thumbnail |

|
![HiDef png [191 KiB]](Directory_LHCb-PAPER-2016-025/hidef_Fig1.png)
![HiDef png [251 KiB]](Directory_LHCb-PAPER-2016-025/hidef_Fig2a.png)
![HiDef png [251 KiB]](Directory_LHCb-PAPER-2016-025/hidef_Fig2b.png)
![HiDef png [104 KiB]](Directory_LHCb-PAPER-2016-025/hidef_Fig3a.png)
![HiDef png [109 KiB]](Directory_LHCb-PAPER-2016-025/hidef_Fig3b.png)
![HiDef png [96 KiB]](Directory_LHCb-PAPER-2016-025/hidef_Fig3c.png)
![HiDef png [151 KiB]](Directory_LHCb-PAPER-2016-025/hidef_Fig4a.png)
![HiDef png [304 KiB]](Directory_LHCb-PAPER-2016-025/hidef_Fig4b.png)
![HiDef png [59 KiB]](Directory_LHCb-PAPER-2016-025/hidef_Fig5.png)
![HiDef png [67 KiB]](Directory_LHCb-PAPER-2016-025/hidef_Fig6a.png)
![HiDef png [73 KiB]](Directory_LHCb-PAPER-2016-025/hidef_Fig6b.png)
![HiDef png [335 KiB]](Directory_LHCb-PAPER-2016-025/hidef_Fig7a.png)
![HiDef png [388 KiB]](Directory_LHCb-PAPER-2016-025/hidef_Fig7b.png)
![HiDef png [389 KiB]](Directory_LHCb-PAPER-2016-025/hidef_Fig7c.png)
![HiDef png [244 KiB]](Directory_LHCb-PAPER-2016-025/hidef_Fig8a.png)
![HiDef png [276 KiB]](Directory_LHCb-PAPER-2016-025/hidef_Fig8b.png)
![HiDef png [280 KiB]](Directory_LHCb-PAPER-2016-025/hidef_Fig8c.png)
![HiDef png [311 KiB]](Directory_LHCb-PAPER-2016-025/hidef_Fig8d.png)
![HiDef png [349 KiB]](Directory_LHCb-PAPER-2016-025/hidef_Fig8e.png)
![HiDef png [304 KiB]](Directory_LHCb-PAPER-2016-025/hidef_Fig8f.png)
Tables and captions
|
Expected resonant contributions above the $ K ^{*}(892)^{0}$ mass range. For each, the spin-parity, $J^P$, and branching fraction to $ K \pi $, $\mathcal{B}(K\pi)$, are given (taken from Ref. [10]). |
Table_1.pdf [54 KiB] HiDef png [70 KiB] Thumbnail [35 KiB] tex code |

|
|
Differential branching fraction of $ B ^0 \rightarrow K ^+ \pi ^- \mu ^+\mu ^- $ in bins of $ q^2$ for the range $1330< m( K ^+ \pi ^- ) <1530 {\mathrm{ Me V /}c^2} $. The first uncertainty is statistical, the second systematic and the third due to the uncertainty on the $ B ^0 \rightarrow { J \mskip -3mu/\mskip -2mu\psi \mskip 2mu} K ^{*}(892)^{0}$ and $ { J \mskip -3mu/\mskip -2mu\psi \mskip 2mu} \rightarrow \mu ^+\mu ^- $ branching fractions. |
Table_2.pdf [42 KiB] HiDef png [107 KiB] Thumbnail [54 KiB] tex code |

|
|
Measurement of the normalised moments, $\overline{\Gamma}_{i}$, of the decay $ B ^0 \rightarrow K ^+ \pi ^- \mu ^+\mu ^- $ in the range $1.1< q^2 <6.0 {\mathrm{ Ge V^2 /}c^4} $ and $1330< m( K ^+ \pi ^- ) <1530 {\mathrm{ Me V /}c^2} $. The first uncertainty is statistical and the second systematic. |
Table_3.pdf [44 KiB] HiDef png [199 KiB] Thumbnail [116 KiB] tex code |

|
|
Summary of the main sources of systematic uncertainty for the differential branching fraction and the angular moments analysis. Typical ranges are quoted for the different $ q^2$ bins used in the differential branching fraction measurement, and for the moments measured in the angular analysis. The systematic uncertainties are significantly smaller than the statistical ones. |
Table_4.pdf [56 KiB] HiDef png [52 KiB] Thumbnail [23 KiB] tex code |

|
|
The transversity-basis moments of the 41 orthonormal angular functions $f_i(\Omega)$ in Eq. 1 [12]. The amplitudes correspond to the $\overline{ B }{} {}^0 $ decay. |
Table_5.pdf [77 KiB] HiDef png [303 KiB] Thumbnail [145 KiB] tex code |

|
![HiDef png [70 KiB]](Directory_LHCb-PAPER-2016-025/hidef_Table_1.png)
![HiDef png [107 KiB]](Directory_LHCb-PAPER-2016-025/hidef_Table_2.png)
![HiDef png [199 KiB]](Directory_LHCb-PAPER-2016-025/hidef_Table_3.png)
![HiDef png [52 KiB]](Directory_LHCb-PAPER-2016-025/hidef_Table_4.png)
![HiDef png [303 KiB]](Directory_LHCb-PAPER-2016-025/hidef_Table_5.png)
Supplementary Material [file]
| Supplementary material full pdf |
supple[..].pdf [108 KiB] |

|
Created on 27 April 2024.