Measurement of the CP-violating phase and decay-width difference in $B_s^0\to\psi(2S)\phi$ decays
[to restricted-access page]Information
LHCb-PAPER-2016-027
CERN-EP-2016-192
arXiv:1608.04855 [PDF]
(Submitted on 17 Aug 2016)
Phys. Lett. B762 (2016) 253
Inspire 1481810
Tools
Abstract
A time-dependent angular analysis of $B_s^0\to\psi(2S)\phi$ decays is performed using data recorded by the LHCb experiment. The data set corresponds to an integrated luminosity of 3.0\invfb collected during Run 1 of the LHC. The CP-violating phase and decay-width difference of the $B_s^0$ system are measured to be $\phi_s = 0.23^{+0.29}_{-0.28} \pm 0.02$ rad and $\Delta\Gamma_s = 0.066^{+0.041}_{-0.044} \pm 0.007$ ps$^{-1}$, respectively, where the first uncertainty is statistical and the second systematic. This is the first time that $\phi_s$ and $\Delta\Gamma_s$ have been measured in a decay containing the $\psi(2S)$ resonance.
Figures and captions
|
Definition of helicity angles. |
fig1a.pdf [29 KiB] HiDef png [36 KiB] Thumbnail [16 KiB] |

|
|
Distribution of $m(\psi(2S) K ^+ K ^- )$ for the selected $ B ^0_ s \rightarrow \psi(2S)\phi$ candidates. The total fit model is shown by the solid blue line, which is composed of a sum of two Crystal Ball functions for the signal and an exponential function for the background (long-dashed green line). |
fig2a.pdf [19 KiB] HiDef png [150 KiB] Thumbnail [121 KiB] |

|
|
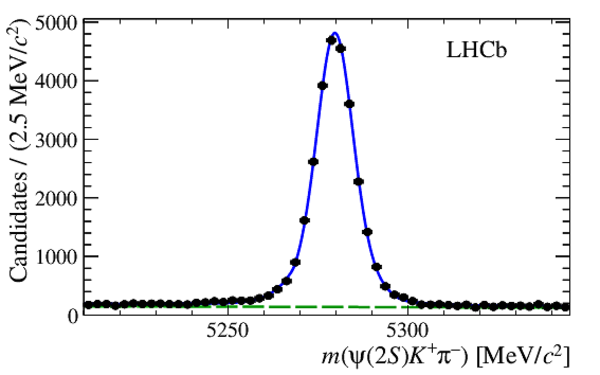
Distribution of $m(\psi(2S) K ^+ \pi^-)$ of the selected $ B ^0 \rightarrow \psi(2S)K^{*}(892)^{0}$ candidates. The total fit model is shown by the solid blue line, which is composed of a sum of two Crystal Ball functions for the signal and an exponential function for the background (long-dashed green line). |
fig3a.pdf [20 KiB] HiDef png [157 KiB] Thumbnail [128 KiB] |
|
|
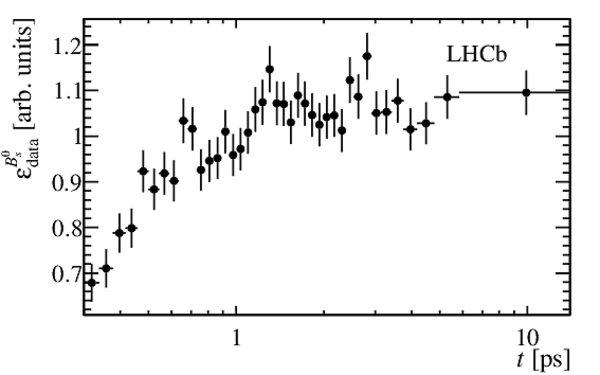
Decay-time efficiency $\varepsilon_{\rm data}^{ B ^0_ s }(t)$ in arbitrary units. |
fig4a.pdf [16 KiB] HiDef png [71 KiB] Thumbnail [46 KiB] |
|
|
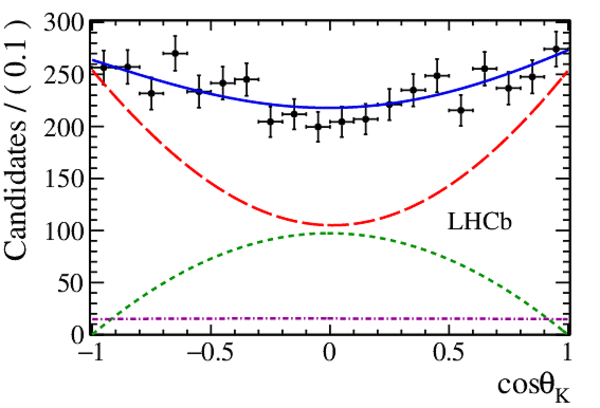
Decay-time and helicity-angle distributions for $ B ^0_ s \rightarrow \psi(2S)\phi$ decays (data points) with the one-dimensional projections of the fitted PDF. The solid blue line shows the total signal contribution, which is composed of $ C P$ -even (long-dashed red), $ C P$ -odd (short-dashed green) and $S$-wave (dash-dotted purple) contributions. |
fig5a.pdf [20 KiB] HiDef png [207 KiB] Thumbnail [164 KiB] |

|
|
fig5b.pdf [18 KiB] HiDef png [219 KiB] Thumbnail [183 KiB] |
|
|
|
fig5c.pdf [18 KiB] HiDef png [212 KiB] Thumbnail [172 KiB] |

|
|
|
fig5d.pdf [19 KiB] HiDef png [198 KiB] Thumbnail [169 KiB] |

|
|
|
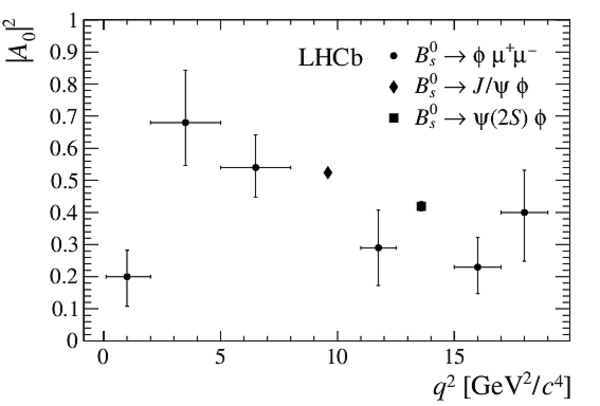
$|A_0|^2$ as a function of the invariant mass squared of the dimuon system, $q^2$. Data points are taken from Ref. [38] ($ B ^0_ s \rightarrow \phi\mu^+\mu^-$, circles), Ref. [3] ($ B ^0_ s \rightarrow { J \mskip -3mu/\mskip -2mu\psi \mskip 2mu} \phi$, diamond) and this paper (square). |
fig6a.pdf [14 KiB] HiDef png [90 KiB] Thumbnail [51 KiB] |
|
|
Animated gif made out of all figures. |
PAPER-2016-027.gif Thumbnail |

|
![HiDef png [36 KiB]](Directory_LHCb-PAPER-2016-027/hidef_fig1a.png)
![HiDef png [150 KiB]](Directory_LHCb-PAPER-2016-027/hidef_fig2a.png)
![HiDef png [157 KiB]](Directory_LHCb-PAPER-2016-027/hidef_fig3a.png)
![HiDef png [71 KiB]](Directory_LHCb-PAPER-2016-027/hidef_fig4a.png)
![HiDef png [207 KiB]](Directory_LHCb-PAPER-2016-027/hidef_fig5a.png)
![HiDef png [219 KiB]](Directory_LHCb-PAPER-2016-027/hidef_fig5b.png)
![HiDef png [212 KiB]](Directory_LHCb-PAPER-2016-027/hidef_fig5c.png)
![HiDef png [198 KiB]](Directory_LHCb-PAPER-2016-027/hidef_fig5d.png)
![HiDef png [90 KiB]](Directory_LHCb-PAPER-2016-027/hidef_fig6a.png)
Tables and captions
|
Results of the maximum likelihood fit to the selected $ B ^0_ s \rightarrow \psi(2S)\phi$ candidates including all acceptance and resolution effects. The first uncertainty is statistical and the second is systematic, which will be discussed in Section 7. |
Table_1.pdf [54 KiB] HiDef png [209 KiB] Thumbnail [93 KiB] tex code |

|
|
Correlation matrix of statistical uncertainties. |
Table_2.pdf [49 KiB] HiDef png [61 KiB] Thumbnail [16 KiB] tex code |

|
|
Summary of statistical and systematic uncertainties. Fields containing a dash (--) correspond to systematic uncertainties that are negligible. |
Table_3.pdf [62 KiB] HiDef png [102 KiB] Thumbnail [42 KiB] tex code |

|
![HiDef png [209 KiB]](Directory_LHCb-PAPER-2016-027/hidef_Table_1.png)
![HiDef png [61 KiB]](Directory_LHCb-PAPER-2016-027/hidef_Table_2.png)
![HiDef png [102 KiB]](Directory_LHCb-PAPER-2016-027/hidef_Table_3.png)
Created on 27 April 2024.