Measurement of the $b$-quark production cross-section in 7 and 13 TeV $pp$ collisions
[to restricted-access page]Information
LHCb-PAPER-2016-031
CERN-EP-2016-201
arXiv:1612.05140 [PDF]
(Submitted on 15 Dec 2016)
Phys. Rev. Lett. 118 (2017) 052002
Inspire 1504058
Tools
Abstract
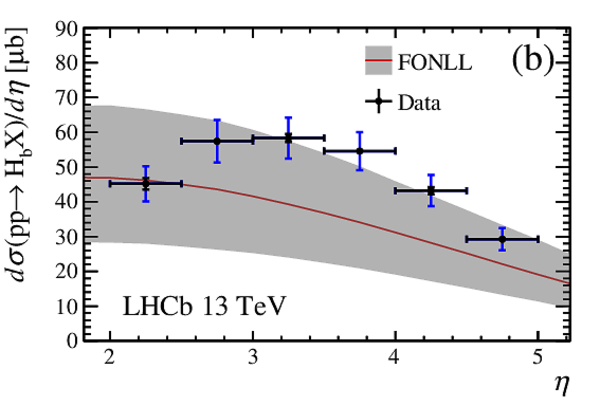
Measurements of the cross-section for producing \bquark quarks in the reaction $pp\to b\bar{b} X$ are reported in 7 and 13 TeV collisions at the LHC as a function of the pseudorapidity $\eta$ in the range $2<\eta<5$ covered by the acceptance of the LHCb experiment. The measurements are done using semileptonic decays of $b$-flavored hadrons decaying into a ground-state charmed hadron in association with a muon. The cross-sections in the covered $\eta$ range are $72.0\pm 0.3\pm6.8 \mu$b and $144\pm 1\pm 21 \mu$b for 7 and 13 TeV. The ratio is $2.00\pm0.02\pm0.26$, where the quoted uncertainties are statistical and systematic, respectively. The agreement with theoretical expectation is good at 7 TeV, but differs somewhat at 13 TeV. The measured ratio of cross-sections is larger at lower $\eta$ than the model prediction.
Figures and captions
|
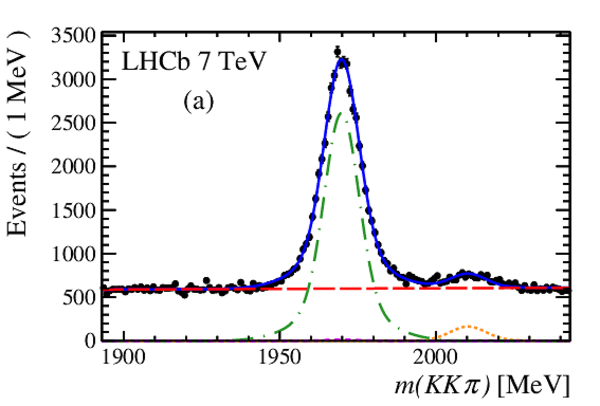
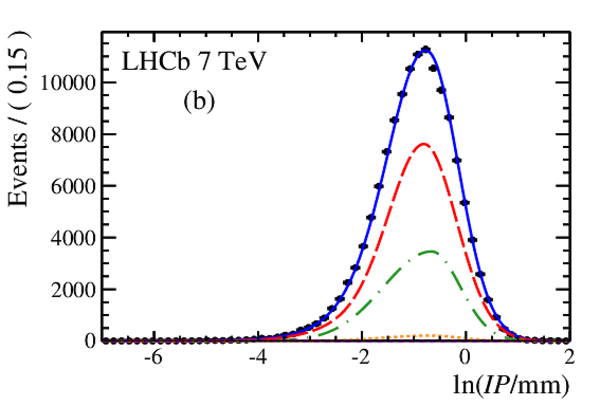
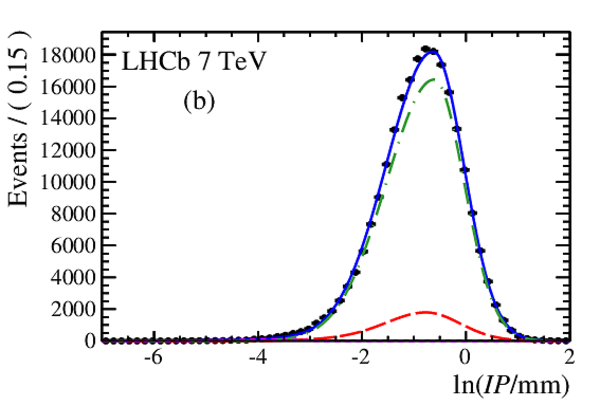
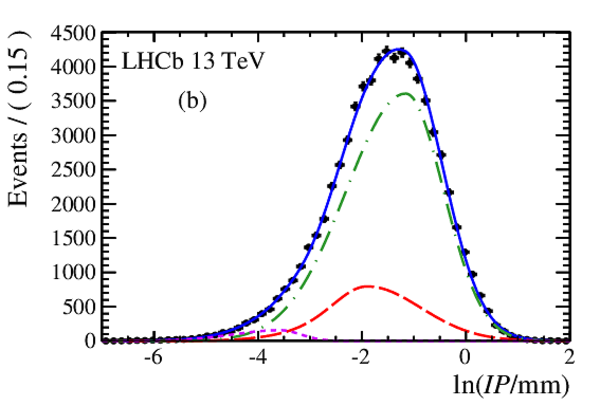
Fits to the $K^+K^-\pi^+$ invariant mass (a) and ln($I P$/mm) (b) distributions for data taken at 7 TeV data integrated over $2<\eta<5$. The data are shown as solid circles (black), and the overall fits as solid lines (blue). The dot-dashed (green) curve shows the $D_s^+$ signal from $b$ decay, while the dashed (purple) curve $D_s^+$ from prompt production. The dotted curve (orange) shows the $D^{*+}$ component. The dashed line (red) shows the combinatorial background. The same fits using a logarithmic scale are shown in (c) and (d). |
Ds_Mas[..].pdf [31 KiB] HiDef png [223 KiB] Thumbnail [176 KiB] *.C file |
|
|
Ds_IP_[..].pdf [22 KiB] HiDef png [199 KiB] Thumbnail [150 KiB] *.C file |
|
|
|
Ds_Mas[..].pdf [31 KiB] HiDef png [189 KiB] Thumbnail [151 KiB] *.C file |

|
|
|
Ds_IP_[..].pdf [22 KiB] HiDef png [230 KiB] Thumbnail [171 KiB] *.C file |

|
|
|
The cross-section as a function of $\eta$ for $\sigma(pp\rightarrow H_b X)$, where $H_b$ is a hadron that contains either a $b$ or a $\overline{b}$ quark, but not both, at center-of-mass energies of 7 TeV (a) and 13 TeV (b). The ratio is shown in (c). The smaller error bars (black) show the statistical uncertainties only, and the larger ones (blue) have the systematic uncertainties added in quadrature. The solid line (red) gives the theoretical prediction, while the solid shaded band gives the estimated uncertainty on the predictions at $\pm1 \sigma$, the cross-hatched at $\pm2 \sigma$, and the dashes at $\pm3 \sigma$. |
cross_[..].pdf [15 KiB] HiDef png [240 KiB] Thumbnail [201 KiB] *.C file |

|
|
Ecross[..].pdf [15 KiB] HiDef png [187 KiB] Thumbnail [168 KiB] *.C file |
|
|
|
Ecross[..].pdf [18 KiB] HiDef png [287 KiB] Thumbnail [225 KiB] *.C file |

|
|
|
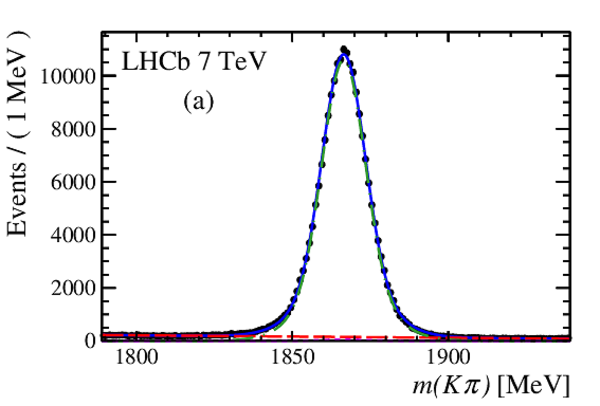
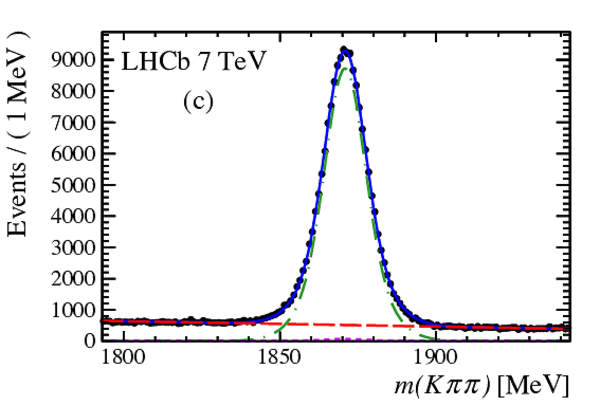
Fits to the invariant masses and ln($I P$/mm) distributions integrated over $2<\eta<5$ for 7 TeV running. The data are shown as solid circles (black), and the overall fits as solid lines (blue). The dot-dashed (green) curves show the charm signals from $b$ decay, while the dashed (purple) curves charm background from prompt production. The dashed line (red) shows the combinatorial background. The dotted curve (orange) shows the $D^{*+}$ component only for the $K^+K^-\pi^+$ mass distribution. (a) and (b) show $K^-\pi^+$ combinations, (c) and (d) show $K^-\pi^+\pi^+$ combinations, (e) and (f) show $K^-K^+\pi^+$ combinations, and (g) and (h) show $pK^-\pi^+$ combinations. The fitting procedure is described in the text. |
D0_Mas[..].pdf [31 KiB] HiDef png [196 KiB] Thumbnail [146 KiB] *.C file |
|
|
D0_IP_[..].pdf [22 KiB] HiDef png [214 KiB] Thumbnail [167 KiB] *.C file |
|
|
|
Dp_Mas[..].pdf [79 KiB] HiDef png [223 KiB] Thumbnail [177 KiB] *.C file |
|
|
|
Dp_IP_[..].pdf [23 KiB] HiDef png [221 KiB] Thumbnail [177 KiB] *.C file |

|
|
|
Ds_Mas[..].pdf [31 KiB] HiDef png [223 KiB] Thumbnail [176 KiB] *.C file |

|
|
|
Ds_IP_[..].pdf [22 KiB] HiDef png [199 KiB] Thumbnail [150 KiB] *.C file |

|
|
|
Lc_Mas[..].pdf [31 KiB] HiDef png [220 KiB] Thumbnail [179 KiB] *.C file |

|
|
|
Lc_IP_[..].pdf [23 KiB] HiDef png [213 KiB] Thumbnail [171 KiB] *.C file |
|
|
|
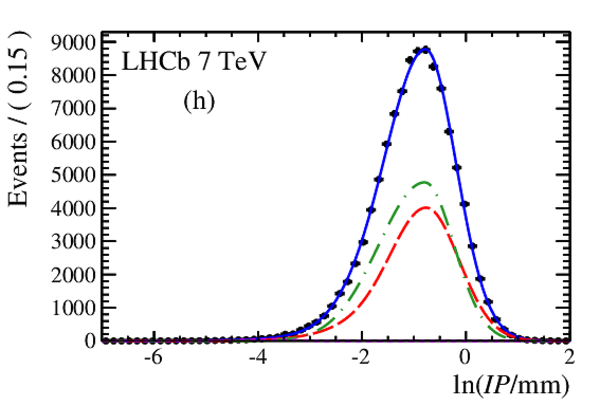
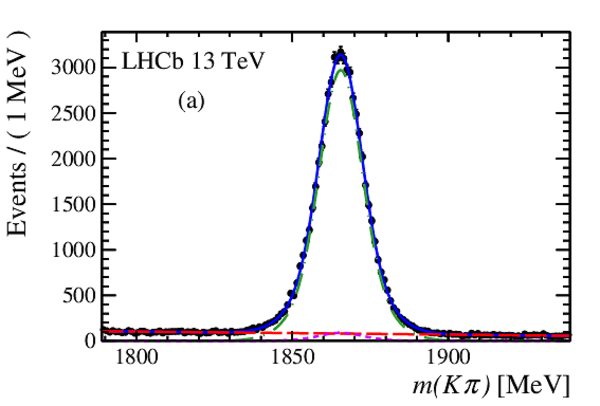
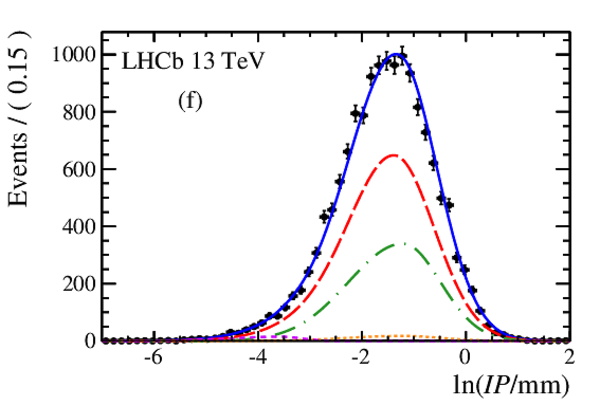
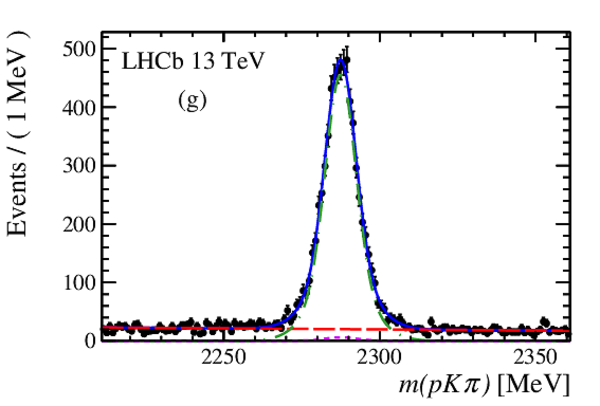
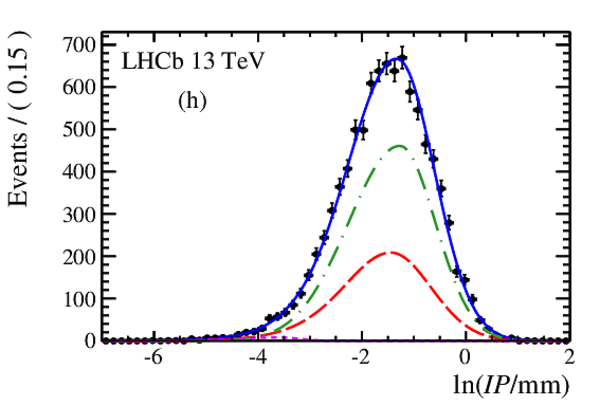
Fits to the invariant masses and ln($I P$/mm) distributions integrated over $2<\eta<5$ for 13 TeV running. The data are shown as solid circles (black), and the overall fits as solid lines (blue). The dot-dashed (green) curves show the charm signals from $b$ decay, while the dashed (purple) curves charm background from prompt production. The dashed lines (red) show the combinatorial background. The dotted curve (orange) shows the $D^{*+}$ component only for the $K^+K^-\pi^+$ mass distribution. (a) and (b) show $K^-\pi^+$ combinations, (c) and (d) show $K^-\pi^+\pi^+$ combinations, (e) and (f) show $K^-K^+\pi^+$ combinations, and (g) and (h) show $pK^-\pi^+$ combinations. The fitting procedure is described in the text. |
D0_Mas[..].pdf [31 KiB] HiDef png [205 KiB] Thumbnail [159 KiB] *.C file |
|
|
D0_IP_[..].pdf [23 KiB] HiDef png [221 KiB] Thumbnail [173 KiB] *.C file |
|
|
|
Dp_Mas[..].pdf [30 KiB] HiDef png [217 KiB] Thumbnail [167 KiB] *.C file |

|
|
|
Dp_IP_[..].pdf [23 KiB] HiDef png [227 KiB] Thumbnail [185 KiB] *.C file |

|
|
|
Ds_Mas[..].pdf [31 KiB] HiDef png [257 KiB] Thumbnail [207 KiB] *.C file |

|
|
|
Ds_IP_[..].pdf [22 KiB] HiDef png [204 KiB] Thumbnail [152 KiB] *.C file |
|
|
|
Lc_Mas[..].pdf [30 KiB] HiDef png [200 KiB] Thumbnail [156 KiB] *.C file |
|
|
|
Lc_IP_[..].pdf [22 KiB] HiDef png [203 KiB] Thumbnail [164 KiB] *.C file |
|
|
|
Overall detection efficiencies as a function of $p_{\mathrm{ T}}$ (charm+$\mu$) for the different $\eta$ intervals at 7 TeV. The uncertainties reflect both the statistical and systematic uncertainties added in quadrature. |
pt_eff[..].pdf [32 KiB] HiDef png [577 KiB] Thumbnail [381 KiB] *.C file |

|
|
Animated gif made out of all figures. |
PAPER-2016-031.gif Thumbnail |

|
![HiDef png [223 KiB]](Directory_LHCb-PAPER-2016-031/hidef_Ds_Mass_Pt_0_Eta_0.png)
![HiDef png [199 KiB]](Directory_LHCb-PAPER-2016-031/hidef_Ds_IP_Pt_0_Eta_0.png)
![HiDef png [189 KiB]](Directory_LHCb-PAPER-2016-031/hidef_Ds_Mass_Pt_0_Eta_0_Log.png)
![HiDef png [230 KiB]](Directory_LHCb-PAPER-2016-031/hidef_Ds_IP_Pt_0_Eta_0_Log.png)
![HiDef png [240 KiB]](Directory_LHCb-PAPER-2016-031/hidef_cross_section_7TeV_PtetaProjection.png)
![HiDef png [187 KiB]](Directory_LHCb-PAPER-2016-031/hidef_Ecross_section_13TeV_PtetaProjection.png)
![HiDef png [287 KiB]](Directory_LHCb-PAPER-2016-031/hidef_Ecross_section_Ratio_PtetaProjection.png)
![HiDef png [196 KiB]](Directory_LHCb-PAPER-2016-031/hidef_D0_Mass_Pt_0_Eta_0_Sup.png)
![HiDef png [214 KiB]](Directory_LHCb-PAPER-2016-031/hidef_D0_IP_Pt_0_Eta_0_Sup.png)
![HiDef png [223 KiB]](Directory_LHCb-PAPER-2016-031/hidef_Dp_Mass_Pt_0_Eta_0_Sup.png)
![HiDef png [221 KiB]](Directory_LHCb-PAPER-2016-031/hidef_Dp_IP_Pt_0_Eta_0_Sup.png)
![HiDef png [223 KiB]](Directory_LHCb-PAPER-2016-031/hidef_Ds_Mass_Pt_0_Eta_0_Sup.png)
![HiDef png [199 KiB]](Directory_LHCb-PAPER-2016-031/hidef_Ds_IP_Pt_0_Eta_0_Sup.png)
![HiDef png [220 KiB]](Directory_LHCb-PAPER-2016-031/hidef_Lc_Mass_Pt_0_Eta_0_Sup.png)
![HiDef png [213 KiB]](Directory_LHCb-PAPER-2016-031/hidef_Lc_IP_Pt_0_Eta_0_Sup.png)
![HiDef png [205 KiB]](Directory_LHCb-PAPER-2016-031/hidef_D0_Mass_Pt_0_Eta_0_13TeV_Sup.png)
![HiDef png [221 KiB]](Directory_LHCb-PAPER-2016-031/hidef_D0_IP_Pt_0_Eta_0_13TeV_Sup.png)
![HiDef png [217 KiB]](Directory_LHCb-PAPER-2016-031/hidef_Dp_Mass_Pt_0_Eta_0_13TeV_Sup.png)
![HiDef png [227 KiB]](Directory_LHCb-PAPER-2016-031/hidef_Dp_IP_Pt_0_Eta_0_13TeV_Sup.png)
![HiDef png [257 KiB]](Directory_LHCb-PAPER-2016-031/hidef_Ds_Mass_Pt_0_Eta_0_13TeV_Sup.png)
![HiDef png [204 KiB]](Directory_LHCb-PAPER-2016-031/hidef_Ds_IP_Pt_0_Eta_0_13TeV_Sup.png)
![HiDef png [200 KiB]](Directory_LHCb-PAPER-2016-031/hidef_Lc_Mass_Pt_0_Eta_0_13TeV_Sup.png)
![HiDef png [203 KiB]](Directory_LHCb-PAPER-2016-031/hidef_Lc_IP_Pt_0_Eta_0_13TeV_Sup.png)
![HiDef png [577 KiB]](Directory_LHCb-PAPER-2016-031/hidef_pt_efficienciesFine7TeV.png)
Tables and captions
|
Measured semileptonic decay branching fractions for $\overline{ B }{} {}^0$ and $ B ^- $ mesons. Yhe correlation of the errors in the underlying measurements in the average is taken into account. The CLEO numbers result from solving Eq. 4. |
Table_1.pdf [44 KiB] HiDef png [21 KiB] Thumbnail [8 KiB] tex code |

|
|
Measured semileptonic decay branching fractions for $B$ mesons and derived branching fractions for $\overline{ B }{} {}^0_ s $ and $\Lambda ^0_ b $ based on the equality of semileptonic widths and the lifetime ratios. |
Table_2.pdf [53 KiB] HiDef png [33 KiB] Thumbnail [13 KiB] tex code |

|
|
$pp\rightarrow H_b X$ cross-sections as a function of $\eta$ for 7 TeV and 13 TeV collisions and their ratio. The first uncertainty is statistical and the second systematic. |
Table_3.pdf [31 KiB] HiDef png [36 KiB] Thumbnail [15 KiB] tex code |

|
|
Systematic uncertainties independent of $\eta$ on the $pp\rightarrow H_bX$ cross-sections at 7 and 13 TeV and their ratio. |
Table_4.pdf [34 KiB] HiDef png [38 KiB] Thumbnail [14 KiB] tex code |

|
|
Charm hadron branching fractions for the decay modes used in this analysis. |
Table_5.pdf [57 KiB] HiDef png [34 KiB] Thumbnail [13 KiB] tex code |

|
|
Signal yields of charm hadron plus $\mu$ events. Note that the 7 TeV $D^0$ result is prescaled in the trigger by a factor of two with respect to the others. |
Table_6.pdf [40 KiB] HiDef png [16 KiB] Thumbnail [6 KiB] tex code |

|
![HiDef png [21 KiB]](Directory_LHCb-PAPER-2016-031/hidef_Table_1.png)
![HiDef png [33 KiB]](Directory_LHCb-PAPER-2016-031/hidef_Table_2.png)
![HiDef png [36 KiB]](Directory_LHCb-PAPER-2016-031/hidef_Table_3.png)
![HiDef png [38 KiB]](Directory_LHCb-PAPER-2016-031/hidef_Table_4.png)
![HiDef png [34 KiB]](Directory_LHCb-PAPER-2016-031/hidef_Table_5.png)
![HiDef png [16 KiB]](Directory_LHCb-PAPER-2016-031/hidef_Table_6.png)
Created on 27 April 2024.