Measurements of charm mixing and $C P$ violation using $D^0 \to K^\pm \pi^\mp$ decays
[to restricted-access page]Information
LHCb-PAPER-2016-033
CERN-EP-2016-280
arXiv:1611.06143 [PDF]
(Submitted on 18 Nov 2016)
Phys. Rev. D95 (2017) 052004
Inspire 1499047
Tools
Abstract
Measurements of charm mixing and $C P$ violation parameters from the decay-time-dependent ratio of $ D^0 \to K^+ \pi^- $ to $ D^0 \to K^- \pi^+ $ decay rates and the charge-conjugate ratio are reported. The analysis uses $\overline{B}\to D^{*+} \mu^- X$, and charge-conjugate decays, where $D^{*+}\to D^0 \pi^+$, and $D^0\to K^{\mp} \pi^{\pm}$. The $pp$ collision data are recorded by the LHCb experiment at center-of-mass energies $\sqrt{s}$ = 7 and 8 TeV, corresponding to an integrated luminosity of 3 fb$^{-1}$. The data are analyzed under three hypotheses: (i) mixing assuming $C P$ symmetry, (ii) mixing assuming no direct $C P$ violation in the Cabibbo-favored or doubly Cabibbo-suppressed decay amplitudes, and (iii) mixing allowing either direct $C P$ violation and/or $C P$ violation in the superpositions of flavor eigenstates defining the mass eigenstates. The data are also combined with those from a previous LHCb study of $D^0\to K \pi$ decays from a disjoint set of $ D^{*+} $ candidates produced directly in $pp$ collisions. In all cases, the data are consistent with the hypothesis of $C P$ symmetry.
Figures and captions
|
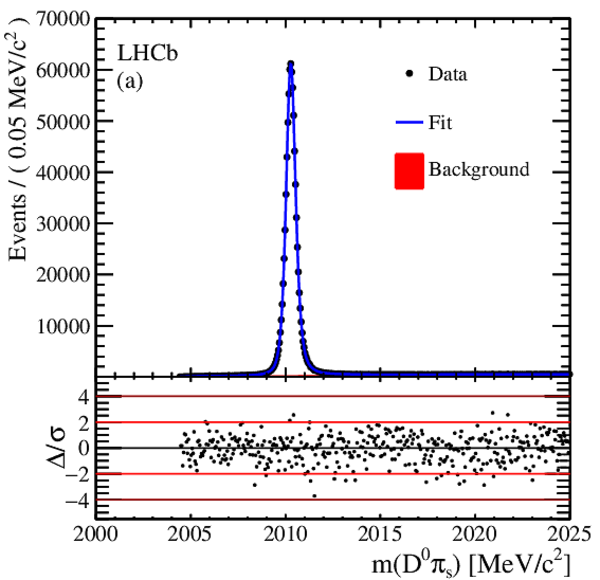
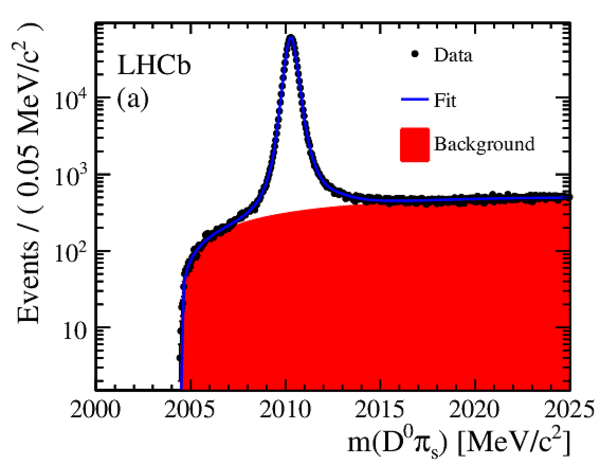
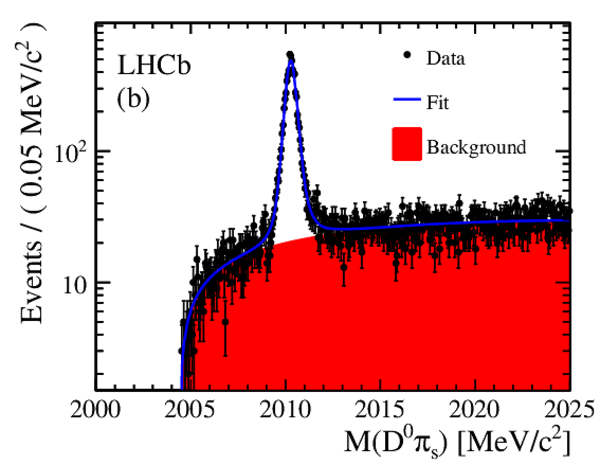
The time-integrated $ D ^0 \pi^+_s$ invariant mass distributions, after same-sign subtraction, for (a) RS decays and (b) WS decays. Fit projections are overlaid. Below each plot are the normalized residual distributions. |
Fig1a.pdf [82 KiB] HiDef png [280 KiB] Thumbnail [263 KiB] *.C file |
|
|
Fig1b.pdf [80 KiB] HiDef png [267 KiB] Thumbnail [255 KiB] *.C file |

|
|
|
Efficiency corrected and SS background subtracted ratios of WS/RS decays and fit projections for the DT sample. The top plot shows the $ D ^0$ $(R^+(t))$ sample. The middle plot shows the $\overline{ D }{} {}^0$ $(R^-(t))$ sample. The bottom plot shows the difference between the top and middle plots. In all cases, the error bars superposed on the data points are those from the $ \chi^2 $ minimization fits with no accounting for additional systematic uncertainties. The projections shown are for fits assuming $ C P$ symmetry (solid blue line), allowing no direct $CPV$ (dashed-dotted green line), and allowing all forms of $CPV$ (dashed magenta line). Bins are centered at the average value of $t/\tau$ of the bin. |
Fig2.pdf [18 KiB] HiDef png [375 KiB] Thumbnail [363 KiB] *.C file |

|
|
Efficiency-corrected data and fit projections for the DT (red open circles) and prompt (black filled circles) samples. The top plot shows the $ D ^0$ $(R^+(t))$ samples. The middle plot shows the $\overline{ D }{} {}^0$ $(R^-(t))$ samples. The bottom plot shows the difference between the top and middle plots. In all cases, the error bars superposed on the data points are those from the $ \chi^2 $ minimization fits without accounting for additional systematic uncertainties. The projections shown are for fits assuming $ C P$ symmetry (solid blue line), allowing no direct $CPV$ (dashed-dotted green line), and allowing all forms of $CPV$ (dashed magenta line). Bins are centered at the average $t/\tau$ of the bin. |
Fig3.pdf [24 KiB] HiDef png [403 KiB] Thumbnail [351 KiB] *.C file |

|
|
Animated gif made out of all figures. |
PAPER-2016-033.gif Thumbnail |

|
Tables and captions
|
Summary of systematic uncertainties for the DT analysis for each of the three fits described in the text. |
Table_1.pdf [51 KiB] HiDef png [109 KiB] Thumbnail [45 KiB] tex code |

|
|
Fitted parameters of the DT sample. The first uncertainties include the statistical uncertainty, as well as the peaking backgrounds and the $K\pi$ detection efficiency, and the second are systematic. |
Table_2.pdf [53 KiB] HiDef png [329 KiB] Thumbnail [154 KiB] tex code |

|
|
Simultaneous fit result of the DT and prompt samples. The prompt-only results from [1] are shown on the right for comparison. Statistical and systematic errors have been added in quadrature. |
Table_3.pdf [55 KiB] HiDef png [255 KiB] Thumbnail [127 KiB] tex code |

|
|
Systematic uncertainties for the simultaneous fits of the DT and prompt datasets. |
Table_4.pdf [50 KiB] HiDef png [110 KiB] Thumbnail [45 KiB] tex code |

|
|
Correlation matrix for the no $CPV$ fit to the DT data. |
Table_5.pdf [45 KiB] HiDef png [41 KiB] Thumbnail [17 KiB] tex code |

|
|
Correlation matrix for the no direct $CPV$ fit to the DT data. |
Table_6.pdf [47 KiB] HiDef png [45 KiB] Thumbnail [21 KiB] tex code |

|
|
Correlation matrix for the all $CPV$ allowed fit to the DT data. |
Table_7.pdf [47 KiB] HiDef png [16 KiB] Thumbnail [20 KiB] tex code |

|
|
Correlation matrix for the no $CPV$ simultaneous fit to the prompt + DT data sets. |
Table_8.pdf [46 KiB] HiDef png [44 KiB] Thumbnail [18 KiB] tex code |

|
|
Correlation matrix for the no direct $CPV$ simultaneous fit to the prompt + DT data sets. |
Table_9.pdf [47 KiB] HiDef png [45 KiB] Thumbnail [21 KiB] tex code |

|
|
Correlation matrix for the all $CPV$ allowed simultaneous fit to the prompt + DT data sets. |
Table_10.pdf [47 KiB] HiDef png [17 KiB] Thumbnail [21 KiB] tex code |

|
Supplementary Material [file]


![HiDef png [280 KiB]](Directory_LHCb-PAPER-2016-033/hidef_Fig1a.png)
![HiDef png [267 KiB]](Directory_LHCb-PAPER-2016-033/hidef_Fig1b.png)
![HiDef png [375 KiB]](Directory_LHCb-PAPER-2016-033/hidef_Fig2.png)
![HiDef png [403 KiB]](Directory_LHCb-PAPER-2016-033/hidef_Fig3.png)
![HiDef png [109 KiB]](Directory_LHCb-PAPER-2016-033/hidef_Table_1.png)
![HiDef png [329 KiB]](Directory_LHCb-PAPER-2016-033/hidef_Table_2.png)
![HiDef png [255 KiB]](Directory_LHCb-PAPER-2016-033/hidef_Table_3.png)
![HiDef png [110 KiB]](Directory_LHCb-PAPER-2016-033/hidef_Table_4.png)
![HiDef png [41 KiB]](Directory_LHCb-PAPER-2016-033/hidef_Table_5.png)
![HiDef png [45 KiB]](Directory_LHCb-PAPER-2016-033/hidef_Table_6.png)
![HiDef png [16 KiB]](Directory_LHCb-PAPER-2016-033/hidef_Table_7.png)
![HiDef png [44 KiB]](Directory_LHCb-PAPER-2016-033/hidef_Table_8.png)
![HiDef png [45 KiB]](Directory_LHCb-PAPER-2016-033/hidef_Table_9.png)
![HiDef png [17 KiB]](Directory_LHCb-PAPER-2016-033/hidef_Table_10.png)
![HiDef png [83 KiB]](Directory_LHCb-PAPER-2016-033/supplementary/hidef_fig_supp_1.png)
![HiDef png [120 KiB]](Directory_LHCb-PAPER-2016-033/supplementary/hidef_fig_supp_2a.png)
![HiDef png [193 KiB]](Directory_LHCb-PAPER-2016-033/supplementary/hidef_fig_supp_2b.png)
![HiDef png [209 KiB]](Directory_LHCb-PAPER-2016-033/supplementary/hidef_fig_supp_2c.png)
![HiDef png [124 KiB]](Directory_LHCb-PAPER-2016-033/supplementary/hidef_fig_supp_3a.png)
![HiDef png [213 KiB]](Directory_LHCb-PAPER-2016-033/supplementary/hidef_fig_supp_3b.png)
![HiDef png [176 KiB]](Directory_LHCb-PAPER-2016-033/supplementary/hidef_fig_supp_3c.png)
![HiDef png [217 KiB]](Directory_LHCb-PAPER-2016-033/supplementary/hidef_fig_supp_4a.png)
![HiDef png [194 KiB]](Directory_LHCb-PAPER-2016-033/supplementary/hidef_fig_supp_4a_logy.png)
![HiDef png [201 KiB]](Directory_LHCb-PAPER-2016-033/supplementary/hidef_fig_supp_4b.png)
![HiDef png [236 KiB]](Directory_LHCb-PAPER-2016-033/supplementary/hidef_fig_supp_4b_logy.png)
![HiDef png [285 KiB]](Directory_LHCb-PAPER-2016-033/supplementary/hidef_fig_supp_5.png)
![HiDef png [269 KiB]](Directory_LHCb-PAPER-2016-033/supplementary/hidef_fig_supp_5_logy.png)
![HiDef png [271 KiB]](Directory_LHCb-PAPER-2016-033/supplementary/hidef_fig_supp_6a.png)
![HiDef png [281 KiB]](Directory_LHCb-PAPER-2016-033/supplementary/hidef_fig_supp_6a_logy.png)
![HiDef png [269 KiB]](Directory_LHCb-PAPER-2016-033/supplementary/hidef_fig_supp_6b.png)
![HiDef png [279 KiB]](Directory_LHCb-PAPER-2016-033/supplementary/hidef_fig_supp_6b_logy.png)
![HiDef png [275 KiB]](Directory_LHCb-PAPER-2016-033/supplementary/hidef_fig_supp_6c.png)
![HiDef png [285 KiB]](Directory_LHCb-PAPER-2016-033/supplementary/hidef_fig_supp_6c_logy.png)
![HiDef png [272 KiB]](Directory_LHCb-PAPER-2016-033/supplementary/hidef_fig_supp_6d.png)
![HiDef png [279 KiB]](Directory_LHCb-PAPER-2016-033/supplementary/hidef_fig_supp_6d_logy.png)
![HiDef png [284 KiB]](Directory_LHCb-PAPER-2016-033/supplementary/hidef_fig_supp_6e.png)
![HiDef png [275 KiB]](Directory_LHCb-PAPER-2016-033/supplementary/hidef_fig_supp_6e_logy.png)
Created on 27 April 2024.