Information
LHCb-PAPER-2016-036
CERN-EP-2016-255
arXiv:1610.08288 [PDF]
(Submitted on 26 Oct 2016)
Phys. Rev. Lett. 118 (2017) 081801
Inspire 1494585
Tools
Abstract
A search for the $B^{0}\to K^{+}K^{-}$ decay is performed using $pp$-collision data collected by LHCb. The data set corresponds to integrated luminosities of 1 and 2 fb$^{-1}$ at center-of-mass energies of 7 and 8 TeV, respectively. This decay is observed for the first time, with a significance of more than five standard deviations. The analysis also results in an improved measurement of the branching fraction for the $B_s^0\to \pi^+\pi^-$ decay. The measured branching fractions are $BR(B^0\to K^+K^-) = (7.80 \pm 1.27 \pm 0.81 \pm 0.21) \times 10^{-8}$ and $BR(B_s^0\to\pi^+\pi^-) = (6.91 \pm 0.54 \pm 0.63 \pm 0.19 \pm 0.40) \times 10^{-7}$. The first uncertainty is statistical, the second is systematic, the third is due to the uncertainty on the $B^0\to K^+\pi^-$ branching fraction used as a normalization. For the $B_s^0$ mode, the fourth accounts for the uncertainty on the ratio of the probabilities for $b$ quarks to hadronize into $B_s^0$ and $B^0$ mesons.
Figures and captions
|
Dominant Feynman graphs contributing to the $ B ^0 \rightarrow K ^+ K ^- $ and $ B ^0_ s \rightarrow \pi ^+ \pi ^- $ decay amplitudes: (left) penguin-annihilation and (right) $W$-exchange topologies. |
Fig1a.pdf [248 KiB] HiDef png [38 KiB] Thumbnail [24 KiB] *.C file |

|
|
Fig1b.pdf [246 KiB] HiDef png [27 KiB] Thumbnail [16 KiB] *.C file |

|
|
|
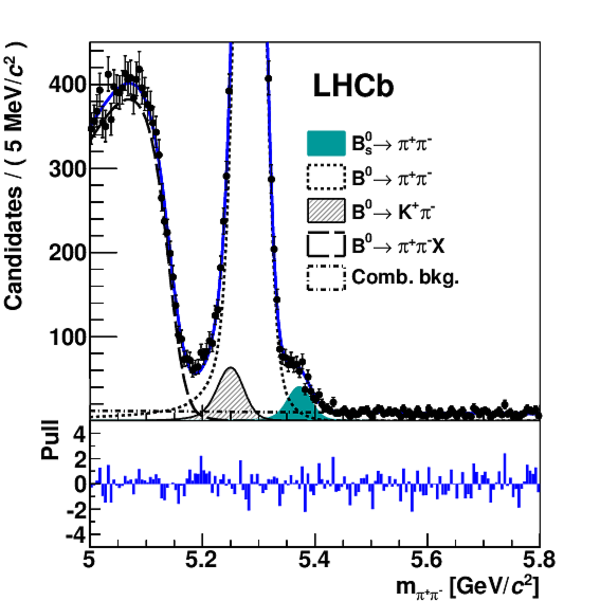
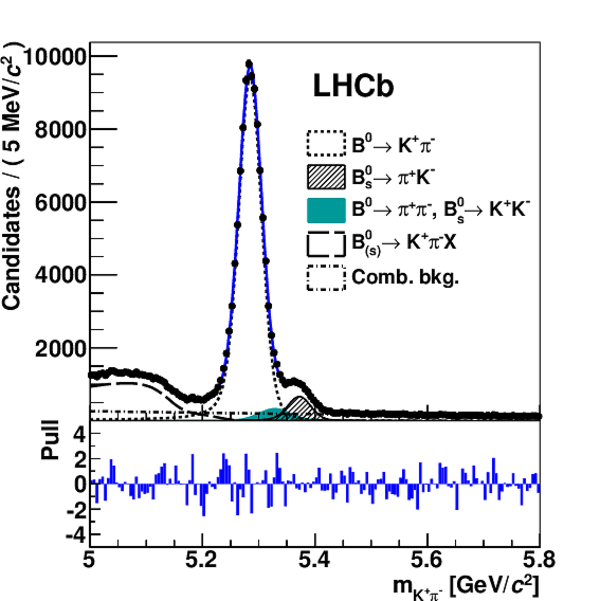
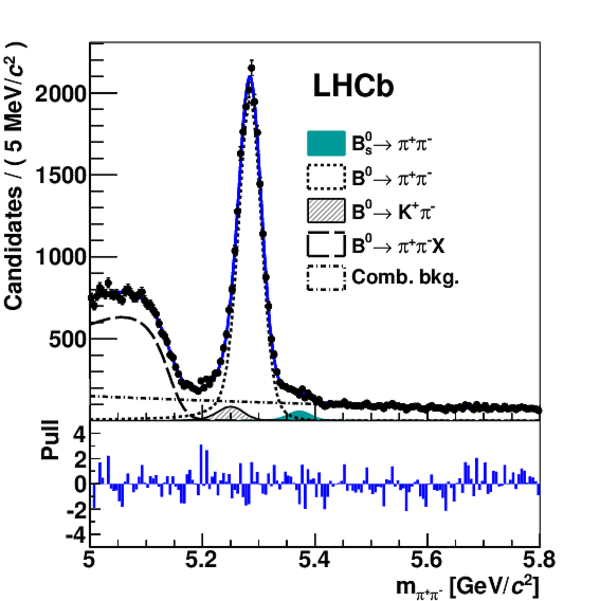
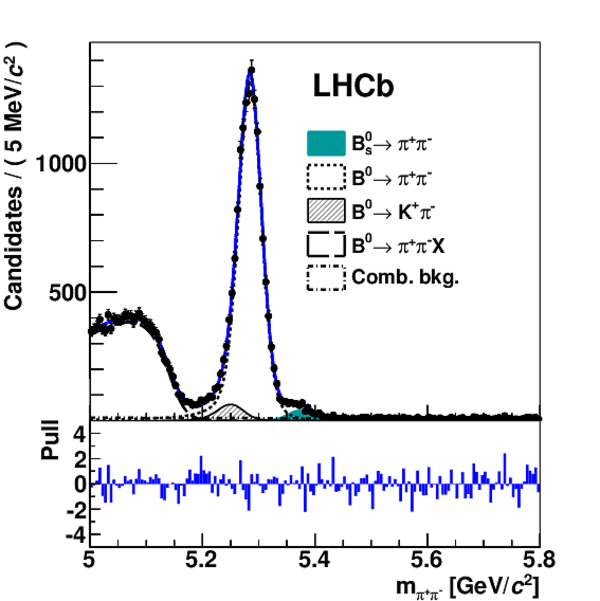
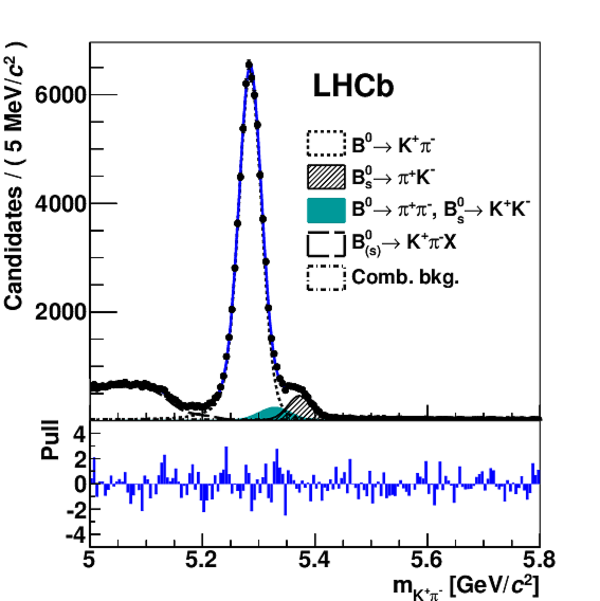
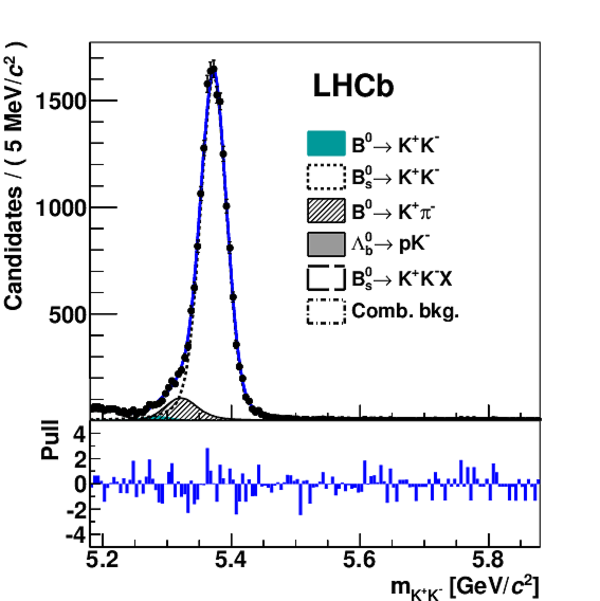
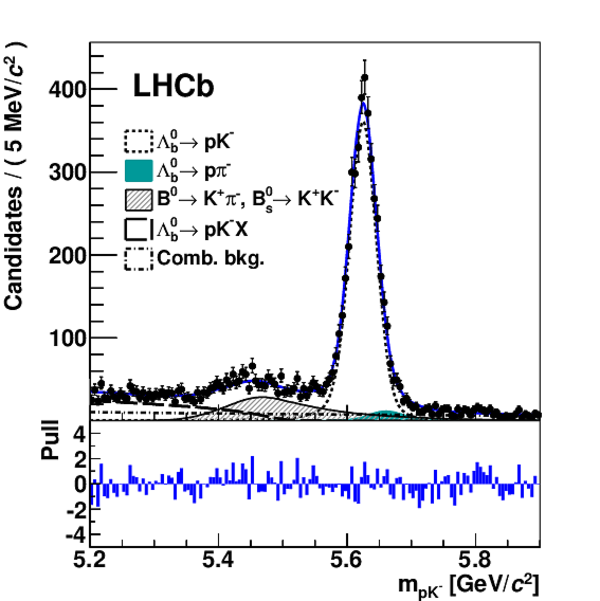
Distributions of (left) $m_{ K ^+ K ^- }$ and (right) $m_{\pi ^+ \pi ^- }$ for candidates passing $S_{ K ^+ K ^- }$ and $S_{\pi ^+ \pi ^- }$, respectively. The continuous (blue) curves represent the results of the best fits to the data points. The most relevant contributions to the invariant mass spectra are shown as indicated in the legends. The vertical scales are chosen to magnify the relevant signal regions. The bin-by-bin differences between the fits and the data, in units of standard deviations, are also shown. |
Fig2a.pdf [36 KiB] HiDef png [307 KiB] Thumbnail [268 KiB] *.C file |

|
|
Fig2b.pdf [42 KiB] HiDef png [317 KiB] Thumbnail [270 KiB] *.C file |
|
|
|
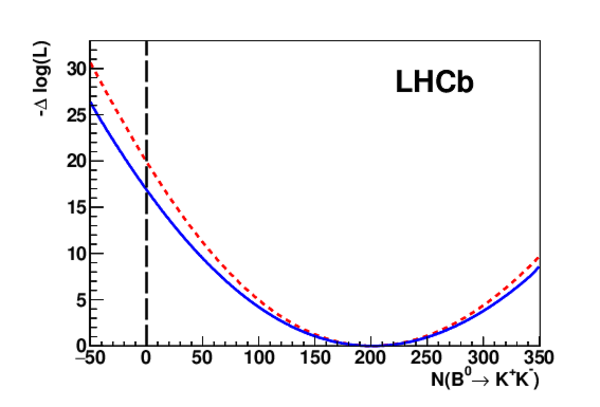
Log-likelihood ratio as a function of the $ B ^0 \rightarrow K ^+ K ^- $ signal yield. The dashed (red) and continuous (blue) curves correspond to the exclusion and to the inclusion of systematic uncertainties, respectively. |
Fig3.pdf [13 KiB] HiDef png [118 KiB] Thumbnail [82 KiB] *.C file |
|
|
Animated gif made out of all figures. |
PAPER-2016-036.gif Thumbnail |

|
![HiDef png [38 KiB]](Directory_LHCb-PAPER-2016-036/hidef_Fig1a.png)
![HiDef png [27 KiB]](Directory_LHCb-PAPER-2016-036/hidef_Fig1b.png)
![HiDef png [307 KiB]](Directory_LHCb-PAPER-2016-036/hidef_Fig2a.png)
![HiDef png [317 KiB]](Directory_LHCb-PAPER-2016-036/hidef_Fig2b.png)
![HiDef png [118 KiB]](Directory_LHCb-PAPER-2016-036/hidef_Fig3.png)
Tables and captions
|
Systematic uncertainties on the yields for the $ B ^0 \rightarrow K ^+ K ^- $ and $ B ^0_ s \rightarrow \pi ^+ \pi ^- $ decays. |
Table_1.pdf [53 KiB] HiDef png [52 KiB] Thumbnail [23 KiB] tex code |

|
![HiDef png [52 KiB]](Directory_LHCb-PAPER-2016-036/hidef_Table_1.png)
Supplementary Material [file]
| Supplementary material full pdf |
Supple[..].pdf [488 KiB] |
|
|
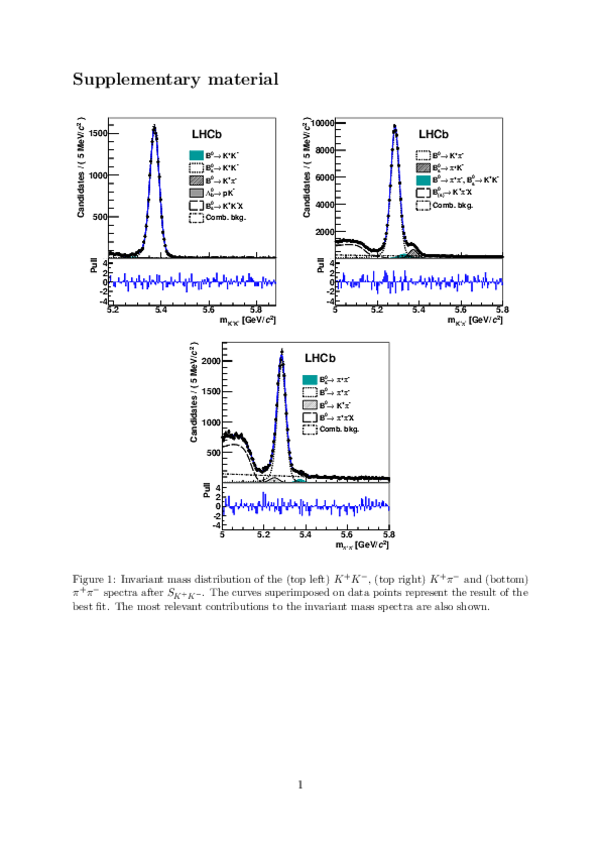
This ZIP file contains supplemetary material for the publication LHCb-PAPER-2016-036. The files are: Supplementary.pdf : An overview of the extra figures and tables *.pdf, *.png, *.eps *.C : The figures in variuous formats |
Fig1a.pdf [38 KiB] HiDef png [224 KiB] Thumbnail [202 KiB] *C file |

|
|
Fig1b.pdf [43 KiB] HiDef png [265 KiB] Thumbnail [244 KiB] *C file |
|
|
|
Fig1c.pdf [44 KiB] HiDef png [264 KiB] Thumbnail [247 KiB] *C file |
|
|
|
Fig2a.pdf [41 KiB] HiDef png [301 KiB] Thumbnail [266 KiB] *C file |
|
|
|
Fig2b.pdf [42 KiB] HiDef png [326 KiB] Thumbnail [289 KiB] *C file |

|
|
|
Fig3a.pdf [44 KiB] HiDef png [241 KiB] Thumbnail [211 KiB] *C file |
|
|
|
Fig3b.pdf [43 KiB] HiDef png [244 KiB] Thumbnail [220 KiB] *C file |
|
|
|
Fig3c.pdf [37 KiB] HiDef png [233 KiB] Thumbnail [209 KiB] *C file |
|
|
|
Fig4a.pdf [41 KiB] HiDef png [293 KiB] Thumbnail [254 KiB] *C file |
|
|
|
Fig4b.pdf [41 KiB] HiDef png [323 KiB] Thumbnail [280 KiB] *C file |

|
![HiDef png [224 KiB]](Directory_LHCb-PAPER-2016-036/supplementary/hidef_Fig1a.png)
![HiDef png [265 KiB]](Directory_LHCb-PAPER-2016-036/supplementary/hidef_Fig1b.png)
![HiDef png [264 KiB]](Directory_LHCb-PAPER-2016-036/supplementary/hidef_Fig1c.png)
![HiDef png [301 KiB]](Directory_LHCb-PAPER-2016-036/supplementary/hidef_Fig2a.png)
![HiDef png [326 KiB]](Directory_LHCb-PAPER-2016-036/supplementary/hidef_Fig2b.png)
![HiDef png [241 KiB]](Directory_LHCb-PAPER-2016-036/supplementary/hidef_Fig3a.png)
![HiDef png [244 KiB]](Directory_LHCb-PAPER-2016-036/supplementary/hidef_Fig3b.png)
![HiDef png [233 KiB]](Directory_LHCb-PAPER-2016-036/supplementary/hidef_Fig3c.png)
![HiDef png [293 KiB]](Directory_LHCb-PAPER-2016-036/supplementary/hidef_Fig4a.png)
![HiDef png [323 KiB]](Directory_LHCb-PAPER-2016-036/supplementary/hidef_Fig4b.png)
Created on 27 April 2024.