Information
LHCb-PAPER-2016-037
CERN-EP-2016-203
arXiv:1608.06620 [PDF]
(Submitted on 23 Aug 2016)
Phys. Rev. Lett. 117 (2016) 261801
Inspire 1482943
Tools
Abstract
The $CP$ violation observables $S$ and $C$ in the decay channel $B^0 \rightarrow D^+ D^-$ are determined from a sample of proton-proton collisions at center-of-mass energies of 7 and 8 TeV, collected by the LHCb experiment and corresponding to an integrated luminosity of 3 fb$^{-1}$. The observable $S$ describes $CP$ violation in the interference between mixing and the decay amplitude, and $C$ parametrizes direct $CP$ violation in the decay. The following values are obtained from a flavor-tagged, decay-time-dependent analysis: \begin{align*} S &= -0.54 ^{+0.17}_{-0.16} \text{(stat)} \pm 0.05 \text{(syst)} ,\newline C &= \phantom{-}0.26 ^{+0.18}_{-0.17} \text{(stat)} \pm 0.02 \text{(syst)} . \end{align*} These values provide evidence for $CP$ violation at a significance level of 4.0 standard deviations. The phase shift due to higher-order Standard Model corrections is constrained to a small value of \begin{align*} \Delta\phi = -0.16 ^{+0.19}_{-0.21} \text{rad} . \end{align*}
Figures and captions
|
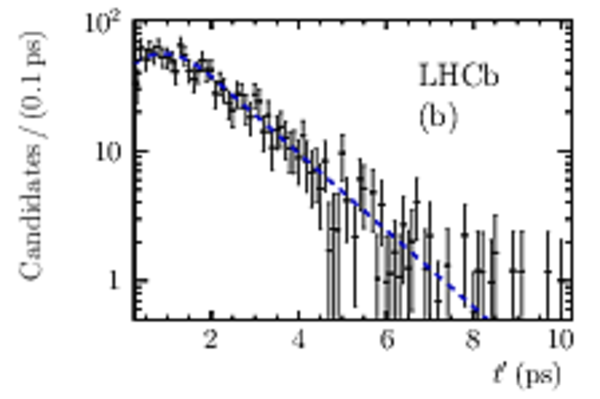
Distribution of the reconstructed mass of all $B^0 \rightarrow D^+ D^-$ candidates (a) and background-subtracted decay time distribution for tagged candidates (b). In plot (a) besides the data points and the projection of the full PDF (solid black) the projections of the $B^0$ signal (dashed blue), the $B^0_s \rightarrow D^+D^-$ background (short-dash-dotted turquoise), the $B^0 \rightarrow D^+_s D^-$ background (dotted green), the $B^0_s \rightarrow D^-_s D^+$ background (long-dash-three-dotted red) and the combinatorial background (long-dash-dotted purple) are shown. |
Fig1a.pdf [116 KiB] HiDef png [414 KiB] Thumbnail [410 KiB] *.C file |

|
|
Fig1b.pdf [43 KiB] HiDef png [207 KiB] Thumbnail [255 KiB] *.C file |
|
|
|
Decay-time-dependent signal yield asymmetry. The solid curve is the projection of the signal PDF given in \cref{eq:fullpdf}. |
Fig2.pdf [37 KiB] HiDef png [173 KiB] Thumbnail [202 KiB] *.C file |

|
|
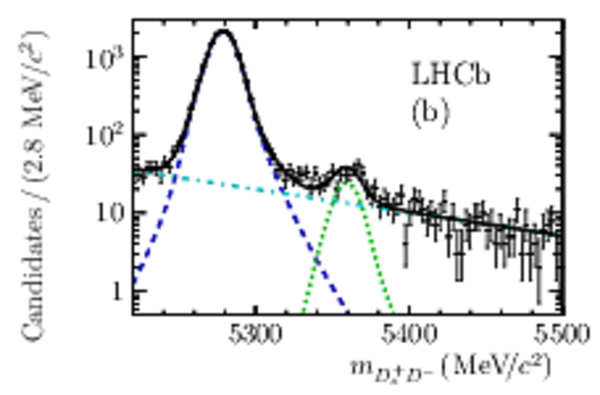
Masses of $B^0 \rightarrow D^+_s D^-$ candidates and projected PDFs, shown with a linear scale on the vertical axis (a) and a logarithmic scale (b). The solid line is the PDF projection, the blue dashed line represents the $B^0 \rightarrow D^+_s D^-$ component, while the dash-dotted cyan (dotted green) line represents the combinatorial ($B^0_s \rightarrow D^-_s D^+$) background. |
Fig3a.pdf [88 KiB] HiDef png [270 KiB] Thumbnail [306 KiB] *.C file |

|
|
Fig3b.pdf [72 KiB] HiDef png [296 KiB] Thumbnail [302 KiB] *.C file |
|
|
|
Raw mixing asymmetry as a function of the $B^0$ decay time for events tagged by (a) the OS tagger and (b) the SS tagger. The solid line represents the PDF projection. |
Fig4a.pdf [32 KiB] HiDef png [192 KiB] Thumbnail [248 KiB] *.C file |

|
|
Fig4b.pdf [32 KiB] HiDef png [184 KiB] Thumbnail [240 KiB] *.C file |

|
|
|
Animated gif made out of all figures. |
PAPER-2016-037.gif Thumbnail |

|
![HiDef png [414 KiB]](Directory_LHCb-PAPER-2016-037/hidef_Fig1a.png)
![HiDef png [207 KiB]](Directory_LHCb-PAPER-2016-037/hidef_Fig1b.png)
![HiDef png [173 KiB]](Directory_LHCb-PAPER-2016-037/hidef_Fig2.png)
![HiDef png [270 KiB]](Directory_LHCb-PAPER-2016-037/hidef_Fig3a.png)
![HiDef png [296 KiB]](Directory_LHCb-PAPER-2016-037/hidef_Fig3b.png)
![HiDef png [192 KiB]](Directory_LHCb-PAPER-2016-037/hidef_Fig4a.png)
![HiDef png [184 KiB]](Directory_LHCb-PAPER-2016-037/hidef_Fig4b.png)
Created on 02 May 2024.