New algorithms for identifying the flavour of ${\mathrm {B}} ^0$ mesons using pions and protons
[to restricted-access page]Information
LHCb-PAPER-2016-039
CERN-EP-2016-251
arXiv:1610.06019 [PDF]
(Submitted on 19 Oct 2016)
Eur. Phys. J. C77 (2017) 238
Inspire 1492731
Tools
Abstract
Two new algorithms for use in the analysis of $pp$ collision are developed to identify the flavour of $B^0$ mesons at production using pions and protons from the hadronization process. The algorithms are optimized and calibrated on data, using $B^0 \rightarrow D^- \pi^+$ decays from $pp$ collision data collected by LHCb at centre-of-mass energies of 7 and 8 TeV. The tagging power of the new pion algorithm is 60 greater than the previously available one; the algorithm using protons to identify the flavour of a $B^0$ meson is the first of its kind.
Figures and captions
|
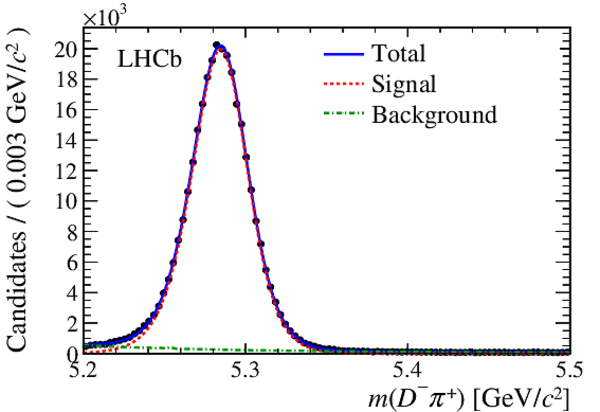
Mass distribution of $ B ^0 \rightarrow D^-\pi^+$ candidates with fit projections overlaid. Data points (black dots) correspond to the $ B ^0$ candidates selected in the 2 $ fb^{-1}$ data sample collected at $\sqrt{s} =8 \mathrm{ Te V} $. The solid blue curve represents the total fit function which is the sum of signal (red dashed) and combinatorial background (green dash-dotted). |
Fig1.pdf [26 KiB] HiDef png [221 KiB] Thumbnail [178 KiB] *.C file |
|
|
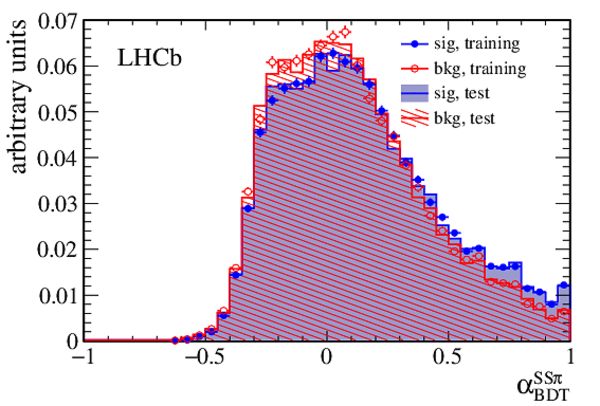
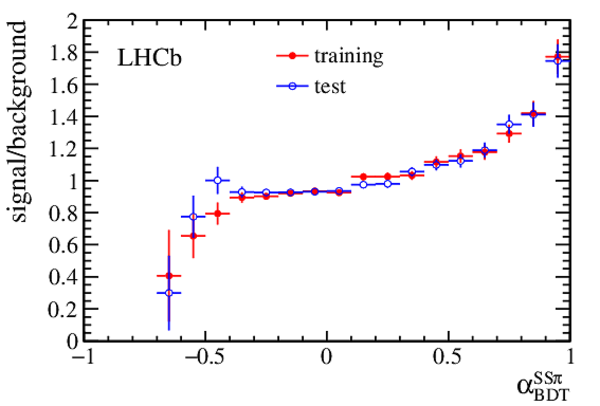
Distribution of the BDT output of signal (correct-tag decision) and background (wrong-tag decision) tagging particles, for (left) $\rm SS$ $\pi $ and (right) $\rm SS$ $ p $ taggers. In case of multiple tagging candidates per $ B ^0$ candidate, only the candidate with the highest BDT output value is shown. |
Fig2a.pdf [19 KiB] HiDef png [963 KiB] Thumbnail [496 KiB] *.C file |
|
|
Fig2b.pdf [19 KiB] HiDef png [883 KiB] Thumbnail [461 KiB] *.C file |

|
|
|
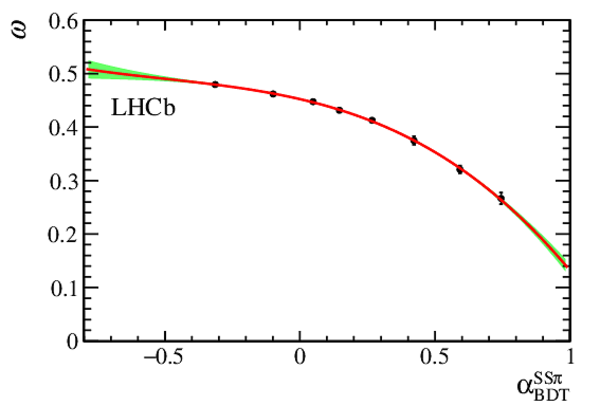
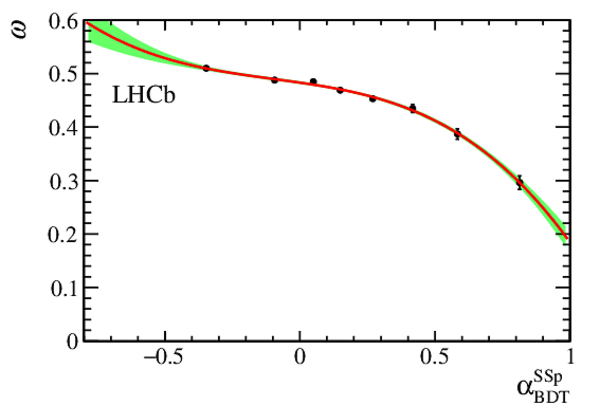
Measured average mistag fraction in bins of (left) $\rm SS$ $\pi $ and (right) $\rm SS$ $ p $ BDT output. The plots are obtained with the test sample of background-subtracted $ B ^0 \rightarrow D^-\pi^+$ candidates. The green-shaded area shows the confidence range within $\pm 1\sigma$. |
Fig3a.pdf [16 KiB] HiDef png [107 KiB] Thumbnail [91 KiB] *.C file |
|
|
Fig3b.pdf [16 KiB] HiDef png [122 KiB] Thumbnail [97 KiB] *.C file |
|
|
|
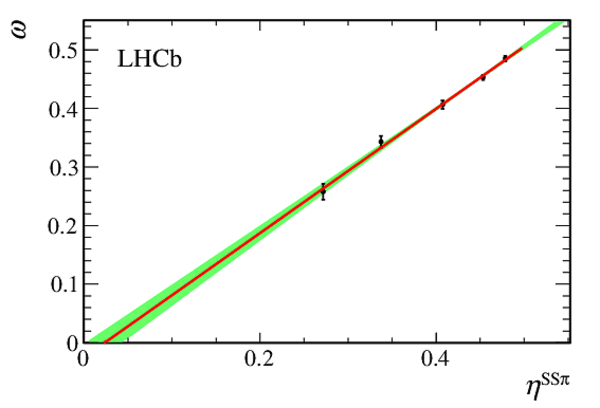
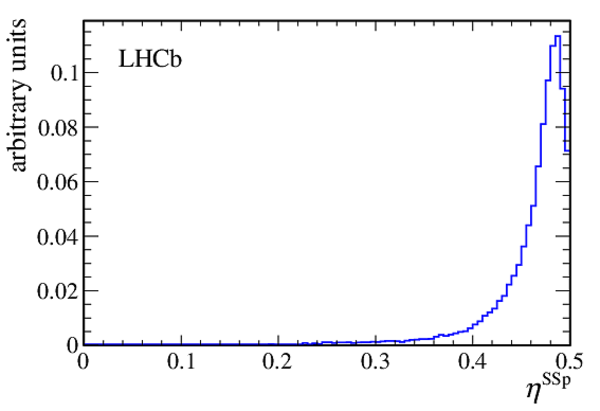
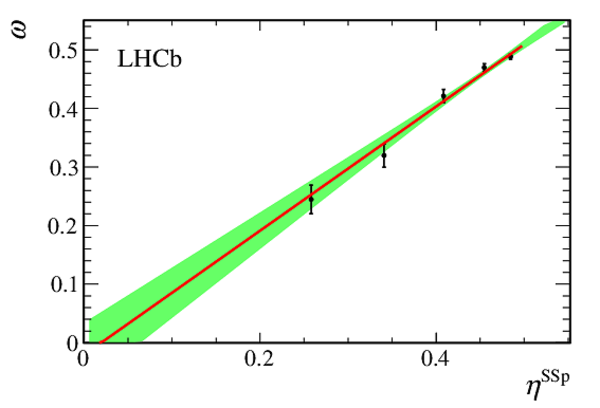
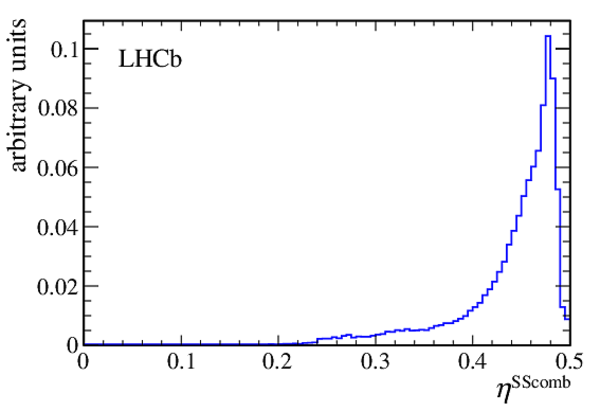
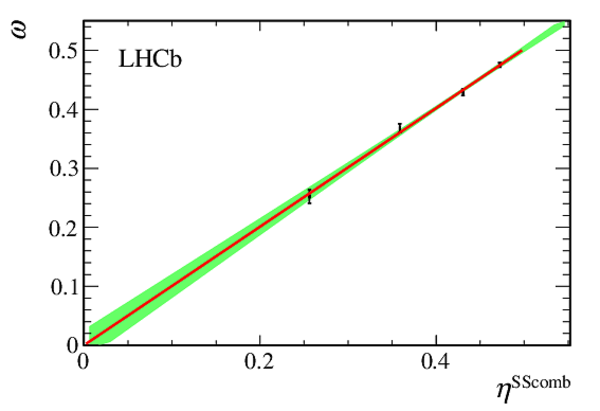
(top left) Distribution of the mistag probability $\eta^\rm SS\pi $ and (top right) measured mistag fraction $\omega$ as a function of $\eta^\rm SS\pi $. (bottom left) Distribution of the mistag probability $\eta^\rm SS p $ and (bottom right) measured mistag fraction $\omega$ as a function of $\eta^\rm SS p $. The green-shaded area shows the 68% confidence range. |
Fig4a.pdf [14 KiB] HiDef png [96 KiB] Thumbnail [95 KiB] *.C file |

|
|
Fig4b.pdf [15 KiB] HiDef png [122 KiB] Thumbnail [92 KiB] *.C file |
|
|
|
Fig4c.pdf [14 KiB] HiDef png [93 KiB] Thumbnail [89 KiB] *.C file |
|
|
|
Fig4d.pdf [15 KiB] HiDef png [131 KiB] Thumbnail [100 KiB] *.C file |
|
|
|
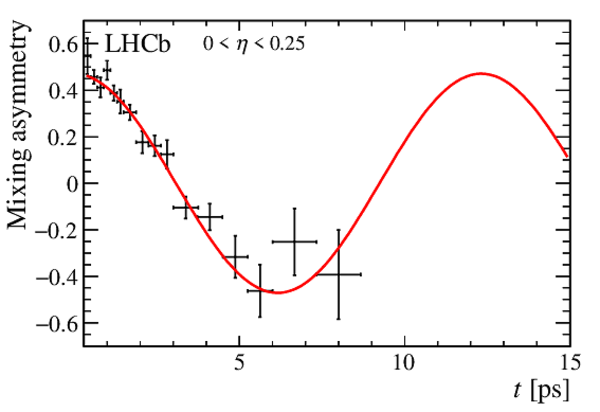
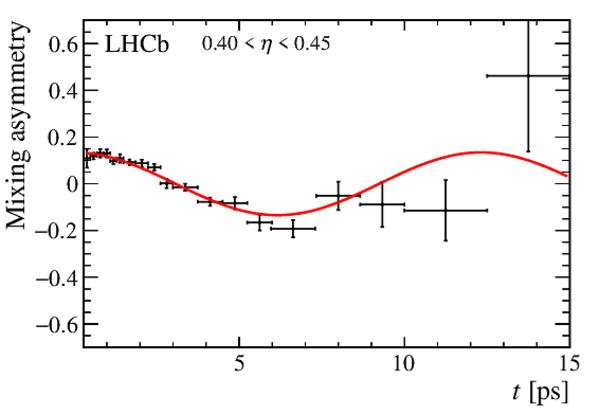
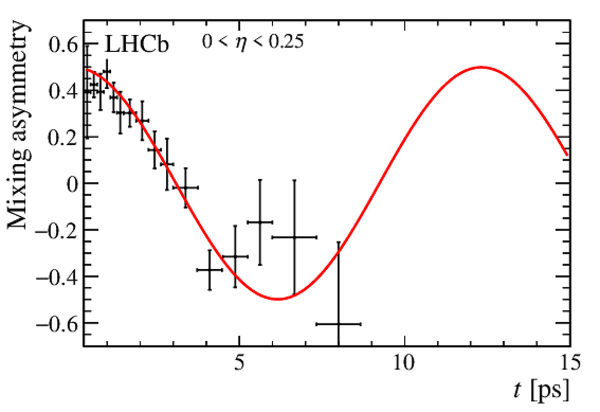
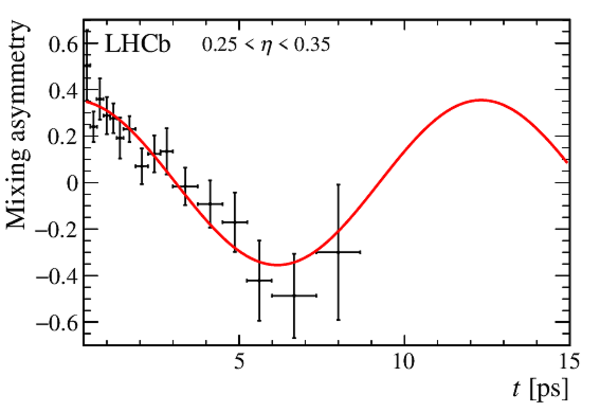
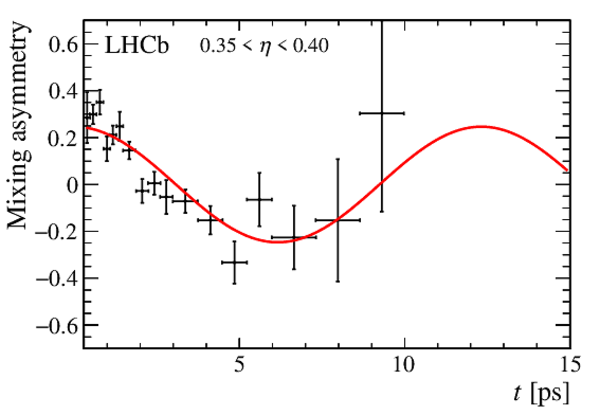
Mixing asymmetry in bins of mistag probability using the $\rm SS$ $\pi $ tagger. |
Fig5a.pdf [6 KiB] HiDef png [130 KiB] Thumbnail [116 KiB] *.C file |
|
|
Fig5b.pdf [6 KiB] HiDef png [128 KiB] Thumbnail [118 KiB] *.C file |

|
|
|
Fig5c.pdf [16 KiB] HiDef png [126 KiB] Thumbnail [115 KiB] *.C file |

|
|
|
Fig5d.pdf [16 KiB] HiDef png [117 KiB] Thumbnail [104 KiB] *.C file |
|
|
|
Fig5e.pdf [15 KiB] HiDef png [111 KiB] Thumbnail [106 KiB] *.C file |

|
|
|
Mixing asymmetry in bins of mistag probability using the $\rm SS$ $ p $ tagger. |
Fig6a.pdf [15 KiB] HiDef png [134 KiB] Thumbnail [121 KiB] *.C file |
|
|
Fig6b.pdf [15 KiB] HiDef png [128 KiB] Thumbnail [115 KiB] *.C file |
|
|
|
Fig6c.pdf [15 KiB] HiDef png [124 KiB] Thumbnail [115 KiB] *.C file |
|
|
|
Fig6d.pdf [15 KiB] HiDef png [117 KiB] Thumbnail [113 KiB] *.C file |

|
|
|
Fig6e.pdf [16 KiB] HiDef png [112 KiB] Thumbnail [106 KiB] *.C file |

|
|
|
Animated gif made out of all figures. |
PAPER-2016-039.gif Thumbnail |

|
![HiDef png [221 KiB]](Directory_LHCb-PAPER-2016-039/hidef_Fig1.png)
![HiDef png [963 KiB]](Directory_LHCb-PAPER-2016-039/hidef_Fig2a.png)
![HiDef png [883 KiB]](Directory_LHCb-PAPER-2016-039/hidef_Fig2b.png)
![HiDef png [107 KiB]](Directory_LHCb-PAPER-2016-039/hidef_Fig3a.png)
![HiDef png [122 KiB]](Directory_LHCb-PAPER-2016-039/hidef_Fig3b.png)
![HiDef png [96 KiB]](Directory_LHCb-PAPER-2016-039/hidef_Fig4a.png)
![HiDef png [122 KiB]](Directory_LHCb-PAPER-2016-039/hidef_Fig4b.png)
![HiDef png [93 KiB]](Directory_LHCb-PAPER-2016-039/hidef_Fig4c.png)
![HiDef png [131 KiB]](Directory_LHCb-PAPER-2016-039/hidef_Fig4d.png)
![HiDef png [130 KiB]](Directory_LHCb-PAPER-2016-039/hidef_Fig5a.png)
![HiDef png [128 KiB]](Directory_LHCb-PAPER-2016-039/hidef_Fig5b.png)
![HiDef png [126 KiB]](Directory_LHCb-PAPER-2016-039/hidef_Fig5c.png)
![HiDef png [117 KiB]](Directory_LHCb-PAPER-2016-039/hidef_Fig5d.png)
![HiDef png [111 KiB]](Directory_LHCb-PAPER-2016-039/hidef_Fig5e.png)
![HiDef png [134 KiB]](Directory_LHCb-PAPER-2016-039/hidef_Fig6a.png)
![HiDef png [128 KiB]](Directory_LHCb-PAPER-2016-039/hidef_Fig6b.png)
![HiDef png [124 KiB]](Directory_LHCb-PAPER-2016-039/hidef_Fig6c.png)
![HiDef png [117 KiB]](Directory_LHCb-PAPER-2016-039/hidef_Fig6d.png)
![HiDef png [112 KiB]](Directory_LHCb-PAPER-2016-039/hidef_Fig6e.png)
Tables and captions
|
Expected correlation between the flavour of a $ B $ meson and the hadronization products. |
Table_1.pdf [34 KiB] HiDef png [33 KiB] Thumbnail [15 KiB] tex code |

|
|
Loose selection requirements for the $\rm SS$ $\pi $ and $\rm SS$ $ p $ algorithms. The variables used as input for the BDT classifiers are indicated by \checkmark. |
Table_2.pdf [72 KiB] HiDef png [116 KiB] Thumbnail [58 KiB] tex code |

|
|
Calibration parameters for the $\rm SS$ $\pi $ , $\rm SS$ $ p $ and $\rm SScomb$ taggers where the first uncertainties are statistical and the second are systematic. |
Table_3.pdf [37 KiB] HiDef png [59 KiB] Thumbnail [26 KiB] tex code |

|
|
Tagging efficiencies and tagging power of the $\rm SS$ $\pi $ , $\rm SS$ $ p $ and $\rm SScomb$ algorithms. The $\rm SScomb$ efficiencies are shown splitting the sample in candidates tagged exclusively by $\rm SS$ $\pi $ or $\rm SS$ $ p $ , or by both. As explained in the text, there is a large overlap between the $\rm SS$ $\pi $ and $\rm SS$ $ p $ taggers. |
Table_4.pdf [39 KiB] HiDef png [67 KiB] Thumbnail [34 KiB] tex code |

|
|
Calibration parameters for the $ B ^0 \rightarrow K ^+ \pi ^- $ decay sample. Uncertainties are statistical only. |
Table_5.pdf [38 KiB] HiDef png [39 KiB] Thumbnail [16 KiB] tex code |

|
|
Systematic uncertainties on the calibration parameters of $\rm SS$ $\pi $ , $\rm SS$ $ p $ and $\rm SScomb$ taggers. The total systematic uncertainty is the squared sum of all contributions. A dash indicates a value negligible with respect to the quoted precision. |
Table_6.pdf [32 KiB] HiDef png [109 KiB] Thumbnail [48 KiB] tex code |

|
|
Systematic uncertainties related to the decay-time model. A dash indicates a value negligible with respect to the quoted precision. |
Table_7.pdf [31 KiB] HiDef png [47 KiB] Thumbnail [22 KiB] tex code |

|
![HiDef png [33 KiB]](Directory_LHCb-PAPER-2016-039/hidef_Table_1.png)
![HiDef png [116 KiB]](Directory_LHCb-PAPER-2016-039/hidef_Table_2.png)
![HiDef png [59 KiB]](Directory_LHCb-PAPER-2016-039/hidef_Table_3.png)
![HiDef png [67 KiB]](Directory_LHCb-PAPER-2016-039/hidef_Table_4.png)
![HiDef png [39 KiB]](Directory_LHCb-PAPER-2016-039/hidef_Table_5.png)
![HiDef png [109 KiB]](Directory_LHCb-PAPER-2016-039/hidef_Table_6.png)
![HiDef png [47 KiB]](Directory_LHCb-PAPER-2016-039/hidef_Table_7.png)
Supplementary Material [file]
| Supplementary material full pdf |
supple[..].pdf [1 MiB] |
|
|
This ZIP file contains supplemetary material for the publication LHCb-PAPER-2016-039. The files are: Supplementary.pdf : An overview of the extra figures *.pdf, *.png, *.eps, *.C : The figures in variuous formats |
Fig7a.pdf [16 KiB] HiDef png [134 KiB] Thumbnail [124 KiB] *C file |
|
|
Fig7b.pdf [15 KiB] HiDef png [123 KiB] Thumbnail [109 KiB] *C file |

|
|
|
Fig8a.pdf [14 KiB] HiDef png [95 KiB] Thumbnail [92 KiB] *C file |
|
|
|
Fig8b.pdf [16 KiB] HiDef png [127 KiB] Thumbnail [96 KiB] *C file |
|
|
|
Fig9a.pdf [23 KiB] HiDef png [132 KiB] Thumbnail [112 KiB] *C file |
|
|
|
Fig9b.pdf [23 KiB] HiDef png [138 KiB] Thumbnail [119 KiB] *C file |
|
|
|
Fig9c.pdf [23 KiB] HiDef png [136 KiB] Thumbnail [113 KiB] *C file |

|
![HiDef png [134 KiB]](Directory_LHCb-PAPER-2016-039/supplementary/hidef_Fig7a.png)
![HiDef png [123 KiB]](Directory_LHCb-PAPER-2016-039/supplementary/hidef_Fig7b.png)
![HiDef png [95 KiB]](Directory_LHCb-PAPER-2016-039/supplementary/hidef_Fig8a.png)
![HiDef png [127 KiB]](Directory_LHCb-PAPER-2016-039/supplementary/hidef_Fig8b.png)
![HiDef png [132 KiB]](Directory_LHCb-PAPER-2016-039/supplementary/hidef_Fig9a.png)
![HiDef png [138 KiB]](Directory_LHCb-PAPER-2016-039/supplementary/hidef_Fig9b.png)
![HiDef png [136 KiB]](Directory_LHCb-PAPER-2016-039/supplementary/hidef_Fig9c.png)
Created on 27 April 2024.