Information
LHCb-PAPER-2016-043
CERN-EP-2016-276
arXiv:1611.07704 [PDF]
(Submitted on 23 Nov 2016)
JHEP 03 (2017) 001
Inspire 1499874
Tools
Abstract
A search for the non-resonant decays $B^0_s \rightarrow \mu^{+}\mu^{-}\mu^{+}\mu^{-}$ and $B^0 \rightarrow \mu^{+}\mu^{-}\mu^{+}\mu^{-}$ is presented. The measurement is performed using the full Run 1 data set collected in proton-proton collisions by the LHCb experiment at the LHC. The data correspond to integrated luminosities of $1$ and $2 \mathrm{fb}^{-1}$ collected at centre-of-mass energies of $7$ and $8 \mathrm{TeV}$, respectively. No signal is observed and upper limits on the branching fractions of the non-resonant decays at $95\%$ confidence level are determined to be \mathcal{B}(B^0_s \rightarrow \mu^{+}\mu^{-}\mu^{+}\mu^{-}) & < 2.5 \times 10^{-9} \mathcal{B}(B^0 \rightarrow \mu^{+}\mu^{-}\mu^{+}\mu^{-}) & < 6.9 \times 10^{-10}.
Figures and captions
|
Feynman diagrams for \subref{subfig:nonResoFMD} the non-resonant $ B ^0_{( s )} \rightarrow \mu ^+\mu ^- \mu ^+\mu ^- $ decay, \subref{subfig:NPFMD} a supersymmetric $ B ^0_{( s )} \rightarrow S (\rightarrow \mu ^+\mu ^- ) P (\rightarrow \mu ^+\mu ^- )$ decay and \subref{subfig:ResoFMD} the resonant $ B ^0_ s \rightarrow { J \mskip -3mu/\mskip -2mu\psi \mskip 2mu} (\rightarrow \mu ^+\mu ^- )\phi (\rightarrow \mu ^+\mu ^- )$ decay (see text). |
B24muN[..].pdf [34 KiB] HiDef png [43 KiB] Thumbnail [26 KiB] *.C file |

|
|
B24muNP.pdf [32 KiB] HiDef png [34 KiB] Thumbnail [21 KiB] *.C file |

|
|
|
B24muR[..].pdf [32 KiB] HiDef png [69 KiB] Thumbnail [50 KiB] *.C file |

|
|
|
Fit to the $ B ^+ \rightarrow { J \mskip -3mu/\mskip -2mu\psi \mskip 2mu} (\rightarrow \mu ^+\mu ^- ) K ^+ $ invariant mass distribution. The signal contribution is modelled by a Hypatia2 [26] function (blue dotted line), the combinatorial background by an exponential function (green dash-dotted line). Partially reconstructed decays, such as $ B ^0 \rightarrow { J \mskip -3mu/\mskip -2mu\psi \mskip 2mu} K ^{*0} $ where one pion is not reconstructed, are modelled by a Gaussian function with an exponential tail towards the lower mass side (red dashed line). Data are shown by black dots. |
jpsik_[..].pdf [37 KiB] HiDef png [201 KiB] Thumbnail [160 KiB] *.C file |

|
|
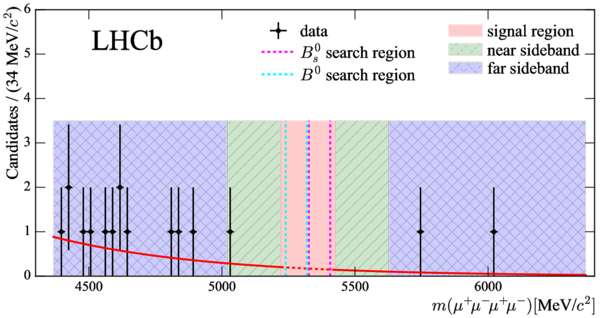
Mass distribution of selected $ B ^0_{( s )} \rightarrow \mu ^+\mu ^- \mu ^+\mu ^- $ events observed in 3 $ fb^{-1}$ of data in all considered $ B $ mass regions. Background (red line) is modelled by an exponential function. Signal subregions for $ B ^0$ and $ B ^0_ s $ searches are also shown. The error bars on the individual points with $n$ entries are $\pm\sqrt{n}$. |
evalua[..].pdf [28 KiB] HiDef png [832 KiB] Thumbnail [436 KiB] *.C file |
|
|
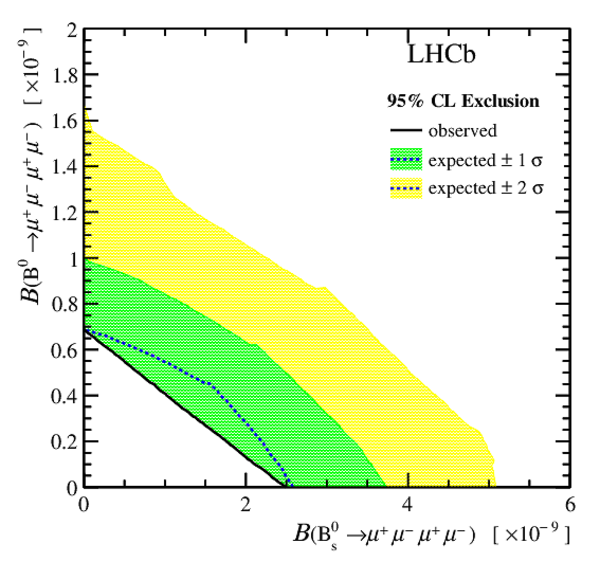
Expected and observed 95% CL exclusion in $\mathcal{B}$ ( $ B ^0 \rightarrow \mu ^+\mu ^- \mu ^+\mu ^- $ ) vs. $\mathcal{B}$ ( $ B ^0_ s \rightarrow \mu ^+\mu ^- \mu ^+\mu ^- $ ) parameters plane. |
bsd24mu.pdf [17 KiB] HiDef png [993 KiB] Thumbnail [365 KiB] *.C file |
|
|
Expected and observed 95% CL exclusion in $\mathcal{B}$ ( $ B ^0 \rightarrow S (\rightarrow \mu ^+\mu ^- ) P (\rightarrow \mu ^+\mu ^- )$ ) vs. $\mathcal{B}$ ( $ B ^0_ s \rightarrow S (\rightarrow \mu ^+\mu ^- ) P (\rightarrow \mu ^+\mu ^- )$ ) parameters plane with scalar and pseudoscalar S and P as described in Sec. 3. |
bsd24muNP.pdf [17 KiB] HiDef png [878 KiB] Thumbnail [374 KiB] *.C file |

|
|
Animated gif made out of all figures. |
PAPER-2016-043.gif Thumbnail |

|
Tables and captions
|
Definitions of intervals in the $ B ^0$ and $ B ^0_ s $ reconstructed invariant mass distributions. |
Table_1.pdf [45 KiB] HiDef png [101 KiB] Thumbnail [44 KiB] tex code |

|
|
Summary of systematic uncertainties affecting the single event sensitivities along with the total systematic uncertainty calculated by adding up the individual components in quadrature. The dominating uncertainty arising from $f_ u / f_ s $ only contributes to $\eta_s$. The uncertainty of the stated selection efficiencies arising from the limited number of simulated events is 0.5% for $ B ^0 \rightarrow \mu ^+\mu ^- \mu ^+\mu ^- $ and 0.4% for all other considered decay modes. |
Table_2.pdf [59 KiB] HiDef png [177 KiB] Thumbnail [84 KiB] tex code |

|
Supplementary Material [file]


![HiDef png [43 KiB]](Directory_LHCb-PAPER-2016-043/hidef_B24muNonReso.png)
![HiDef png [34 KiB]](Directory_LHCb-PAPER-2016-043/hidef_B24muNP.png)
![HiDef png [69 KiB]](Directory_LHCb-PAPER-2016-043/hidef_B24muReso_noGammaZ.png)
![HiDef png [201 KiB]](Directory_LHCb-PAPER-2016-043/hidef_jpsik_5050_massfit.png)
![HiDef png [832 KiB]](Directory_LHCb-PAPER-2016-043/hidef_evaluation_fit_for_paper.png)
![HiDef png [993 KiB]](Directory_LHCb-PAPER-2016-043/hidef_bsd24mu.png)
![HiDef png [878 KiB]](Directory_LHCb-PAPER-2016-043/hidef_bsd24muNP.png)
![HiDef png [101 KiB]](Directory_LHCb-PAPER-2016-043/hidef_Table_1.png)
![HiDef png [177 KiB]](Directory_LHCb-PAPER-2016-043/hidef_Table_2.png)
![HiDef png [278 KiB]](Directory_LHCb-PAPER-2016-043/supplementary/hidef_Fig1a-S.png)
![HiDef png [248 KiB]](Directory_LHCb-PAPER-2016-043/supplementary/hidef_Fig1b-S.png)
![HiDef png [253 KiB]](Directory_LHCb-PAPER-2016-043/supplementary/hidef_Fig1c-S.png)
![HiDef png [255 KiB]](Directory_LHCb-PAPER-2016-043/supplementary/hidef_Fig1d-S.png)
![HiDef png [257 KiB]](Directory_LHCb-PAPER-2016-043/supplementary/hidef_Fig1e-S.png)
![HiDef png [232 KiB]](Directory_LHCb-PAPER-2016-043/supplementary/hidef_Fig1f-S.png)
![HiDef png [240 KiB]](Directory_LHCb-PAPER-2016-043/supplementary/hidef_Fig1g-S.png)
![HiDef png [379 KiB]](Directory_LHCb-PAPER-2016-043/supplementary/hidef_Fig2-S.png)
![HiDef png [194 KiB]](Directory_LHCb-PAPER-2016-043/supplementary/hidef_Fig3a-S.png)
![HiDef png [191 KiB]](Directory_LHCb-PAPER-2016-043/supplementary/hidef_Fig3b-S.png)
![HiDef png [192 KiB]](Directory_LHCb-PAPER-2016-043/supplementary/hidef_Fig3c-S.png)
![HiDef png [193 KiB]](Directory_LHCb-PAPER-2016-043/supplementary/hidef_Fig3d-S.png)
![HiDef png [110 KiB]](Directory_LHCb-PAPER-2016-043/supplementary/hidef_Fig4a-S.png)
![HiDef png [110 KiB]](Directory_LHCb-PAPER-2016-043/supplementary/hidef_Fig4b-S.png)
![HiDef png [110 KiB]](Directory_LHCb-PAPER-2016-043/supplementary/hidef_Fig4c-S.png)
![HiDef png [110 KiB]](Directory_LHCb-PAPER-2016-043/supplementary/hidef_Fig4d-S.png)
Created on 27 April 2024.