Search for $CP$ violation in the phase space of $D^0\rightarrow\pi^+\pi^-\pi^+\pi^-$ decays
[to restricted-access page]Information
LHCb-PAPER-2016-044
CERN-EP-2016-287
arXiv:1612.03207 [PDF]
(Submitted on 09 Dec 2016)
Phys. Lett. B769 (2017) 345
Inspire 1502914
Tools
Abstract
A search for time-integrated $CP$ violation in the Cabibbo-suppressed decay $ D^0\rightarrow\pi^+\pi^-\pi^+\pi^-$ is performed using an unbinned, model-independent technique known as the energy test. This is the first application of the energy test in four-body decays. The search is performed for $P$-even $CP$ asymmetries and, for the first time, is extended to probe the $P$-odd case. Using proton-proton collision data corresponding to an integrated luminosity of 3.0 fb$^{-1}$ collected by the LHCb detector at centre-of-mass energies of $\sqrt{s}=$7 TeV and 8 TeV, the world's best sensitivity to $CP$ violation in this decay is obtained. The data are found to be consistent with the hypothesis of $CP$ symmetry with a $p$-value of $(4.6\pm0.5)\%$ in the $P$-even case, and marginally consistent with a $p$-value of $(0.6\pm0.2)\%$ in the $P$-odd case, corresponding to a significance for $CP$ non-conservation of 2.7 standard deviations.
Figures and captions
|
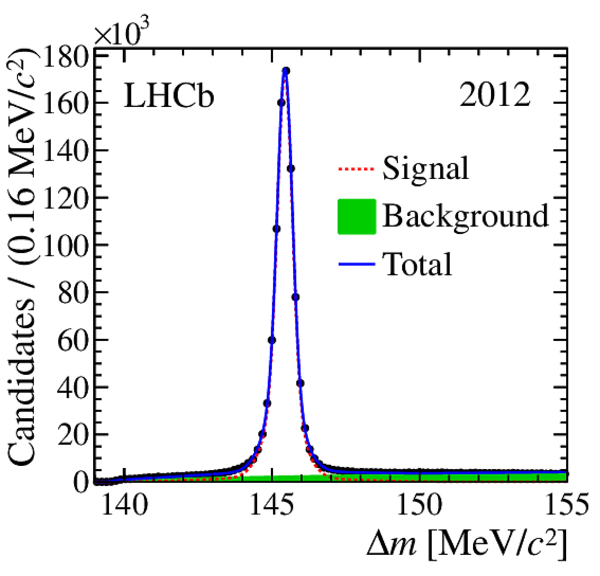
Distribution of $\Delta m$ with fit overlaid for the selected $ D ^{*+}$ candidates in the 2012 data. The data points and the contributions from signal, background, and their total obtained from the fit are shown. |
Fig1.pdf [26 KiB] HiDef png [263 KiB] Thumbnail [228 KiB] *.C file |
|
|
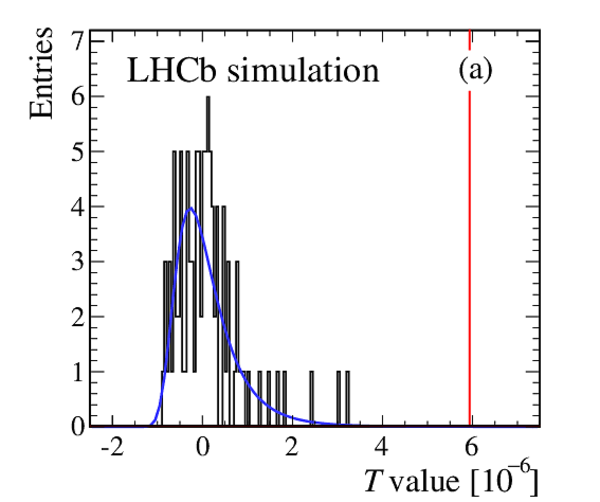
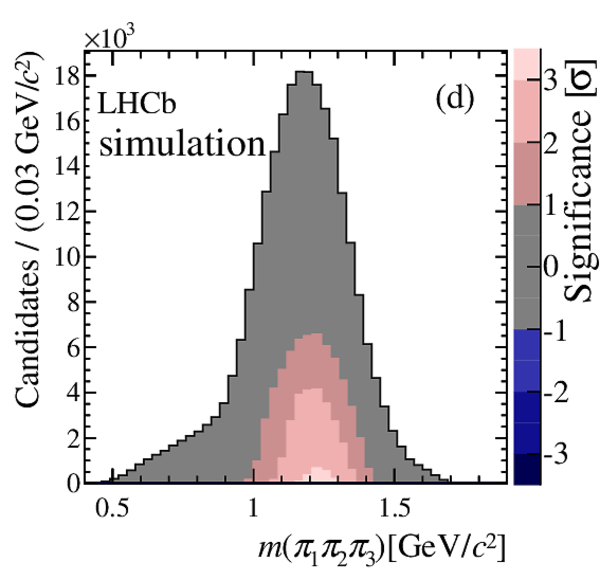
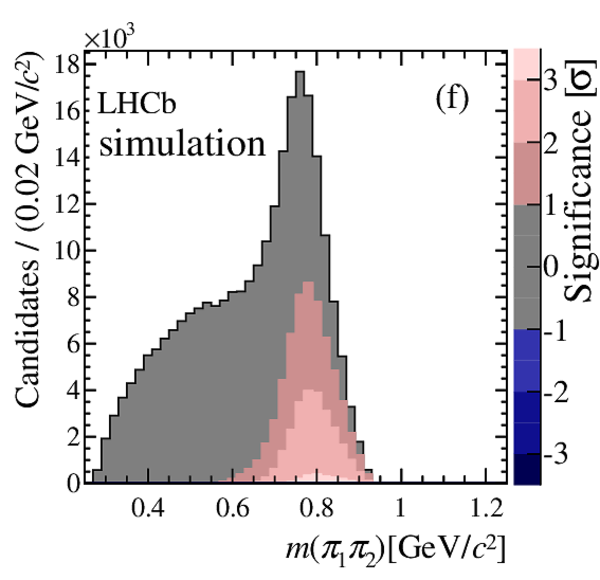
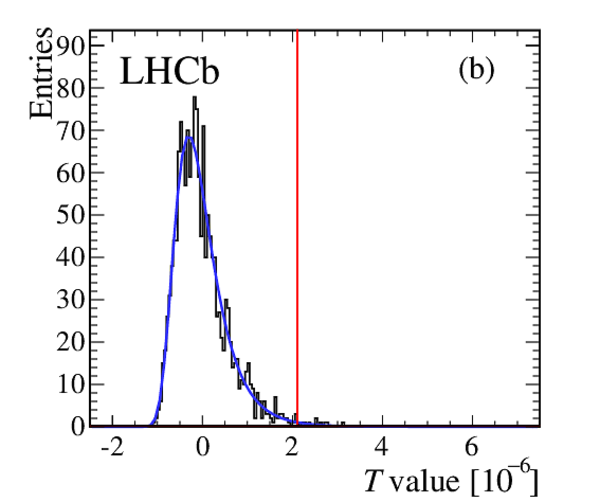
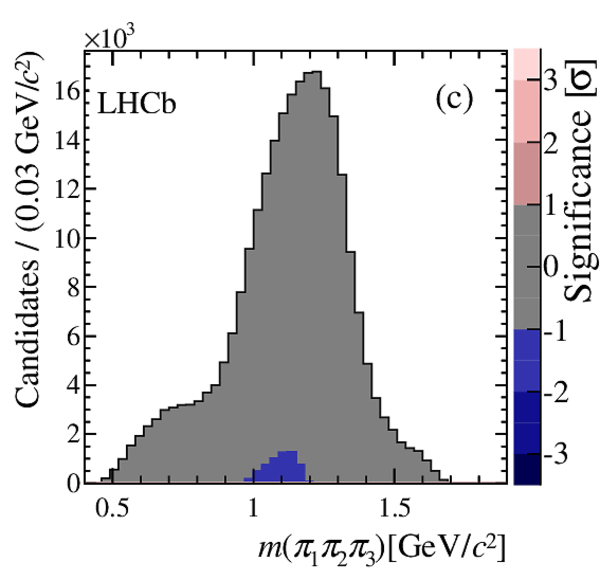
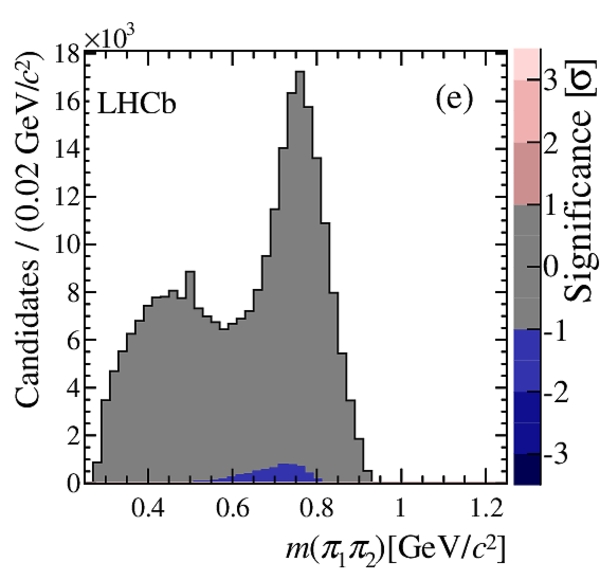
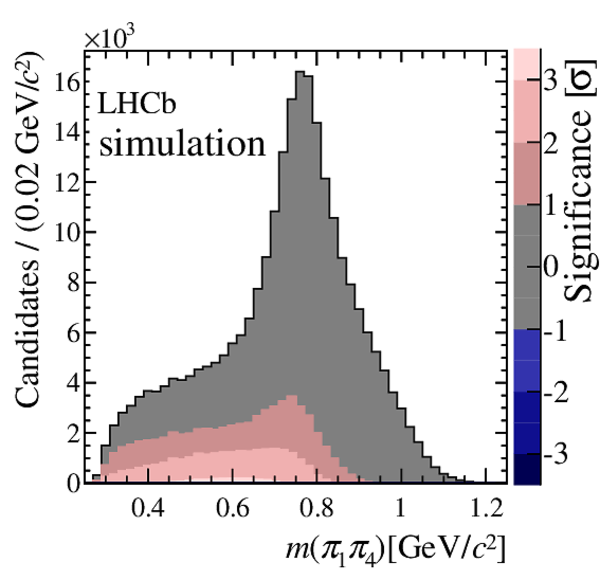
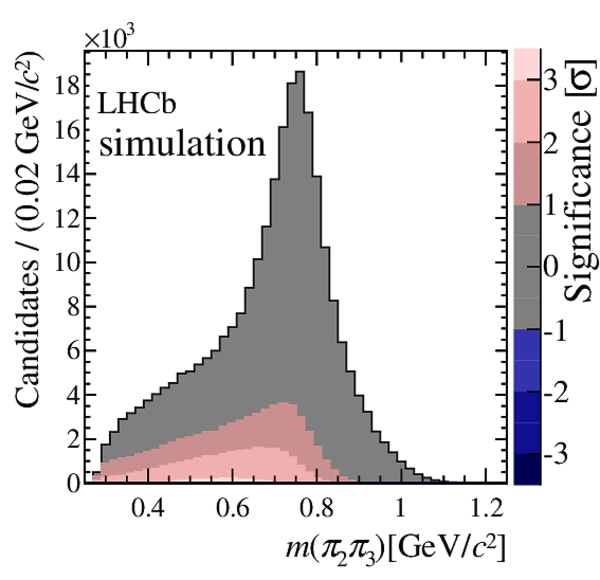
(a,b) Distribution of permutation $T$-values fitted with a GEV function for the simulated sample and showing the measured $T$-value as a vertical line, and (c,d,e,f) local asymmetry significances. Left column plots are for a $P$-even $ C P$ -violation test with a $3^\circ$ phase $ C P$ violation introduced in the $a_1(1260)^+$ resonance (see text), projected onto the (c) $m(\pi_1 \pi_2 \pi_3)$ and (e) $m(\pi_1\pi_2)$ axes. Right column plots are for a $P$-odd $ C P$ -violation test with $3^\circ$ phase $ C P$ violation introduced in the P-wave $\rho ^0 (770) \rho ^0 (770)$ resonance projected onto the same axes. In plots (c,d,e,f) the grey area corresponds to candidates with a contribution to the $T$-value of less than one standard deviation. The pink (blue) area corresponds to candidates with a positive (negative) contribution to the $T$-value. Light, medium or dark shades of pink and blue correspond to between one and two, two and three, and more than three standard-deviation contributions, respectively. |
Fig2a.pdf [28 KiB] HiDef png [155 KiB] Thumbnail [121 KiB] *.C file |
|
|
Fig2b.pdf [28 KiB] HiDef png [152 KiB] Thumbnail [123 KiB] *.C file |

|
|
|
Fig2c.pdf [17 KiB] HiDef png [203 KiB] Thumbnail [203 KiB] *.C file |

|
|
|
Fig2d.pdf [16 KiB] HiDef png [190 KiB] Thumbnail [193 KiB] *.C file |
|
|
|
Fig2e.pdf [17 KiB] HiDef png [215 KiB] Thumbnail [215 KiB] *.C file |

|
|
|
Fig2f.pdf [16 KiB] HiDef png [195 KiB] Thumbnail [199 KiB] *.C file |
|
|
|
(a,b) Distribution of permutation $T$-values fitted with a GEV function and showing the $T$-value of the data tests as a vertical line, and (c,d,e,f) local asymmetry significances. Left column plots are for the $P$-even $ C P$ -violation test, projected onto the (c) $m(\pi_1 \pi_2 \pi_3)$ and (e) $m(\pi_1\pi_2)$ axes. Right column plots are for the $P$-odd $ C P$ -violation test projected onto the same axes. In plots (c,d,e,f) the grey area correspond to candidates with a contribution to the $T$-value of less than one standard deviation. In the $P$-even $ C P$ violation test the positive (negative) asymmetry significance is set for the $ D ^0$ candidates having positive (negative) contribution to the measured $T$ value. In the $P$-odd $ C P$ violation test the positive (negative) asymmetry significance is set for sample $I+IV$ having positive (negative) contribution to the measured $T$ value (see Sect. 5). The pink (blue) area corresponds to candidates with a positive (negative) contribution to the $T$-value. Light, medium or dark shades of pink and blue correspond to between one and two, two and three, and more than three standard deviation contributions, respectively. |
Fig3a.pdf [29 KiB] HiDef png [171 KiB] Thumbnail [135 KiB] *.C file |

|
|
Fig3b.pdf [29 KiB] HiDef png [170 KiB] Thumbnail [135 KiB] *.C file |
|
|
|
Fig3c.pdf [16 KiB] HiDef png [169 KiB] Thumbnail [172 KiB] *.C file |
|
|
|
Fig3d.pdf [16 KiB] HiDef png [173 KiB] Thumbnail [175 KiB] *.C file |

|
|
|
Fig3e.pdf [16 KiB] HiDef png [179 KiB] Thumbnail [179 KiB] *.C file |
|
|
|
Fig3f.pdf [16 KiB] HiDef png [182 KiB] Thumbnail [182 KiB] *.C file |

|
|
|
Animated gif made out of all figures. |
PAPER-2016-044.gif Thumbnail |

|
Tables and captions
|
The yields of signal events in the four samples that obtained from fits to the $\Delta m$ distribution. |
Table_1.pdf [21 KiB] HiDef png [20 KiB] Thumbnail [10 KiB] tex code |

|
|
Overview of sensitivities to various $ C P$ -violation scenarios in simulation. $\Delta A$ and $\Delta \phi$ denote, respectively, the relative change in magnitude and the change in phase of the amplitude of the resonance $R$. The P-wave $\rho ^0 (770)\rho ^0 (770)$ is a $P$-odd component. The phase change in this resonance is tested with the $P$-odd $ C P$ -violation test. Results for all other scenarios are given with the standard $P$-even test. |
Table_2.pdf [54 KiB] HiDef png [112 KiB] Thumbnail [52 KiB] tex code |

|
|
Results for the $P$-even and $P$-odd $ C P$ -violation tests for three different values of the effective radius $\delta$. The $p$-values obtained with both the counting and GEV fitting methods are given (see text). The counting method is the default method. |
Table_3.pdf [38 KiB] HiDef png [49 KiB] Thumbnail [22 KiB] tex code |

|
Supplementary Material [file]


![HiDef png [263 KiB]](Directory_LHCb-PAPER-2016-044/hidef_Fig1.png)
![HiDef png [155 KiB]](Directory_LHCb-PAPER-2016-044/hidef_Fig2a.png)
![HiDef png [152 KiB]](Directory_LHCb-PAPER-2016-044/hidef_Fig2b.png)
![HiDef png [203 KiB]](Directory_LHCb-PAPER-2016-044/hidef_Fig2c.png)
![HiDef png [190 KiB]](Directory_LHCb-PAPER-2016-044/hidef_Fig2d.png)
![HiDef png [215 KiB]](Directory_LHCb-PAPER-2016-044/hidef_Fig2e.png)
![HiDef png [195 KiB]](Directory_LHCb-PAPER-2016-044/hidef_Fig2f.png)
![HiDef png [171 KiB]](Directory_LHCb-PAPER-2016-044/hidef_Fig3a.png)
![HiDef png [170 KiB]](Directory_LHCb-PAPER-2016-044/hidef_Fig3b.png)
![HiDef png [169 KiB]](Directory_LHCb-PAPER-2016-044/hidef_Fig3c.png)
![HiDef png [173 KiB]](Directory_LHCb-PAPER-2016-044/hidef_Fig3d.png)
![HiDef png [179 KiB]](Directory_LHCb-PAPER-2016-044/hidef_Fig3e.png)
![HiDef png [182 KiB]](Directory_LHCb-PAPER-2016-044/hidef_Fig3f.png)
![HiDef png [20 KiB]](Directory_LHCb-PAPER-2016-044/hidef_Table_1.png)
![HiDef png [112 KiB]](Directory_LHCb-PAPER-2016-044/hidef_Table_2.png)
![HiDef png [49 KiB]](Directory_LHCb-PAPER-2016-044/hidef_Table_3.png)
![HiDef png [33 KiB]](Directory_LHCb-PAPER-2016-044/supplementary/hidef_Fig1a.png)
![HiDef png [42 KiB]](Directory_LHCb-PAPER-2016-044/supplementary/hidef_Fig1b-S.png)
![HiDef png [76 KiB]](Directory_LHCb-PAPER-2016-044/supplementary/hidef_Fig2-S.png)
![HiDef png [73 KiB]](Directory_LHCb-PAPER-2016-044/supplementary/hidef_Fig3-S.png)
![HiDef png [185 KiB]](Directory_LHCb-PAPER-2016-044/supplementary/hidef_Fig4a-S.png)
![HiDef png [196 KiB]](Directory_LHCb-PAPER-2016-044/supplementary/hidef_Fig4b-S.png)
![HiDef png [199 KiB]](Directory_LHCb-PAPER-2016-044/supplementary/hidef_Fig4c-S.png)
![HiDef png [340 KiB]](Directory_LHCb-PAPER-2016-044/supplementary/hidef_Fig4d-S.png)
![HiDef png [169 KiB]](Directory_LHCb-PAPER-2016-044/supplementary/hidef_Fig5a-S.png)
![HiDef png [177 KiB]](Directory_LHCb-PAPER-2016-044/supplementary/hidef_Fig5b-S.png)
![HiDef png [174 KiB]](Directory_LHCb-PAPER-2016-044/supplementary/hidef_Fig5c-S.png)
![HiDef png [292 KiB]](Directory_LHCb-PAPER-2016-044/supplementary/hidef_Fig5d-S.png)
Created on 27 April 2024.