Search for the $C P$-violating strong decays $\eta \to \pi^+\pi^-$ and $\eta^\prime(958) \to \pi^+\pi^-$
[to restricted-access page]Information
LHCb-PAPER-2016-046
CERN-EP-2016-257
arXiv:1610.03666 [PDF]
(Submitted on 12 Oct 2016)
Phys. Lett. B764 (2016) 233
Inspire 1491381
Tools
Abstract
A search for the $C P$-violating strong decays $\eta \to \pi^+\pi^-$ and $\eta^\prime(958) \to \pi^+\pi^-$ has been performed using approximately $2.5 \times 10^{7}$ events of each of the decays $D^+ \to \pi^+\pi^+\pi^-$ and $D_s^+ \to \pi^+\pi^+\pi^-$, recorded by the LHCb experiment. The data set corresponds to an integrated luminosity of 3.0 fb$^{-1}$ of $pp$ collision data recorded during LHC Run 1 and 0.3 fb$^{-1}$ recorded in Run 2. No evidence is seen for $D^+_{(s)} \to \pi^+ \eta^{(\prime)}$ with $\eta^{(\prime)} \to \pi^+\pi^-$, and upper limits at 90 confidence level are set on the branching fractions, $\mathcal{B}(\eta \to \pi^+\pi^-) < 1.6 \times 10^{-5}$ and $\mathcal{B}(\eta^\prime \to \pi^+\pi^-) < 1.8 \times 10^{-5}$. The limit for the $\eta$ decay is comparable with the existing one, while that for the $\eta^\prime$ is a factor of three smaller than the previous limit.
Figures and captions
|
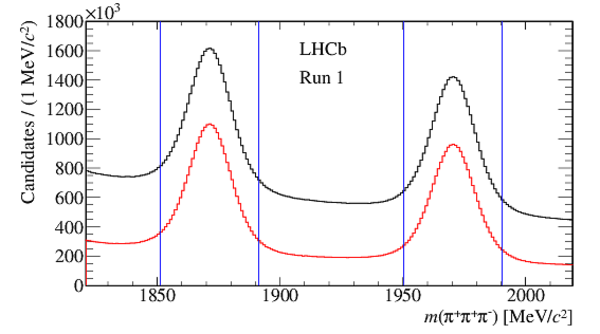
Mass spectra of selected $ D_{(s)}^+\rightarrow \pi^+\pi^+\pi^-$ candidates, after the BDT selections, for (top) Run 1 and (bottom) Run 2 data, with the results from the fits superimposed. The dot-dashed lines show the total fitted backgrounds, and the vertical lines indicate the optimised $D^+_{(s)}$ signal regions. The discontinuity in the Run 2 spectrum comes from the fact that the trigger has two separate output streams and there are different BDT selections for $ D ^+$ and $ D ^+_ s $ . |
Fig1a.pdf [36 KiB] HiDef png [168 KiB] Thumbnail [128 KiB] *.C file |

|
|
Fig1b.pdf [36 KiB] HiDef png [179 KiB] Thumbnail [143 KiB] *.C file |

|
|
|
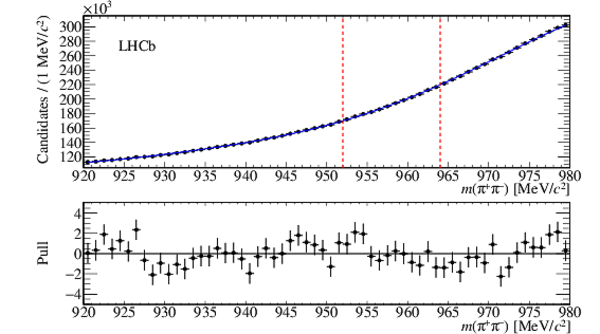
The $\pi^+\pi^-$ invariant mass distribution in the $\eta$ mass fitting region from the sum of the four samples, showing also the sum of the fitted curves and the pulls. The vertical dashed lines indicate the $\eta$ signal region. |
Fig2.pdf [35 KiB] HiDef png [250 KiB] Thumbnail [249 KiB] *.C file |

|
|
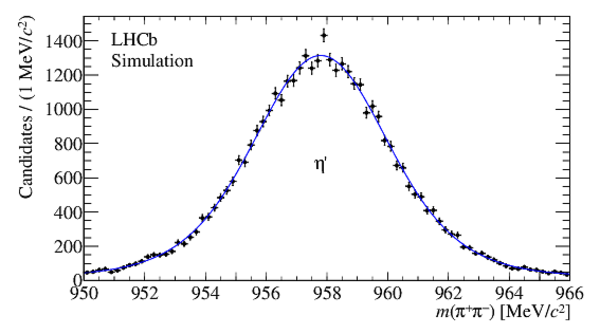
The $\pi^+\pi^-$ invariant mass distribution in the $\eta^\prime$ mass fitting region from the sum of the four samples, showing also the sum of the fitted curves and the pulls. The vertical dashed lines indicate the $\eta^\prime$ signal region. |
Fig3.pdf [25 KiB] HiDef png [224 KiB] Thumbnail [216 KiB] *.C file |
|
|
Values of $\textrm{CL}_{\textrm{s}}$ as a function of $ {\cal B}\left(\eta\rightarrow \pi^+\pi^- \right)$ . The expected variation is shown by the dashed line, with the $\pm 1\sigma$ and $\pm 2\sigma$ regions shaded. The observed variation is shown by the solid line, while the horizontal line indicates the $90\%$ confidence level. |
Fig4.pdf [246 KiB] HiDef png [211 KiB] Thumbnail [144 KiB] *.C file |

|
|
Values of $\textrm{CL}_{\textrm{s}}$ as a function of $ {\cal B}\left(\eta^\prime\rightarrow \pi^+\pi^- \right)$ . The expected variation is shown by the dashed line, with the $\pm 1\sigma$ and $\pm 2\sigma$ regions shaded. The observed variation is shown by the solid line, which almost overlays the dashed line, while the horizontal line indicates the $90\%$ confidence level. |
Fig5.pdf [239 KiB] HiDef png [196 KiB] Thumbnail [136 KiB] *.C file |

|
|
Animated gif made out of all figures. |
PAPER-2016-046.gif Thumbnail |

|
![HiDef png [168 KiB]](Directory_LHCb-PAPER-2016-046/hidef_Fig1a.png)
![HiDef png [179 KiB]](Directory_LHCb-PAPER-2016-046/hidef_Fig1b.png)
![HiDef png [250 KiB]](Directory_LHCb-PAPER-2016-046/hidef_Fig2.png)
![HiDef png [224 KiB]](Directory_LHCb-PAPER-2016-046/hidef_Fig3.png)
![HiDef png [211 KiB]](Directory_LHCb-PAPER-2016-046/hidef_Fig4.png)
![HiDef png [196 KiB]](Directory_LHCb-PAPER-2016-046/hidef_Fig5.png)
Supplementary Material [file]
| Supplementary material full pdf |
supple[..].pdf [137 KiB] |

|
|
This ZIP file contains supplemetary material for the publication LHCb-PAPER-2016-046. The files are: Supplementary.pdf : An overview of the extra figures *.pdf, *.png, *.eps : The figures in variuous formats |
Fig6.pdf [17 KiB] HiDef png [159 KiB] Thumbnail [136 KiB] *C file |
|
|
Fig7.pdf [17 KiB] HiDef png [152 KiB] Thumbnail [126 KiB] *C file |

|
|
|
Fig8.pdf [20 KiB] HiDef png [159 KiB] Thumbnail [134 KiB] *C file |
|
|
|
Fig9.pdf [22 KiB] HiDef png [164 KiB] Thumbnail [138 KiB] *C file |
|
![HiDef png [159 KiB]](Directory_LHCb-PAPER-2016-046/supplementary/hidef_Fig6.png)
![HiDef png [152 KiB]](Directory_LHCb-PAPER-2016-046/supplementary/hidef_Fig7.png)
![HiDef png [159 KiB]](Directory_LHCb-PAPER-2016-046/supplementary/hidef_Fig8.png)
![HiDef png [164 KiB]](Directory_LHCb-PAPER-2016-046/supplementary/hidef_Fig9.png)
Created on 27 April 2024.