Search for massive long-lived particles decaying semileptonically in the LHCb detector
[to restricted-access page]Information
LHCb-PAPER-2016-047
CERN-EP-2016-283
arXiv:1612.00945 [PDF]
(Submitted on 03 Dec 2016)
Eur. Phys. J. C77 (2017) 224
Inspire 1501678
Tools
Abstract
A search is presented for massive long-lived particles decaying into a muon and two quarks. The dataset consists of proton-proton interactions at centre-of-mass energies of 7 and 8 TeV, corresponding to integrated luminosities of 1 and 2 1/fb, respectively. The analysis is performed assuming a set of production mechanisms with simple topologies, including the production of a Higgs-like particle decaying into two long-lived particles. The mass range from 20 to 80 GeV and lifetimes from 5 to 100 ps are explored. Results are also interpreted in terms of neutralino production in different supersymmetric models, with masses in the 23-198 GeV range. No excess above the background expectation is observed and upper limits are set on the production cross-section for various points in the parameter space of theoretical models.
Figures and captions
|
Four topologies considered as representative LLP production mechanisms: $ P A$ non-resonant direct double LLP production, $ P B$ single LLP production, $ P C$ double LLP production from the decay of a Higgs-like boson, $ P D$ double LLP indirect production via squarks. |
pa.pdf [22 KiB] HiDef png [53 KiB] Thumbnail [25 KiB] *.C file |

|
|
pb.pdf [33 KiB] HiDef png [57 KiB] Thumbnail [25 KiB] *.C file |

|
|
|
pc.pdf [37 KiB] HiDef png [71 KiB] Thumbnail [32 KiB] *.C file |

|
|
|
pd.pdf [31 KiB] HiDef png [71 KiB] Thumbnail [33 KiB] *.C file |

|
|
|
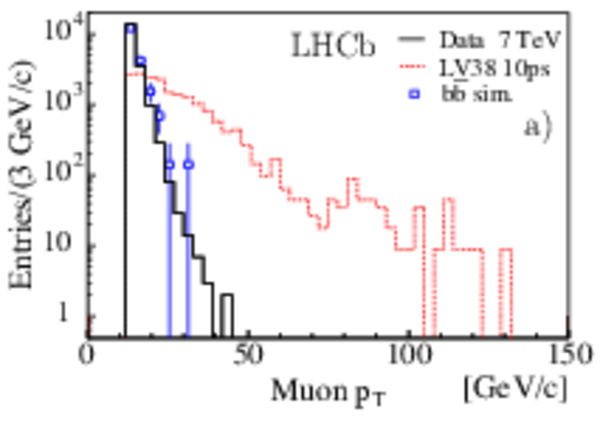
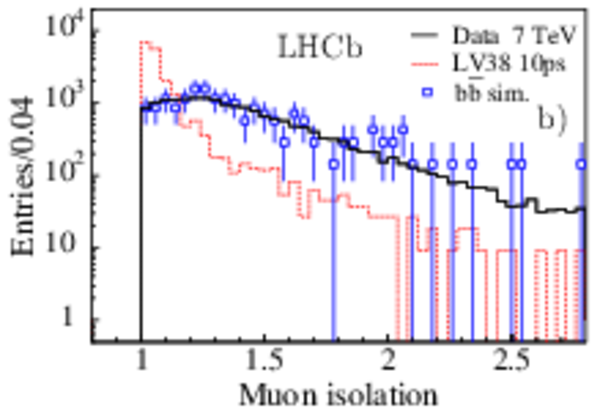
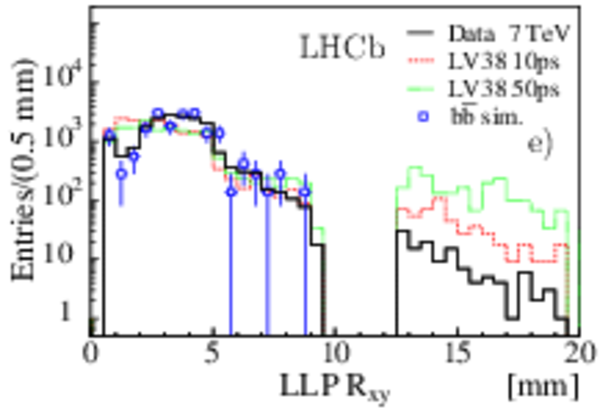
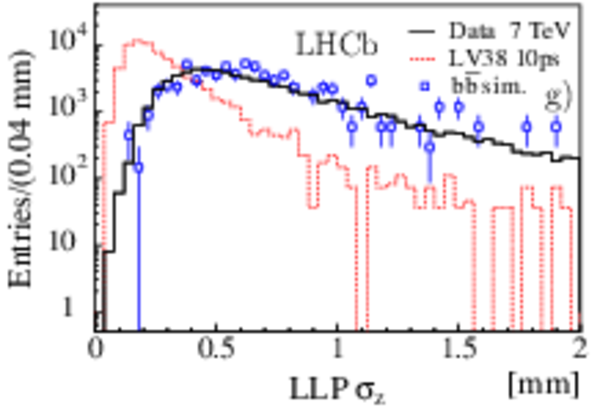
Distributions for the 7 TeV dataset (black histogram) compared to simulated $ b \overline b $ events (blue squares with error bars), showing a) transverse momentum and b) isolation of the muon, c) number of tracks of the displaced vertex, d) reconstructed mass, e) radial position of the vertex, f) and g) vertex fit uncertainties in the radial and z directions. The fully simulated signal distributions for LV38 10 $ {\mathrm{ ps}}$ are shown (red dashed histograms), as well as LV38 50 $ {\mathrm{ ps}}$ (green dotted histogram) in e). The distributions from simulation are normalised to the number of data entries. |
fig-2a.pdf [116 KiB] HiDef png [210 KiB] Thumbnail [151 KiB] *.C file |
|
|
fig-2b.pdf [195 KiB] HiDef png [269 KiB] Thumbnail [210 KiB] *.C file |
|
|
|
fig-2c.pdf [195 KiB] HiDef png [195 KiB] Thumbnail [133 KiB] *.C file |

|
|
|
fig-2d.pdf [195 KiB] HiDef png [208 KiB] Thumbnail [154 KiB] *.C file |

|
|
|
fig-2e.pdf [124 KiB] HiDef png [273 KiB] Thumbnail [188 KiB] *.C file |
|
|
|
fig-2f.pdf [108 KiB] HiDef png [208 KiB] Thumbnail [166 KiB] *.C file |

|
|
|
fig-2g.pdf [108 KiB] HiDef png [261 KiB] Thumbnail [196 KiB] *.C file |
|
|
|
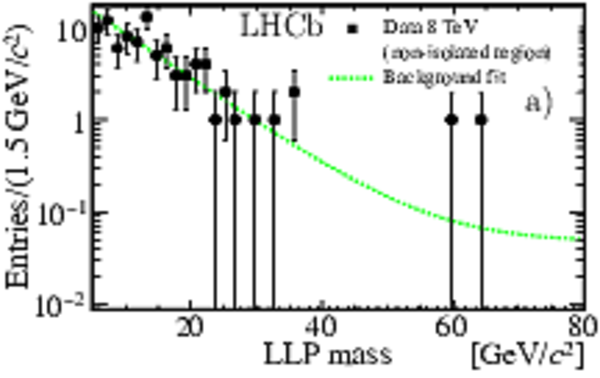
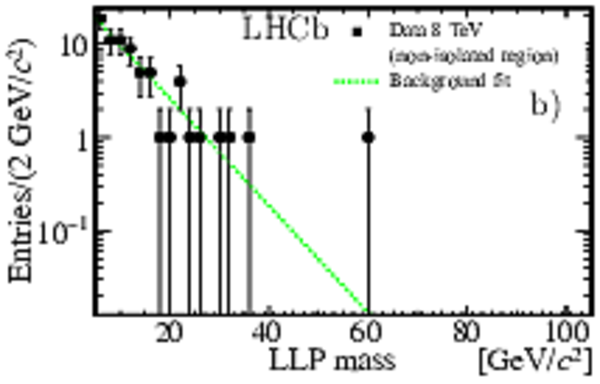
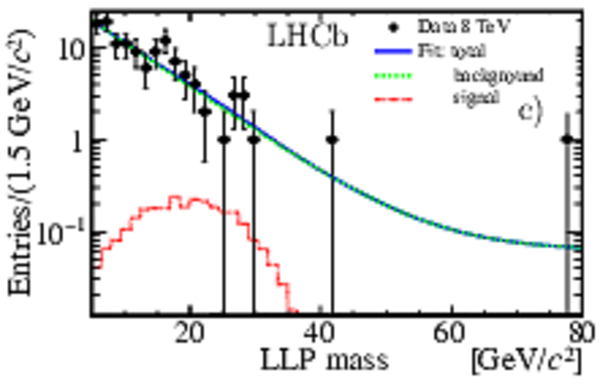
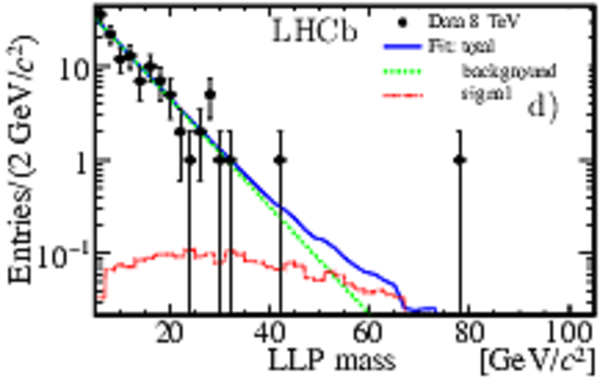
Reconstructed mass of the LLP candidate from the 8 TeV dataset. The top plots correspond to events with candidates selected from the background region of the muon isolation variable. They are fitted with the sum of two exponential functions. In the bottom row the candidates from the signal region are fitted including a specific signal shape, added to the background component. Subfigures a) and c) correspond to the analysis which assumes the LV38 5 $ {\mathrm{ ps}}$ signal model, b) and d) are for LV98 10 $ {\mathrm{ ps}}$ . |
fig-3a.pdf [156 KiB] HiDef png [219 KiB] Thumbnail [284 KiB] *.C file |
|
|
fig-3b.pdf [156 KiB] HiDef png [209 KiB] Thumbnail [278 KiB] *.C file |
|
|
|
fig-3c.pdf [156 KiB] HiDef png [262 KiB] Thumbnail [287 KiB] *.C file |
|
|
|
fig-3d.pdf [156 KiB] HiDef png [271 KiB] Thumbnail [297 KiB] *.C file |
|
|
|
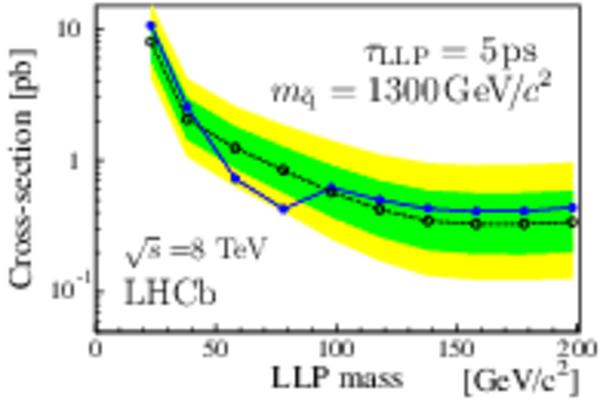
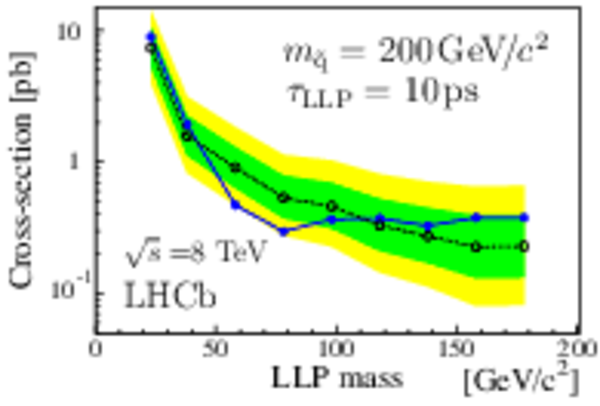
Expected (open dots with 1$\sigma$ and 2$\sigma$ bands) and observed (full dots) cross-section times branching fraction upper limits at 95% confidence level, as a function of the LLP mass from the 8 TeV dataset. The theoretical models assume the full set of SUSY production processes available in Pythia 6 with default parameter settings, unless otherwise specified. The gluino mass is 2000 $ {\mathrm{ Ge V /}c^2}$ . |
fig-4a.pdf [187 KiB] HiDef png [275 KiB] Thumbnail [195 KiB] *.C file |
|
|
fig-4b.pdf [187 KiB] HiDef png [275 KiB] Thumbnail [198 KiB] *.C file |

|
|
|
fig-4c.pdf [187 KiB] HiDef png [264 KiB] Thumbnail [188 KiB] *.C file |
|
|
|
fig-4d.pdf [187 KiB] HiDef png [277 KiB] Thumbnail [200 KiB] *.C file |

|
|
|
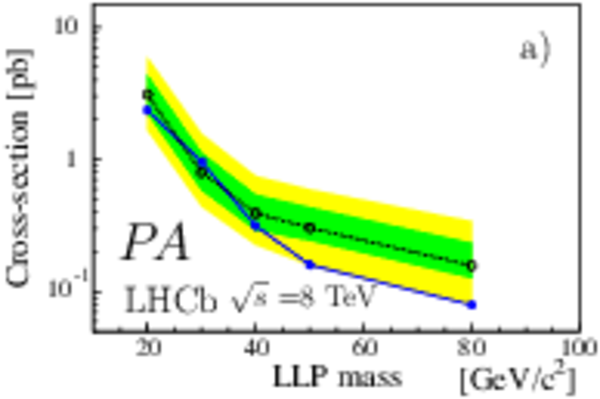
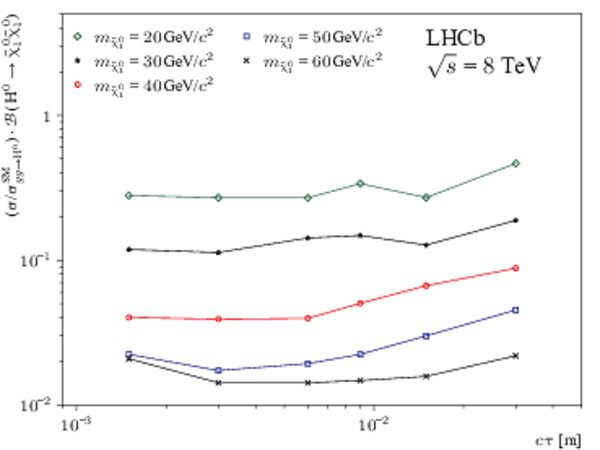
Expected (open dots and 1$\sigma$ and 2$\sigma$ bands) and observed (full dots) cross-section times branching fraction upper limits (95% CL) for the processes indicated in the bottom left corner of each plot, $\tau_{\rm{LLP}}$ is always 10 $ {\mathrm{ ps}}$ . The results correspond to the 8 TeV dataset. a) upper limits as a function of the LLP mass for process $ P A$ ; b) as a function of the LLP mass for process $ P B$ , with $ m_{\rm ``\tilde{g}"} =100$ $ {\mathrm{ Ge V /}c^2}$ ; c) as a function of $ m_{\rm h^0}$ for process $ P C$ for $ m_{\rm{LLP}}$ of 20, 40, and 60 $ {\mathrm{ Ge V /}c^2}$ , from top to bottom (the single point at 130 $ {\mathrm{ Ge V /}c^2}$ with $ m_{\rm{LLP}} =60 {\mathrm{ Ge V /}c^2} $ has been shifted to the right for visualisation); d) upper limits as a function of the LLP mass for process $ P D$ with $ m_{\tilde{\rm q}} =60$ $ {\mathrm{ Ge V /}c^2}$ . |
fig-5a.pdf [363 KiB] HiDef png [221 KiB] Thumbnail [167 KiB] *.C file |
|
|
fig-5b.pdf [349 KiB] HiDef png [220 KiB] Thumbnail [166 KiB] *.C file |

|
|
|
fig-5c.pdf [430 KiB] HiDef png [285 KiB] Thumbnail [199 KiB] *.C file |

|
|
|
fig-5d.pdf [349 KiB] HiDef png [210 KiB] Thumbnail [161 KiB] *.C file |

|
|
|
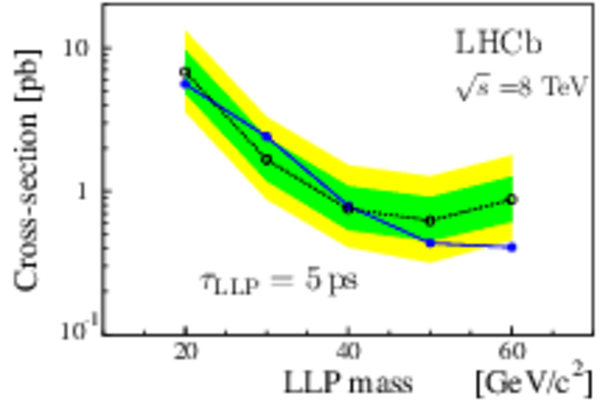
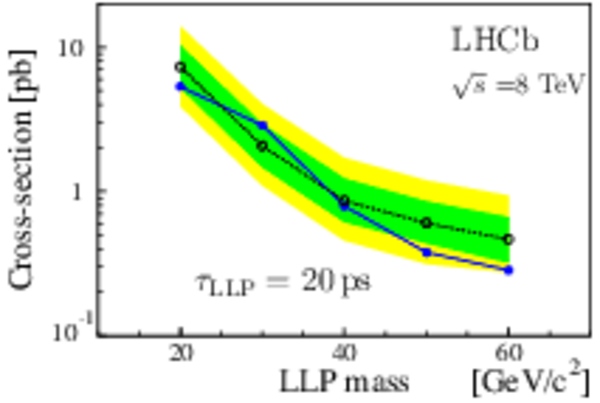
Expected (open dots with 1$\sigma$ and 2$\sigma$ bands) and observed (full dots) cross-section times branching fraction upper limits (95% CL) for the processes $ P C$ as a function of the LLP mass; the LLP lifetime $\tau_{\rm{LLP}}$ is indicated in each plot, $ m_{\rm h^0} =125 {\mathrm{ Ge V /}c^2} .$ The results correspond to the 8 TeV dataset. |
fig-6a.pdf [325 KiB] HiDef png [191 KiB] Thumbnail [147 KiB] *.C file |
|
|
fig-6b.pdf [325 KiB] HiDef png [198 KiB] Thumbnail [148 KiB] *.C file |

|
|
|
fig-6c.pdf [325 KiB] HiDef png [199 KiB] Thumbnail [153 KiB] *.C file |
|
|
|
fig-6d.pdf [325 KiB] HiDef png [205 KiB] Thumbnail [154 KiB] *.C file |

|
|
|
fig-6e.pdf [325 KiB] HiDef png [201 KiB] Thumbnail [153 KiB] *.C file |

|
|
|
fig-6f.pdf [325 KiB] HiDef png [199 KiB] Thumbnail [154 KiB] *.C file |

|
|
|
Animated gif made out of all figures. |
PAPER-2016-047.gif Thumbnail |

|
![HiDef png [53 KiB]](Directory_LHCb-PAPER-2016-047/hidef_pa.png)
![HiDef png [57 KiB]](Directory_LHCb-PAPER-2016-047/hidef_pb.png)
![HiDef png [71 KiB]](Directory_LHCb-PAPER-2016-047/hidef_pc.png)
![HiDef png [71 KiB]](Directory_LHCb-PAPER-2016-047/hidef_pd.png)
![HiDef png [210 KiB]](Directory_LHCb-PAPER-2016-047/hidef_fig-2a.png)
![HiDef png [269 KiB]](Directory_LHCb-PAPER-2016-047/hidef_fig-2b.png)
![HiDef png [195 KiB]](Directory_LHCb-PAPER-2016-047/hidef_fig-2c.png)
![HiDef png [208 KiB]](Directory_LHCb-PAPER-2016-047/hidef_fig-2d.png)
![HiDef png [273 KiB]](Directory_LHCb-PAPER-2016-047/hidef_fig-2e.png)
![HiDef png [208 KiB]](Directory_LHCb-PAPER-2016-047/hidef_fig-2f.png)
![HiDef png [261 KiB]](Directory_LHCb-PAPER-2016-047/hidef_fig-2g.png)
![HiDef png [219 KiB]](Directory_LHCb-PAPER-2016-047/hidef_fig-3a.png)
![HiDef png [209 KiB]](Directory_LHCb-PAPER-2016-047/hidef_fig-3b.png)
![HiDef png [262 KiB]](Directory_LHCb-PAPER-2016-047/hidef_fig-3c.png)
![HiDef png [271 KiB]](Directory_LHCb-PAPER-2016-047/hidef_fig-3d.png)
![HiDef png [275 KiB]](Directory_LHCb-PAPER-2016-047/hidef_fig-4a.png)
![HiDef png [275 KiB]](Directory_LHCb-PAPER-2016-047/hidef_fig-4b.png)
![HiDef png [264 KiB]](Directory_LHCb-PAPER-2016-047/hidef_fig-4c.png)
![HiDef png [277 KiB]](Directory_LHCb-PAPER-2016-047/hidef_fig-4d.png)
![HiDef png [221 KiB]](Directory_LHCb-PAPER-2016-047/hidef_fig-5a.png)
![HiDef png [220 KiB]](Directory_LHCb-PAPER-2016-047/hidef_fig-5b.png)
![HiDef png [285 KiB]](Directory_LHCb-PAPER-2016-047/hidef_fig-5c.png)
![HiDef png [210 KiB]](Directory_LHCb-PAPER-2016-047/hidef_fig-5d.png)
![HiDef png [191 KiB]](Directory_LHCb-PAPER-2016-047/hidef_fig-6a.png)
![HiDef png [198 KiB]](Directory_LHCb-PAPER-2016-047/hidef_fig-6b.png)
![HiDef png [199 KiB]](Directory_LHCb-PAPER-2016-047/hidef_fig-6c.png)
![HiDef png [205 KiB]](Directory_LHCb-PAPER-2016-047/hidef_fig-6d.png)
![HiDef png [201 KiB]](Directory_LHCb-PAPER-2016-047/hidef_fig-6e.png)
![HiDef png [199 KiB]](Directory_LHCb-PAPER-2016-047/hidef_fig-6f.png)
Tables and captions
|
Total signal detection efficiency $\epsilon$, including the geometrical acceptance, and numbers of fitted signal and background events, $N_{\rm s}$ and $N_{\rm b}$, for the different signal hypotheses. The last column gives the value of $\chi^2/\mathrm{ndf}$ from the fit. The signal models are from the full simulation. Uncertainties are explained in Sect. 6. |
Table_1.pdf [37 KiB] HiDef png [169 KiB] Thumbnail [82 KiB] tex code |

|
|
Summary of the contributions to the relative systematic uncertainties, corresponding to the 8 TeV dataset, (the sub-total for the 7 TeV dataset is also given). The indicated ranges cover the fully simulated LV models. The detection efficiency is affected by the parton luminosity model and depends upon the production process, with a maximum uncertainty of 7% for the gluon-gluon fusion process $ P C$ . For the fast simulation based analysis there is an additional contribution of 5%. The systematic effects associated with the signal and background models used in the LLP mass fit are not shown in the table. |
Table_2.pdf [41 KiB] HiDef png [150 KiB] Thumbnail [66 KiB] tex code |

|
|
Upper limits (95% CL) on the production cross-section times branching fraction (pb) for the $\rm 7 TeV$ and $\rm 8 TeV$ datasets, based on the fully simulated LV signal samples. |
Table_3.pdf [38 KiB] HiDef png [124 KiB] Thumbnail [57 KiB] tex code |

|
|
Parameters for the generation of the nine fully simulated signal models. The LLP is the lightest neutralino, $\tilde{\chi}^{0}_{1} $ with $ m_{\tilde{\chi}^{0}_{1} } = m_{\rm{LLP}} $; $M_1$ and $M_2$ are the Pythia parameters RMSS(1) and RMSS(2), $m_{\tilde{\rm g}}$ is RMSS(3), $\mu$ is RMSS(4), $\tan{\beta}$ RMSS(5) and $m_{\tilde{\rm q}}$ is RMSS(8-12). Samples with lifetime of 5, 10 and 50 $ {\mathrm{ ps}}$ have been produced for each mass. |
Table_4.pdf [45 KiB] HiDef png [38 KiB] Thumbnail [15 KiB] tex code |

|
![HiDef png [169 KiB]](Directory_LHCb-PAPER-2016-047/hidef_Table_1.png)
![HiDef png [150 KiB]](Directory_LHCb-PAPER-2016-047/hidef_Table_2.png)
![HiDef png [124 KiB]](Directory_LHCb-PAPER-2016-047/hidef_Table_3.png)
![HiDef png [38 KiB]](Directory_LHCb-PAPER-2016-047/hidef_Table_4.png)
Supplementary Material [file]
| Supplementary material full pdf |
supple[..].pdf [3 MiB] |

|
|
supplementary.pdf : tables of cross-section times branching fraction upper limits. Complementary plots for the H(125)->LLP LLP decay. tables-LV-7TeV.dat, tables-LV-8TeV.dat : idem, flat format, for LV processes tables-PX-7TeV.dat, tables-PX-8TeV.dat : idem, processes PA, PB, PC and PD PAPER-2016-047_sup1 Limit as a function of the LLP lifetime and mass PAPER-2016-047_sup2 Excluded regions in the LLP lifetime-mass plane |
PAPER-[..].pdf [21 KiB] HiDef png [283 KiB] Thumbnail [173 KiB] *C file |
|
|
PAPER-[..].pdf [240 KiB] HiDef png [117 KiB] Thumbnail [101 KiB] *C file |

|
![HiDef png [283 KiB]](Directory_LHCb-PAPER-2016-047/supplementary/hidef_PAPER-2016-047_sup1.png)
![HiDef png [117 KiB]](Directory_LHCb-PAPER-2016-047/supplementary/hidef_PAPER-2016-047_sup2.png)
Created on 27 April 2024.