Information
LHCb-PAPER-2016-053
CERN-EP-2016-318
arXiv:1701.05274 [PDF]
(Submitted on 19 Jan 2017)
Phys. Lett. B772 (2017) 265
Inspire 1509918
Tools
Abstract
The observation of the decay $\varXi^{-}_{b}\to J/\psi\varLambda K^{-}$ is reported, using a data sample corresponding to an integrated luminosity of $3 \mathrm{fb}^{-1}$, collected by the LHCb detector in $pp$ collisions at centre-of-mass energies of $7$ and $8 \mathrm{TeV}$. The production rate of $\varXi_{b}^{-}$ baryons detected in the decay $\varXi_{b}^{-}\to J/\psi\varLambda K^{-}$ is measured relative to that of $\varLambda_{b}^{0}$ baryons using the decay $\varLambda_{b}^{0}\to J/\psi \varLambda$. Integrated over the $b$-baryon transverse momentum $p_{\rm T}<25 \mathrm{GeV/}c $ and rapidity $2.0<y<4.5$, the measured ratio is \begin{equation*} \frac{f_{\varXi_{b}^{-}}}{f_{\varLambda_{b}^{0}}}\frac{\mathcal{B}(\varXi_{b}^{-}\to J/\psi\varLambda K^{-})}{\mathcal{B}(\varLambda_{b}^{0}\to J/\psi \varLambda)}=(4.19\pm 0.29 (\mathrm{stat})\pm0.15 (\mathrm{syst}))\times 10^{-2}, \end{equation*}where $f_{\varXi_{b}^{-}}$ and $f_{\varLambda_{b}^{0}}$ are the fragmentation fractions of $b\to\varXi_{b}^{-}$ and $b\to\varLambda_{b}^{0}$ transitions, and $\mathcal{B}$ represents the branching fraction of the corresponding $b$-baryon decay. The mass difference between $\varXi_{b}^{-}$ and $\varLambda_{b}^{0}$ baryons is measured to be \begin{equation*} M(\varXi_{b}^{-})-M(\varLambda_{b}^{0})=177.08\pm0.47 (\mathrm{stat})\pm0.16 (\mathrm{syst} ) \mathrm{MeV/}c^{2}. \end{equation*}
Figures and captions
|
Feynman diagrams $\Xi ^-_ b $ and $\Lambda ^0_ b $ decays. Diagram (a) contributes to both $\Lambda ^0_ b \rightarrow { J \mskip -3mu/\mskip -2mu\psi \mskip 2mu} p K ^- $ decays and $\Xi ^-_ b \rightarrow { J \mskip -3mu/\mskip -2mu\psi \mskip 2mu} \Lambda K ^- $ decays, diagram (b) contributes only to the $\Xi ^-_ b $ decay. |
Fig1.pdf [44 KiB] HiDef png [27 KiB] Thumbnail [13 KiB] *.C file |

|
|
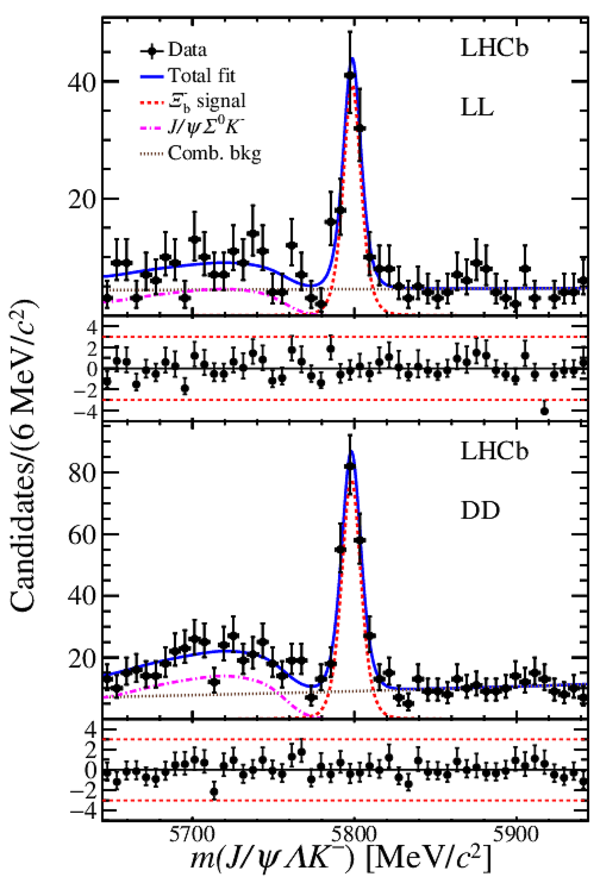
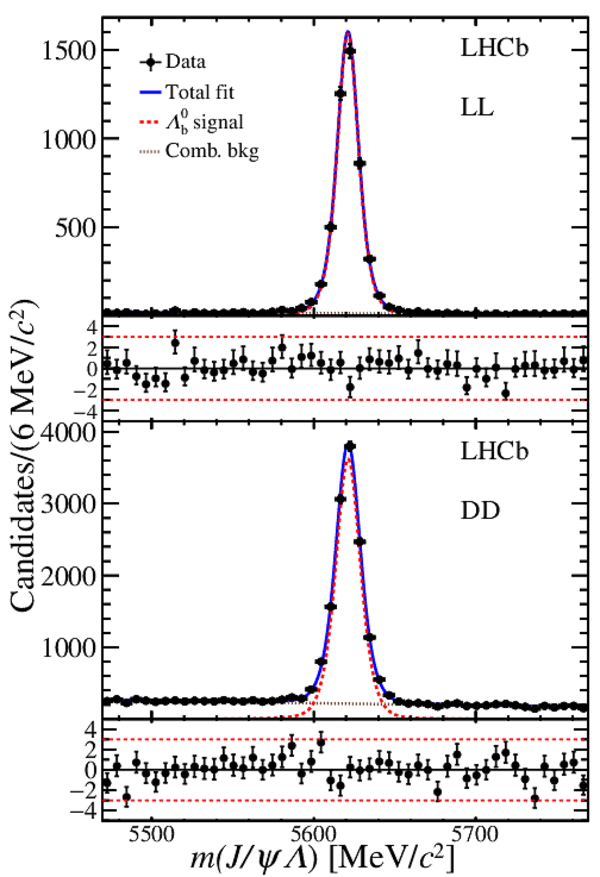
Reconstructed (left) $\Xi ^-_ b \rightarrow { J \mskip -3mu/\mskip -2mu\psi \mskip 2mu} \Lambda K ^- $ and (right) $\Lambda ^0_ b \rightarrow { J \mskip -3mu/\mskip -2mu\psi \mskip 2mu} \Lambda $ candidates using (top) LL and (bottom) DD $\Lambda $ types. The solid (blue) lines show the full fit functions, the dashed (red) lines the signal components, the dot-dashed (purple) lines the $\Xi ^-_ b \rightarrow { J \mskip -3mu/\mskip -2mu\psi \mskip 2mu} \Sigma^{0} K ^- $ background and the dotted (black) lines the combinatorial background. At the bottom of each figure the differences between the data and the fit divided by the uncertainty in the data are shown. |
Fig2a.pdf [38 KiB] HiDef png [540 KiB] Thumbnail [507 KiB] *.C file |
|
|
Fig2b.pdf [37 KiB] HiDef png [410 KiB] Thumbnail [411 KiB] *.C file |
|
|
|
Animated gif made out of all figures. |
PAPER-2016-053.gif Thumbnail |

|
![HiDef png [27 KiB]](Directory_LHCb-PAPER-2016-053/hidef_Fig1.png)
![HiDef png [540 KiB]](Directory_LHCb-PAPER-2016-053/hidef_Fig2a.png)
![HiDef png [410 KiB]](Directory_LHCb-PAPER-2016-053/hidef_Fig2b.png)
Tables and captions
|
Relative systematic uncertainty for the ratio $R_{\Xi ^-_ b /\Lambda ^0_ b }$. |
Table_1.pdf [47 KiB] HiDef png [126 KiB] Thumbnail [55 KiB] tex code |

|
![HiDef png [126 KiB]](Directory_LHCb-PAPER-2016-053/hidef_Table_1.png)
Created on 26 April 2024.