Measurement of the $B^{\pm}$ production asymmetry and the $CP$ asymmetry in $B^{\pm} \to J/\psi K^{\pm}$ decays
[to restricted-access page]Information
LHCb-PAPER-2016-054
CERN-EP-2016-325
arXiv:1701.05501 [PDF]
(Submitted on 19 Jan 2017)
Phys. Rev. D95 (2017) 052005
Inspire 1509922
Tools
Abstract
The $B^{\pm}$ meson production asymmetry in $pp$ collisions is measured using $B^+ \to \bar{D}^0 \pi^+$ decays. The data were recorded by the LHCb experiment during Run 1 of the LHC at centre-of-mass energies of $\sqrt{s}=$ 7 and 8 TeV. The production asymmetries, integrated over transverse momenta in the range $2 < p_{\rm T} < 30$ GeV/$c$, and rapidities in the range $2.1 < y < 4.5$, are measured to be \begin{align*} \mathcal{A}_{\rm prod}(B^+,\sqrt{s}=7 {\rm TeV}) &= (-0.41 \pm 0.49 \pm 0.10) \times 10^{-2},\\ \mathcal{A}_{\rm prod}(B^+,\sqrt{s}=8 {\rm TeV}) &= (-0.53 \pm 0.31 \pm 0.10) \times 10^{-2}, \end{align*} where the first uncertainties are statistical and the second are systematic. These production asymmetries are used to correct the raw asymmetries of $B^{+} \to J/\psi K^{+}$ decays, thus allowing a measurement of the $CP$ asymmetry, \begin{equation*} \mathcal{A}_{CP} = (0.09 \pm 0.27 \pm 0.07) \times 10^{-2}. \end{equation*}
Figures and captions
|
Tree and loop (penguin) diagrams for the $ B ^+ \rightarrow { J \mskip -3mu/\mskip -2mu\psi \mskip 2mu} K ^+ $ decay. |
Fig1a.pdf [19 KiB] HiDef png [30 KiB] Thumbnail [15 KiB] *.C file |

|
|
Fig1b.pdf [41 KiB] HiDef png [48 KiB] Thumbnail [23 KiB] *.C file |

|
|
|
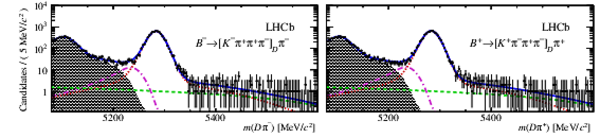
Mass distributions of selected (top) $ B ^\pm \rightarrow [ K ^\pm \pi ^\mp ]_{D}\pi^{\pm}$ and (bottom) $ B ^\pm \rightarrow [ K ^\pm \pi ^\pm \pi ^\mp \pi ^\mp ]_{D}\pi^{\pm}$ candidates in the bin with $4.5 < p_{\mathrm{ T}} < 9.5$ $ {\mathrm{ Ge V /}c}$ and $2.10 < y < 2.85$. These distributions sum over the two centre-of-mass energies. $B^{-}$ candidates are displayed on the left, and $B^{+}$ candidates on the right. The red dotted lines indicate the contribution from $ B ^\pm \rightarrow D\pi^{\pm}$ decays. The purple dash-dotted lines indicate the contribution from misidentified $ B ^\pm \rightarrow DK^{\pm}$ decays. The grey shaded regions at low values of reconstructed mass indicate the contribution from various partially reconstructed $B$ decays, and the green dashed lines indicate the combinatorial background. The total fit function is shown by the blue solid lines. The fit in other kinematic bins is similar, aside from the specific signal and background component yields. |
Fig2a.pdf [43 KiB] HiDef png [348 KiB] Thumbnail [188 KiB] *.C file |

|
|
Fig2b.pdf [43 KiB] HiDef png [321 KiB] Thumbnail [178 KiB] *.C file |
|
|
|
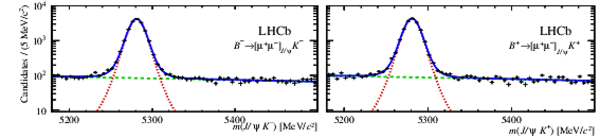
Mass distribution of selected $B^{\pm} \rightarrow { J \mskip -3mu/\mskip -2mu\psi \mskip 2mu} K^{\pm}$ candidates in the bin with $4.5 < p_{\mathrm{ T}} < 9.5$ $ {\mathrm{ Ge V /}c}$ and $2.10 < y < 2.85$. These distributions sum over the two centre-of-mass energies. $B^{-}$ candidates are displayed on the left, and $B^{+}$ candidates on the right. The signal components are displayed as red dotted lines while the background from combinatorial events is shown by the green dashed lines. The fit in other kinematic bins is similar, aside from the specific signal and background component yields. |
Fig3.pdf [25 KiB] HiDef png [135 KiB] Thumbnail [97 KiB] *.C file |
|
|
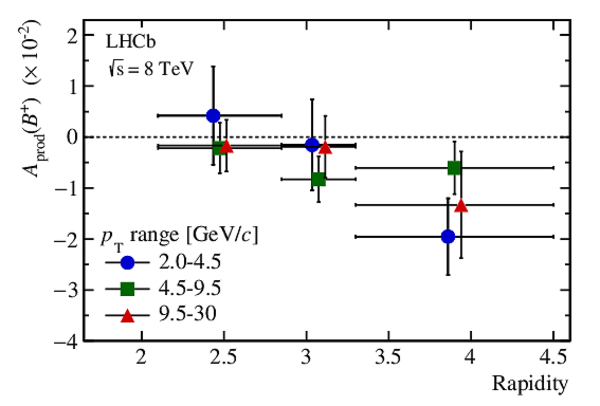
The measured $\mathcal{A}_{\rm prod}( B ^+ )$ as a function of rapidity of the $B$ meson in three bins of $ p_{\mathrm{ T}} $. The ranges of $p_{\mathrm{ T}}$ are indicated in the legends. The left- and right-hand figures correspond to 7 and 8 TeV centre-of-mass energies, respectively. |
Fig4a.pdf [14 KiB] HiDef png [119 KiB] Thumbnail [112 KiB] *.C file |

|
|
Fig4b.pdf [14 KiB] HiDef png [120 KiB] Thumbnail [113 KiB] *.C file |
|
|
|
Animated gif made out of all figures. |
PAPER-2016-054.gif Thumbnail |

|
![HiDef png [30 KiB]](Directory_LHCb-PAPER-2016-054/hidef_Fig1a.png)
![HiDef png [48 KiB]](Directory_LHCb-PAPER-2016-054/hidef_Fig1b.png)
![HiDef png [348 KiB]](Directory_LHCb-PAPER-2016-054/hidef_Fig2a.png)
![HiDef png [321 KiB]](Directory_LHCb-PAPER-2016-054/hidef_Fig2b.png)
![HiDef png [135 KiB]](Directory_LHCb-PAPER-2016-054/hidef_Fig3.png)
![HiDef png [119 KiB]](Directory_LHCb-PAPER-2016-054/hidef_Fig4a.png)
![HiDef png [120 KiB]](Directory_LHCb-PAPER-2016-054/hidef_Fig4b.png)
Tables and captions
|
The $p_{\mathrm{ T}}$ and $y$ intervals for each kinematic bin, and the corresponding signal yields in each of the $B^+$ decay modes, summing over the two centre-of-mass energies. |
Table_1.pdf [46 KiB] HiDef png [108 KiB] Thumbnail [51 KiB] tex code |

|
|
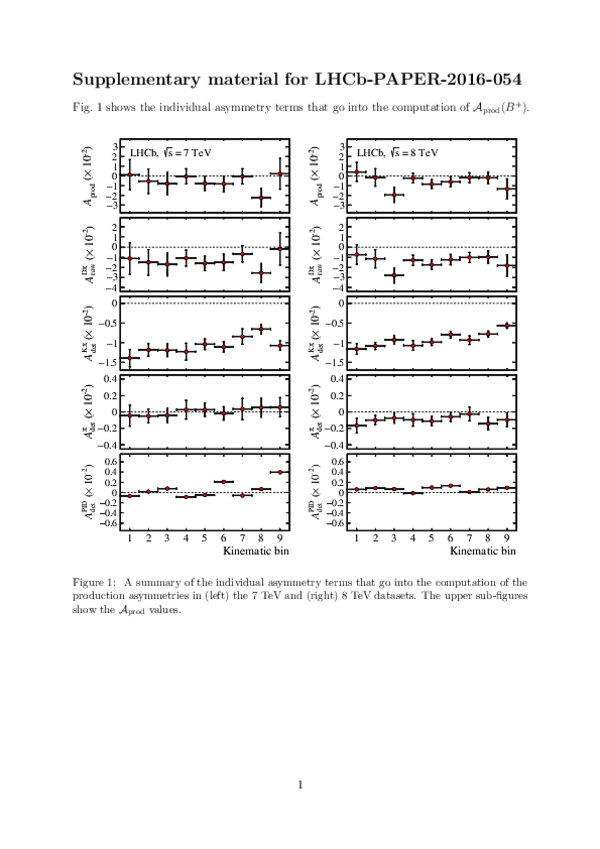
A summary of the terms that enter the production asymmetry determination (Eq. 5) in the 7 TeV data set. The $p_{\mathrm{ T}}$ and $y$ intervals of each bin are provided in Tab. 1. The L0 trigger asymmetry $\mathcal{A}_{\rm det}^{\rm TIS}$ is omitted from this table since it is assumed to be independent of the $ B ^+ $ kinematics. All uncertainties are statistical. |
Table_2.pdf [51 KiB] HiDef png [91 KiB] Thumbnail [44 KiB] tex code |

|
|
A summary of the terms that enter the production asymmetry determination (Eq. 5) in the 8 TeV data set. The L0 trigger asymmetry $\mathcal{A}_{\rm det}^{\rm TIS}$ is omitted from this table since it is assumed to be independent of the $ B ^+ $ kinematics. All uncertainties are statistical. |
Table_3.pdf [51 KiB] HiDef png [93 KiB] Thumbnail [44 KiB] tex code |

|
|
Systematic uncertainties on the $\mathcal{A}_{\rm prod}( B ^+ )$ measurement. The $\mathcal{A}_{ C P }^{D\pi}$ uncertainty varies between the kinematic bins and the range is indicated. All systematic uncertainties are considered to be correlated between kinematic bins. |
Table_4.pdf [51 KiB] HiDef png [57 KiB] Thumbnail [26 KiB] tex code |

|
|
The measured $\mathcal{A}_{\rm prod}$ values for each kinematic bin and integrated over the full kinematic acceptance, $2 < p_{\mathrm{ T}} < 30$ $ {\mathrm{ Ge V /}c}$ and $2.1 < y < 4.5$. The integrated values sum over the asymmetries in each bin, weighted by the values, $w$, in the second and fourth columns for the two centre-of-mass energies. The first uncertainty is the statistical uncertainty on $\mathcal{A}_{\rm raw}^{D\pi}$ and is uncorrelated between the kinematic bins. The second uncertainty is the statistical uncertainty on the detection asymmetry corrections and is taken to be correlated between the kinematic bins. The third uncertainty is purely systematic and is assumed to be correlated between bins. |
Table_5.pdf [45 KiB] HiDef png [107 KiB] Thumbnail [49 KiB] tex code |

|
|
Residual differences $\delta \mathcal{A}_{\rm det}^{K\pi}$ , measured in each bin of $B$ kinematics. These are the effective values after summing over centre-of-mass energies and averaging over the two $\overline{ D }{} {}^0$ decay modes. |
Table_6.pdf [49 KiB] HiDef png [179 KiB] Thumbnail [74 KiB] tex code |

|
![HiDef png [108 KiB]](Directory_LHCb-PAPER-2016-054/hidef_Table_1.png)
![HiDef png [91 KiB]](Directory_LHCb-PAPER-2016-054/hidef_Table_2.png)
![HiDef png [93 KiB]](Directory_LHCb-PAPER-2016-054/hidef_Table_3.png)
![HiDef png [57 KiB]](Directory_LHCb-PAPER-2016-054/hidef_Table_4.png)
![HiDef png [107 KiB]](Directory_LHCb-PAPER-2016-054/hidef_Table_5.png)
![HiDef png [179 KiB]](Directory_LHCb-PAPER-2016-054/hidef_Table_6.png)
Supplementary Material [file]
| Supplementary material full pdf |
Supple[..].pdf [97 KiB] |
|
|
FigSup1a.pdf [19 KiB] HiDef png [340 KiB] Thumbnail [452 KiB] *C file |

|
|
|
FigSup1b.pdf [19 KiB] HiDef png [338 KiB] Thumbnail [453 KiB] *C file |
|
![HiDef png [340 KiB]](Directory_LHCb-PAPER-2016-054/supplementary/hidef_FigSup1a.png)
![HiDef png [338 KiB]](Directory_LHCb-PAPER-2016-054/supplementary/hidef_FigSup1b.png)
Created on 27 April 2024.