Observation of the decay $B_{s}^{0} \to \eta_{c} \phi$ and evidence for $B_{s}^{0} \to \eta_{c} \pi^{+} \pi^{-} $
[to restricted-access page]Information
LHCb-PAPER-2016-056
CERN-EP-2017-026
arXiv:1702.08048 [PDF]
(Submitted on 26 Feb 2017)
JHEP 07 (2017) 021
Inspire 1515201
Tools
Abstract
A study of $B^{0}_{s} \to \eta_{c} \phi$ and $B^{0}_{s} \to \eta_{c} \pi^{+}\pi^{-}$ decays is performed using $pp$ collision data corresponding to an integrated luminosity of 3.0$ \rm fb^{-1}$, collected with the LHCb detector in Run 1 of the LHC. The observation of the decay $B^{0}_{s} \to \eta_{c} \phi$ is reported, where the $\eta_{c}$ meson is reconstructed in the $p\bar p$, $K^+K^-\pi^+\pi^-$, $\pi^+\pi^-\pi^+\pi^-$ and $K^+K^-K^+K^-$ decay modes and the $\phi(1020)$ in the $K^+ K^-$ decay mode. The decay $B^{0}_{s} \to J/\psi \phi$ is used as a normalisation channel. Evidence is also reported for the decay $B^{0}_{s} \to \eta_{c} \pi^{+}\pi^{-}$, where the $\eta_{c}$ meson is reconstructed in the $p\bar p$ decay mode, using the decay $B^{0}_{s} \to J/\psi \pi^+ \pi^-$ as a normalisation channel. The measured branching fractions are \begin{eqnarray*} {\mathcal B (B^{0}_{s} \to \eta_{c} \phi)} &=& \left(5.01 \pm 0.53 \pm 0.27 \pm 0.63 \right) \times 10^{-4} , \nonumber \\ {\mathcal B (B^{0}_{s} \to \eta_{c} \pi^+ \pi^-)} &=& \left(1.76 \pm 0.59 \pm 0.12 \pm 0.29 \right) \times 10^{-4} , \end{eqnarray*} where in each case the first uncertainty is statistical, the second systematic and the third uncertainty is due to the limited knowledge of the external branching fractions.
Figures and captions
|
Leading diagram corresponding to $ B ^0_ s \rightarrow \eta _ c \phi$ and $ B ^0_ s \rightarrow \eta _ c \pi ^+ \pi ^- $ decays, where the $\pi ^+ \pi ^- $ pair may arise from the decay of the $f_0(980)$ resonance. |
Fig1.pdf [8 KiB] HiDef png [93 KiB] Thumbnail [72 KiB] |

|
|
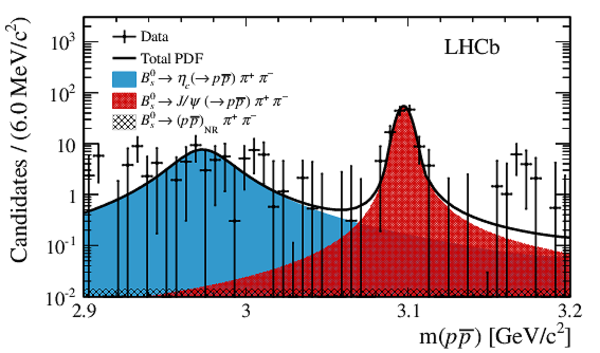
Distribution of $p\bar p$ invariant-mass for $ B ^0_ s \rightarrow p\bar{p}\pi ^+ \pi ^- $ candidates obtained by the $_s{\cal P}lot$ technique. The solid black curve is the projection of the total fit result. The full blue, tight-cross-hatched red and wide-cross-hatched black histograms show the $\eta _ c $ , $ { J \mskip -3mu/\mskip -2mu\psi \mskip 2mu}$ and nonresonant $p\bar p$ contributions, respectively. The structure visible around $3.15 $GeV is found to be consistant with a statistical fluctuation. |
Fig2.pdf [27 KiB] HiDef png [823 KiB] Thumbnail [335 KiB] |
|
|
One-dimensional scan of $-2 \Delta \ln L$ as a function of the $\eta _ c $ yield in the fit to the $p\bar{p}$ invariant-mass distribution for $ B ^0_ s \rightarrow p\bar{p}\pi ^+ \pi ^- $ candidates. The dotted red and solid blue curves correspond to the result of the scan including statistical only and summed (statistical and systematic) uncertainties, respectively. |
Fig3.pdf [14 KiB] HiDef png [90 KiB] Thumbnail [68 KiB] |

|
|
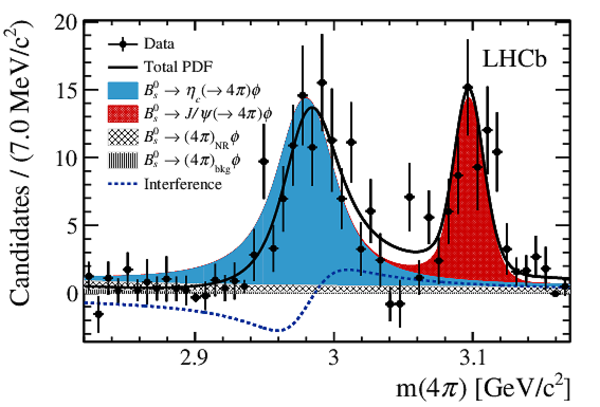
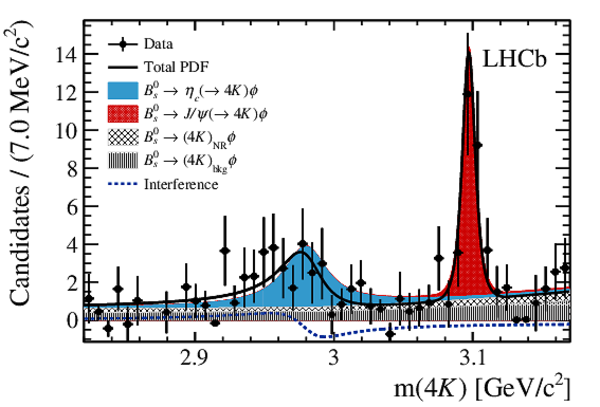
Distribution of the $p\bar p$ and each of the $4h$ invariant-mass spectra for $ B ^0_ s \rightarrow p\bar{p}(4h)\phi$ candidates obtained by the $_s{\cal P}lot$ technique. The solid black curve is the total result of the simultaneous fit. The full blue and tight-cross-hatched red histograms show the $\eta _ c $ and $ { J \mskip -3mu/\mskip -2mu\psi \mskip 2mu}$ contributions, respectively. In addition, for each of the $4h$ modes, the wide-cross-hatched and dotted black histograms show the $4h_{\rm NR}$ and $4h_{\rm bkg}$ contributions, respectively. The dashed blue curves show the interference between $ B ^0_ s \rightarrow \eta _ c (\rightarrow 4h)\phi$ and $ B ^0_ s \rightarrow (4h)_{\rm NR}\phi$ amplitudes. |
Fig4a.pdf [74 KiB] HiDef png [505 KiB] Thumbnail [251 KiB] |

|
|
Fig4b.pdf [78 KiB] HiDef png [503 KiB] Thumbnail [294 KiB] |

|
|
|
Fig4c.pdf [81 KiB] HiDef png [550 KiB] Thumbnail [303 KiB] |
|
|
|
Fig4d.pdf [80 KiB] HiDef png [452 KiB] Thumbnail [269 KiB] |
|
|
|
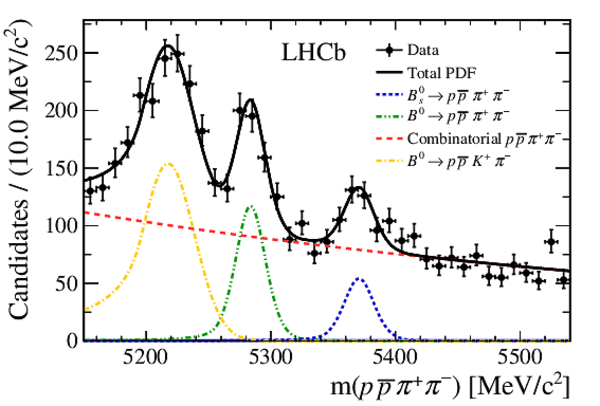
Distribution of the $p\bar{p}\pi ^+ \pi ^- $ invariant mass. Points with error bars show the data. The solid curve is the projection of the total fit result. The short-dashed blue, the dashed-double-dotted green, the dashed-single-dotted yellow and medium-dashed red curves show the $ B ^0_ s \rightarrow p\bar{p}\pi ^+ \pi ^- $, $ B ^0 \rightarrow p\bar{p}\pi ^+ \pi ^- $, $ B ^0 \rightarrow p\bar{p} K ^+ \pi ^- $ and combinatorial background contributions, respectively. |
Fig5.pdf [21 KiB] HiDef png [293 KiB] Thumbnail [246 KiB] |
|
|
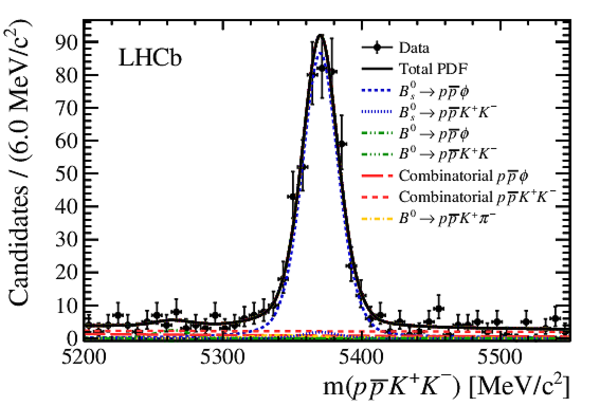
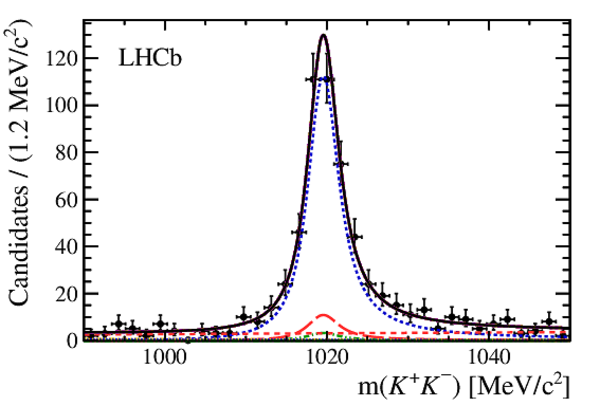
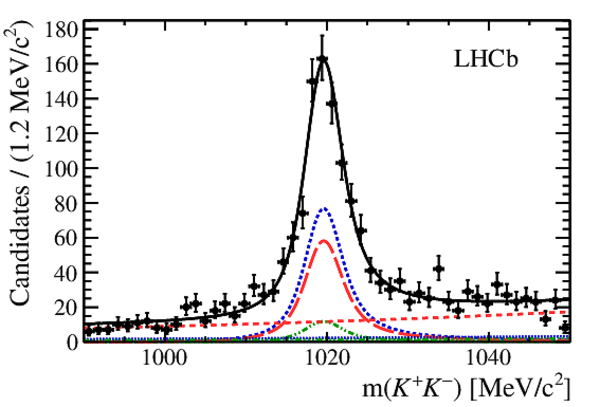
Distribution of the $p\bar{p} K ^+ K ^- $ (top) and $ K ^+ K ^- $ (bottom) invariant masses. Points with error bars show the data. The solid black curve is the projection of the total fit result. The short-dashed and dotted blue curves show the $ B ^0_ s \rightarrow p\bar{p}\phi$ and $ B ^0_ s \rightarrow p\bar{p} K ^+ K ^- $ contributions, respectively. The long-dashed and medium-dashed red curves show the contributions of the combinatorial background with prompt $\phi$ and NR $ K ^+ K ^- $, respectively. The dashed-double-dotted green, dashed-triple-dotted green and dashed-single-dotted-yellow curves show the $ B ^0 \rightarrow p\bar{p}\phi$, $ B ^0 \rightarrow p\bar{p} K ^+ K ^- $ and $ B ^0 \rightarrow p\bar{p} K ^+ \pi ^- $ contributions, respectively. |
Fig6a.pdf [24 KiB] HiDef png [369 KiB] Thumbnail [273 KiB] |
|
|
Fig6b.pdf [20 KiB] HiDef png [274 KiB] Thumbnail [187 KiB] |
|
|
|
Distribution of the $2K2\pi K ^+ K ^- $ (top) and $ K ^+ K ^- $ (bottom) invariant masses. Points with error bars show the data. The solid black curve is the projection of the total fit result. The short-dashed and dotted blue curves show the $ B ^0_ s \rightarrow 2K2\pi\phi$ and $ B ^0_ s \rightarrow 2K2\pi K ^+ K ^- $ contributions, respectively. The long-dashed and medium-dashed red curves show the contributions of the combinatorial background with prompt $\phi$ and NR $ K ^+ K ^- $, respectively. The dashed-double-dotted and dashed-triple-dotted green curves show the $ B ^0 \rightarrow 2K2\pi\phi$ and $ B ^0 \rightarrow 2K2\pi K ^+ K ^- $ contributions, respectively. |
Fig7a.pdf [30 KiB] HiDef png [334 KiB] Thumbnail [263 KiB] |

|
|
Fig7b.pdf [28 KiB] HiDef png [266 KiB] Thumbnail [206 KiB] |
|
|
|
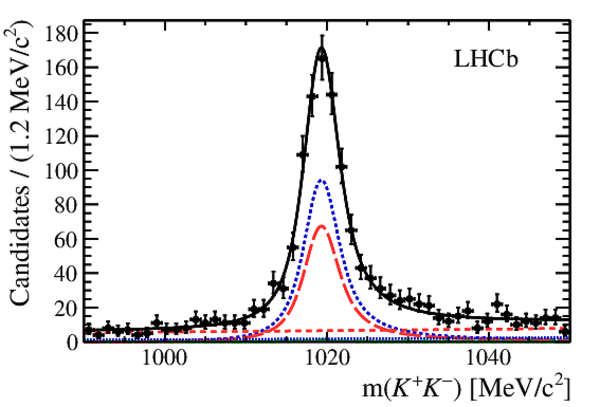
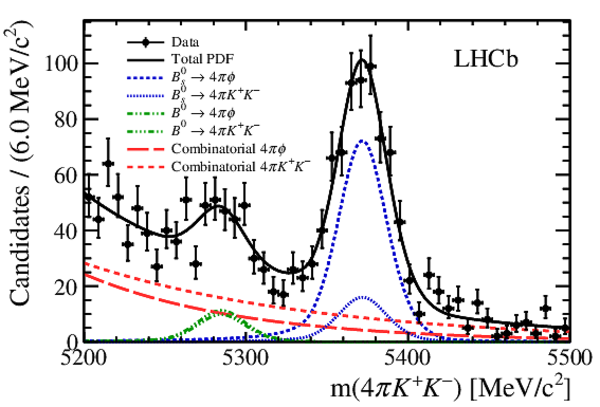
Distribution of the $4\pi K ^+ K ^- $ (top) and $ K ^+ K ^- $ (bottom) invariant masses. Points with error bars show the data. The solid black curve is the projection of the total fit result. The short-dashed and dotted blue curves show the $ B ^0_ s \rightarrow 4\pi\phi$ and $ B ^0_ s \rightarrow 4\pi K ^+ K ^- $ contributions, respectively. The long-dashed and medium-dashed red curves show the contributions of the combinatorial background with prompt $\phi$ and NR $ K ^+ K ^- $, respectively. The dashed-double-dotted and dashed-triple-dotted green curves show the $ B ^0 \rightarrow 4\pi\phi$ and $ B ^0 \rightarrow 4\pi K ^+ K ^- $ contributions, respectively. |
Fig8a.pdf [30 KiB] HiDef png [344 KiB] Thumbnail [274 KiB] |
|
|
Fig8b.pdf [29 KiB] HiDef png [273 KiB] Thumbnail [213 KiB] |
|
|
|
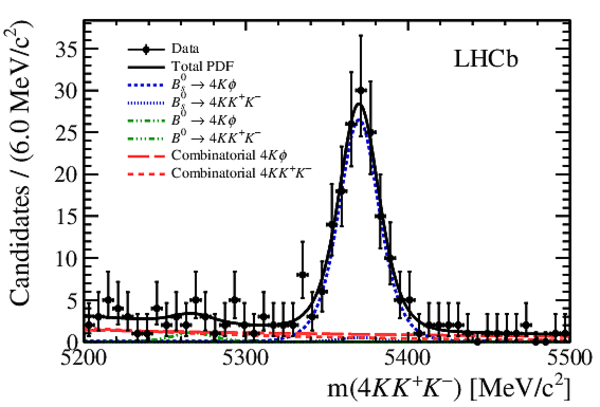
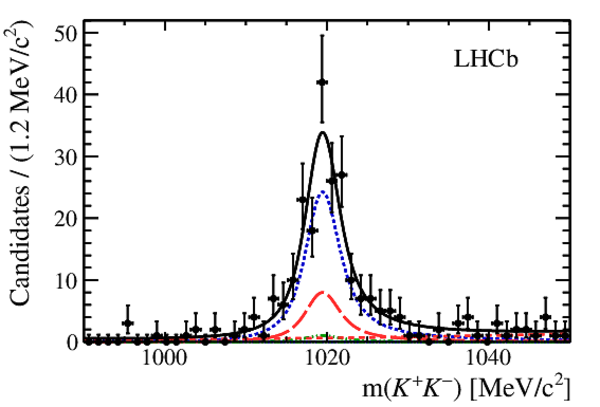
Distribution of the $4K K ^+ K ^- $ (top) and $ K ^+ K ^- $ (bottom) invariant masses. Points with error bars show the data. The solid black curve is the projection of the total fit result. The short-dashed and dotted blue curves show the $ B ^0_ s \rightarrow 4K\phi$ and $ B ^0_ s \rightarrow 4K K ^+ K ^- $ contributions, respectively. The long-dashed and medium-dashed red curves show the contributions of the combinatorial background with prompt $\phi$ and NR $ K ^+ K ^- $, respectively. The dashed-double-dotted and dashed-triple-dotted green curves show the $ B ^0 \rightarrow 4K\phi$ and $ B ^0 \rightarrow 4K K ^+ K ^- $ contributions, respectively. |
Fig9a.pdf [29 KiB] HiDef png [301 KiB] Thumbnail [238 KiB] |
|
|
Fig9b.pdf [27 KiB] HiDef png [217 KiB] Thumbnail [171 KiB] |
|
|
|
Animated gif made out of all figures. |
PAPER-2016-056.gif Thumbnail |

|
![HiDef png [93 KiB]](Directory_LHCb-PAPER-2016-056/hidef_Fig1.png)
![HiDef png [823 KiB]](Directory_LHCb-PAPER-2016-056/hidef_Fig2.png)
![HiDef png [90 KiB]](Directory_LHCb-PAPER-2016-056/hidef_Fig3.png)
![HiDef png [505 KiB]](Directory_LHCb-PAPER-2016-056/hidef_Fig4a.png)
![HiDef png [503 KiB]](Directory_LHCb-PAPER-2016-056/hidef_Fig4b.png)
![HiDef png [550 KiB]](Directory_LHCb-PAPER-2016-056/hidef_Fig4c.png)
![HiDef png [452 KiB]](Directory_LHCb-PAPER-2016-056/hidef_Fig4d.png)
![HiDef png [293 KiB]](Directory_LHCb-PAPER-2016-056/hidef_Fig5.png)
![HiDef png [369 KiB]](Directory_LHCb-PAPER-2016-056/hidef_Fig6a.png)
![HiDef png [274 KiB]](Directory_LHCb-PAPER-2016-056/hidef_Fig6b.png)
![HiDef png [334 KiB]](Directory_LHCb-PAPER-2016-056/hidef_Fig7a.png)
![HiDef png [266 KiB]](Directory_LHCb-PAPER-2016-056/hidef_Fig7b.png)
![HiDef png [344 KiB]](Directory_LHCb-PAPER-2016-056/hidef_Fig8a.png)
![HiDef png [273 KiB]](Directory_LHCb-PAPER-2016-056/hidef_Fig8b.png)
![HiDef png [301 KiB]](Directory_LHCb-PAPER-2016-056/hidef_Fig9a.png)
![HiDef png [217 KiB]](Directory_LHCb-PAPER-2016-056/hidef_Fig9b.png)
Tables and captions
|
Ratio of efficiencies between the normalisation and signal channels for each final state. |
Table_1.pdf [56 KiB] HiDef png [24 KiB] Thumbnail [10 KiB] tex code |

|
|
Yields of the different final states as obtained from the fit to the $p\bar{p}\pi ^+ \pi ^- $ invariant-mass distribution and from the 2D fits in the $p\bar{p}(4h) K ^+ K ^- \times K ^+ K ^- $ invariant-mass planes. Only statistical uncertainties are reported. The abbreviation "n/a" stands for "not applicable". |
Table_2.pdf [52 KiB] HiDef png [74 KiB] Thumbnail [38 KiB] tex code |

|
|
Results of the fit to the $p\bar p$ invariant-mass spectra weighted for $ B ^0_ s \rightarrow p\bar{p}\pi ^+ \pi ^- $ candidates. Uncertainties are statistical only. The parameter $N_{\rm NR}$ corresponds to the yield of $B^0_s \rightarrow (p\bar p)_{\rm NR} \pi^+ \pi^-$ candidates. The $\eta _ c $ yield does not appear since it is parametrised as a function of $\mathcal{B} ( B ^0_ s \rightarrow \eta _ c \pi ^+ \pi ^- )$, the measured value of which is reported in Eq. 22. |
[Error creating the table] | |
|
Result of the simultaneous fit to the $p\bar{p}$ and $4h$ invariant-mass spectra. Uncertainties are statistical only. The $ { J \mskip -3mu/\mskip -2mu\psi \mskip 2mu}$ and $\eta _ c $ magnitudes do not appear since they are set to unity as reference and parametrised as a function of $\mathcal{B} ( B ^0_ s \rightarrow \eta _ c \phi)$, respectively. In the simultaneous fit, the $m_{\eta _ c }$ and $m_{ { J \mskip -3mu/\mskip -2mu\psi \mskip 2mu} }$ parameters are shared across the four modes. The measured value of $\mathcal{B} ( B ^0_ s \rightarrow \eta _ c \phi)$ is reported in Eq. 23. The abbreviation "n/a" stands for "not applicable". |
Table_4.pdf [55 KiB] HiDef png [77 KiB] Thumbnail [39 KiB] tex code |

|
|
Fit fractions obtained from the parameters of the simultaneous fit to the $p\bar{p}$ and $4h$ invariant-mass spectra. Uncertainties are statistical only. Due to interference between $ B ^0_ s \rightarrow \eta _ c (\rightarrow 4h) \phi$ and $ B ^0_ s \rightarrow (4h)_{\rm NR} \phi$ amplitudes, for the $4h$ final states the sum of fit fractions, $\sum_k {\rm FF}_k $, may be different from unity. The abbreviation "n/a" stands for "not applicable". |
Table_5.pdf [58 KiB] HiDef png [58 KiB] Thumbnail [30 KiB] tex code |

|
|
Summary of systematic uncertainties. The "Sum" of systematic uncertainties is obtained from the quadratic sum of the individual sources, except the external branching fractions, which are quoted separately. All values are in $\%$ of the measured branching fractions. The abbreviation "n/a" stands for "not applicable". |
Table_6.pdf [56 KiB] HiDef png [70 KiB] Thumbnail [32 KiB] tex code |

|
|
Statistical correlation matrix for the parameters from the simultaneous fit to the $p\bar{p}$ and $4h$ invariant-mass spectra for $ B ^0_ s \rightarrow p\bar{p}\phi$ and $ B ^0_ s \rightarrow 4h\phi$ candidates. |
Table_7.pdf [53 KiB] HiDef png [180 KiB] Thumbnail [77 KiB] tex code |

|
![HiDef png [24 KiB]](Directory_LHCb-PAPER-2016-056/hidef_Table_1.png)
![HiDef png [74 KiB]](Directory_LHCb-PAPER-2016-056/hidef_Table_2.png)
![HiDef png [77 KiB]](Directory_LHCb-PAPER-2016-056/hidef_Table_4.png)
![HiDef png [58 KiB]](Directory_LHCb-PAPER-2016-056/hidef_Table_5.png)
![HiDef png [70 KiB]](Directory_LHCb-PAPER-2016-056/hidef_Table_6.png)
![HiDef png [180 KiB]](Directory_LHCb-PAPER-2016-056/hidef_Table_7.png)
Created on 27 April 2024.