Measurement of the $J/\psi$ pair production cross-section in $pp$ collisions at $\sqrt{s} = 13 {\mathrm{TeV}}$
[to restricted-access page]Information
LHCb-PAPER-2016-057
CERN-EP-2016-307
arXiv:1612.07451 [PDF]
(Submitted on 22 Dec 2016)
JHEP 06 (2017) 047
Inspire 1505592
Tools
Abstract
The production cross-section of $J/\psi$ pairs is measured using a data sample of $pp$ collisions collected by the LHCb experiment at a centre-of-mass energy of $\sqrt{s} = 13 {\mathrm{TeV}}$, corresponding to an integrated luminosity of $279 \pm 11 {\mathrm{pb^{-1}}}$. The measurement is performed for $J/\psi$ mesons with a transverse momentum of less than $10 {\mathrm{GeV}}/c$ in the rapidity range $2.0<y<4.5$. The production cross-section is measured to be $15.2 \pm 1.0 \pm 0.9 {\mathrm{nb}}$. The first uncertainty is statistical, and the second is systematic. The differential cross-sections as functions of several kinematic variables of the $J/\psi$ pair are measured and compared to theoretical predictions.
Figures and captions
|
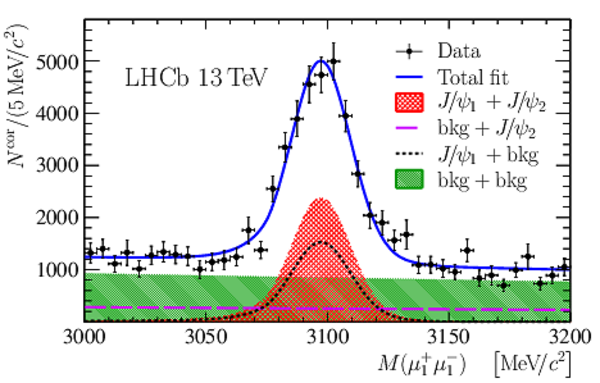
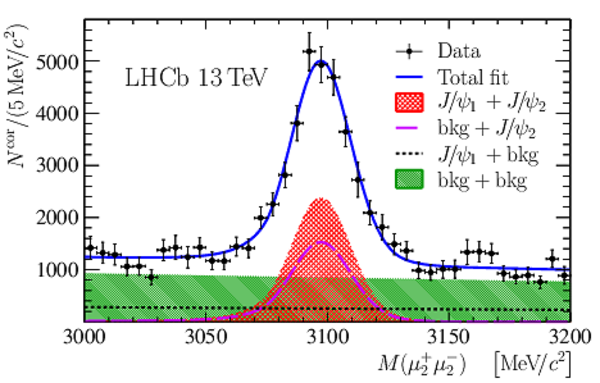
Projections of the fit to the efficiency-corrected distribution of the reconstructed $ { J \mskip -3mu/\mskip -2mu\psi \mskip 2mu} $ mass for (left) $M(\mu^+_1\mu^-_1)$ and (right) $M(\mu^+_2\mu^-_2)$. The (black) points with error bars represent the data. The (blue) solid line is the total fit function. The (red) cross-hatched area shows the signal distribution. The (black and magenta) dashed lines represent the background components due to the combination of a real $ { J \mskip -3mu/\mskip -2mu\psi \mskip 2mu} $ with a combinatorial candidate. The (green) shaded area shows the purely combinatorial background. |
Fig1a.pdf [71 KiB] HiDef png [845 KiB] Thumbnail [370 KiB] *.C file |
|
|
Fig1b.pdf [71 KiB] HiDef png [846 KiB] Thumbnail [369 KiB] *.C file |
|
|
|
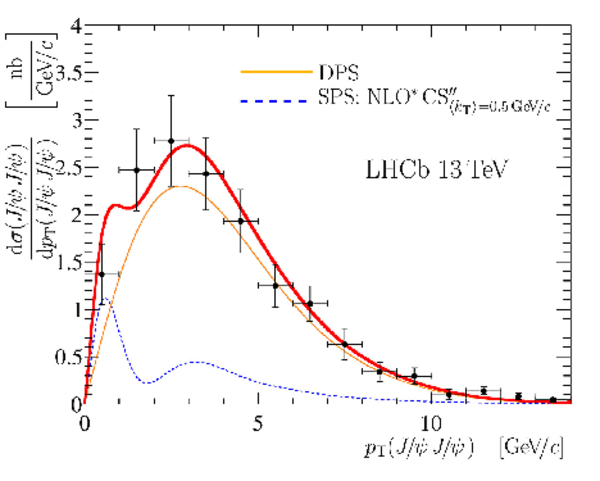
Comparisons between measurements and theoretical predictions for the differential cross-sections as a function of $p_{\mathrm{T}}( { J \mskip -3mu/\mskip -2mu\psi \mskip 2mu} { J \mskip -3mu/\mskip -2mu\psi \mskip 2mu} )$. The (black) points with error bars represent the measurements. |
Fig2.pdf [91 KiB] HiDef png [396 KiB] Thumbnail [320 KiB] *.C file |

|
|
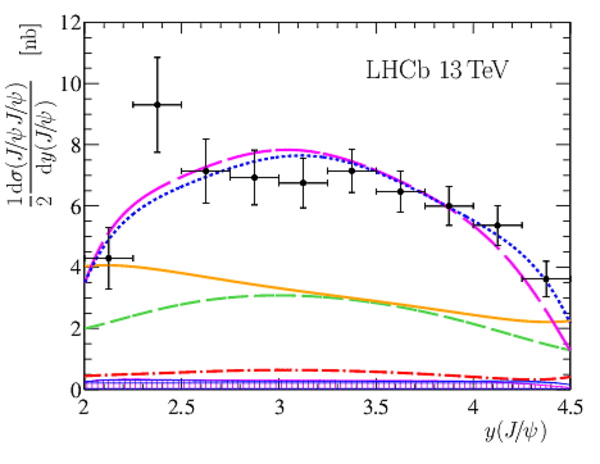
Comparisons between measurements and theoretical predictions for the differential cross-sections as functions of (top left) $p_{\mathrm{T}}( { J \mskip -3mu/\mskip -2mu\psi \mskip 2mu} )$, (top right) $y( { J \mskip -3mu/\mskip -2mu\psi \mskip 2mu} { J \mskip -3mu/\mskip -2mu\psi \mskip 2mu} )$ and (bottom) $y( { J \mskip -3mu/\mskip -2mu\psi \mskip 2mu} )$. The (black) points with error bars represent the measurements. |
Fig3a.pdf [88 KiB] HiDef png [340 KiB] Thumbnail [290 KiB] *.C file |

|
|
Fig3b.pdf [54 KiB] HiDef png [247 KiB] Thumbnail [199 KiB] *.C file |

|
|
|
Fig3c.pdf [56 KiB] HiDef png [255 KiB] Thumbnail [198 KiB] *.C file |
|
|
|
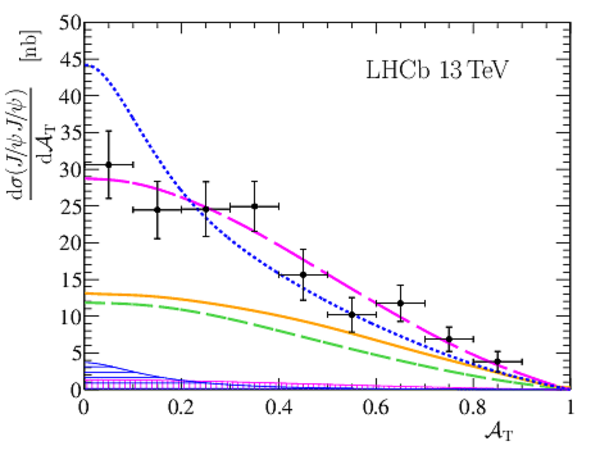
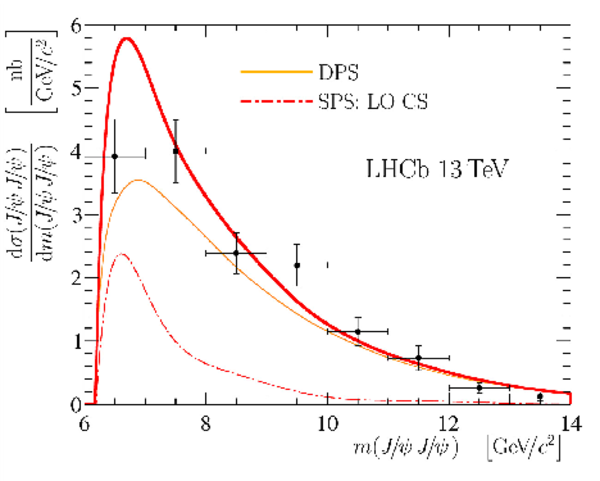
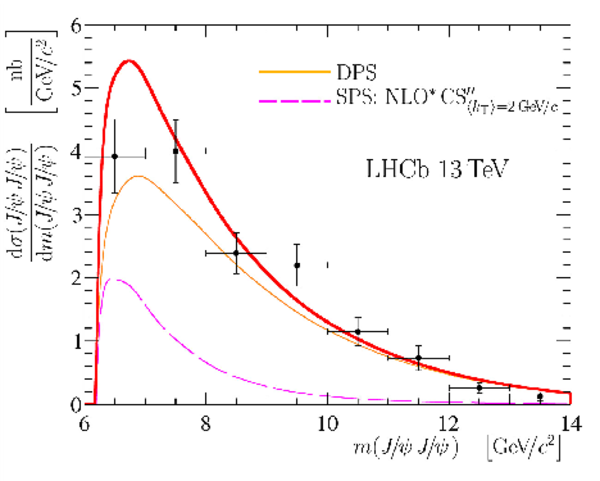
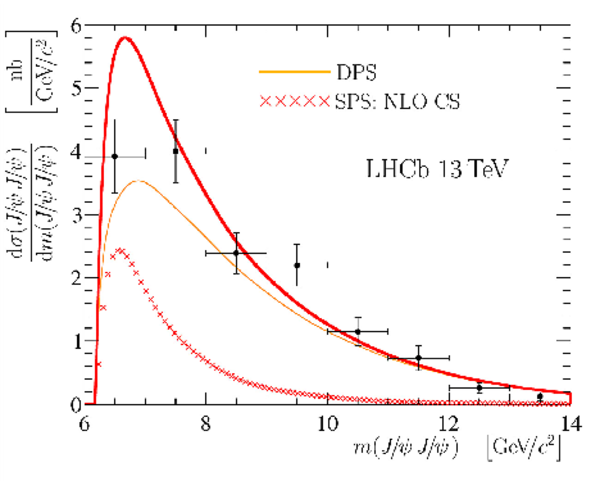
Comparisons between measurements and theoretical predictions for the differential cross-sections as functions of (top left) $\left| \Delta y \right|$, (top right) $\left| \Delta \phi \right|$, (bottom left) $\mathcal{A}_{\mathrm{T}}$ and (bottom right) $m( { J \mskip -3mu/\mskip -2mu\psi \mskip 2mu} { J \mskip -3mu/\mskip -2mu\psi \mskip 2mu} )$. The (black) points with error bars represent the measurements. |
Fig4a.pdf [84 KiB] HiDef png [359 KiB] Thumbnail [286 KiB] *.C file |

|
|
Fig4b.pdf [58 KiB] HiDef png [212 KiB] Thumbnail [189 KiB] *.C file |

|
|
|
Fig4c.pdf [66 KiB] HiDef png [247 KiB] Thumbnail [201 KiB] *.C file |
|
|
|
Fig4d.pdf [67 KiB] HiDef png [279 KiB] Thumbnail [198 KiB] *.C file |

|
|
|
Comparisons between measurements and theoretical predictions with $p_{\mathrm{T}}( { J \mskip -3mu/\mskip -2mu\psi \mskip 2mu} { J \mskip -3mu/\mskip -2mu\psi \mskip 2mu} )>1 {\mathrm{ Ge V /}c} $ for the differential cross-sections as functions of (top left) $p_{\mathrm{T}}( { J \mskip -3mu/\mskip -2mu\psi \mskip 2mu} )$, (top right) $y( { J \mskip -3mu/\mskip -2mu\psi \mskip 2mu} { J \mskip -3mu/\mskip -2mu\psi \mskip 2mu} )$ and (bottom) $y( { J \mskip -3mu/\mskip -2mu\psi \mskip 2mu} )$. The (black) points with error bars represent the measurements. |
Fig5a.pdf [81 KiB] HiDef png [313 KiB] Thumbnail [269 KiB] *.C file |
|
|
Fig5b.pdf [54 KiB] HiDef png [227 KiB] Thumbnail [192 KiB] *.C file |

|
|
|
Fig5c.pdf [57 KiB] HiDef png [253 KiB] Thumbnail [215 KiB] *.C file |

|
|
|
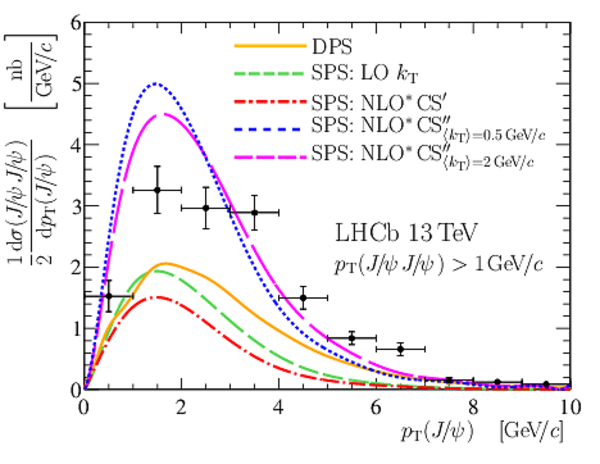
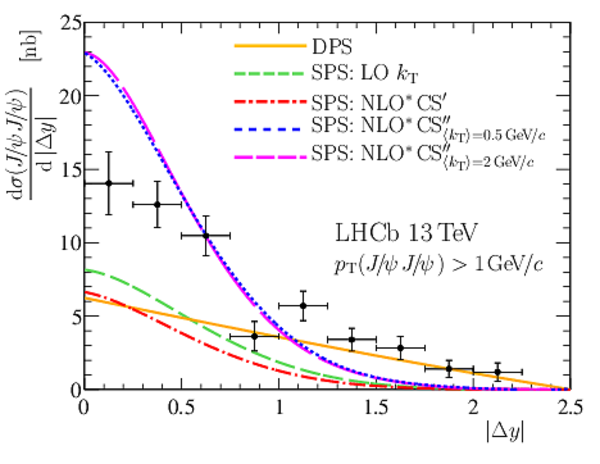
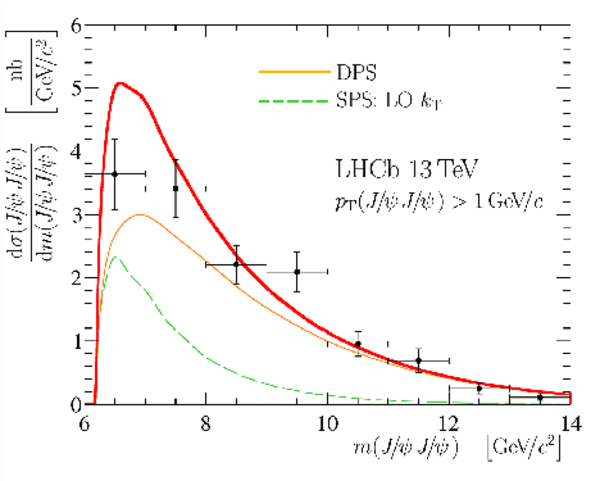
Comparisons between measurements and theoretical predictions with $p_{\mathrm{T}}( { J \mskip -3mu/\mskip -2mu\psi \mskip 2mu} { J \mskip -3mu/\mskip -2mu\psi \mskip 2mu} )>1 {\mathrm{ Ge V /}c} $ for the differential cross-sections as functions of (top left) $\left| \Delta y \right|$, (top right) $\left| \Delta \phi \right|$, (bottom left) $\mathcal{A}_{\mathrm{T}}$ and (bottom right) $m( { J \mskip -3mu/\mskip -2mu\psi \mskip 2mu} { J \mskip -3mu/\mskip -2mu\psi \mskip 2mu} )$. The (black) points with error bars represent the measurements. |
Fig6a.pdf [75 KiB] HiDef png [269 KiB] Thumbnail [234 KiB] *.C file |
|
|
Fig6b.pdf [62 KiB] HiDef png [209 KiB] Thumbnail [183 KiB] *.C file |

|
|
|
Fig6c.pdf [63 KiB] HiDef png [236 KiB] Thumbnail [195 KiB] *.C file |

|
|
|
Fig6d.pdf [62 KiB] HiDef png [253 KiB] Thumbnail [215 KiB] *.C file |

|
|
|
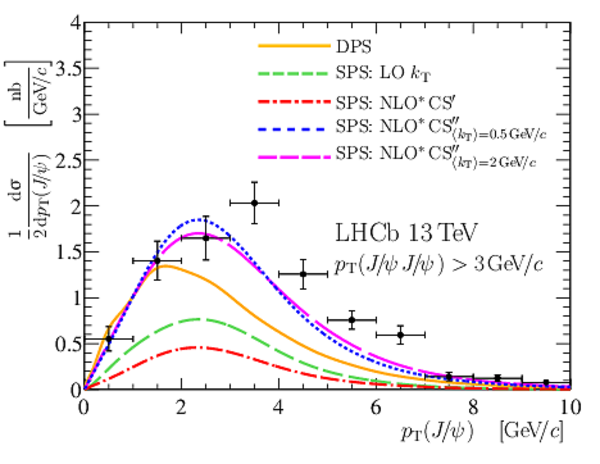
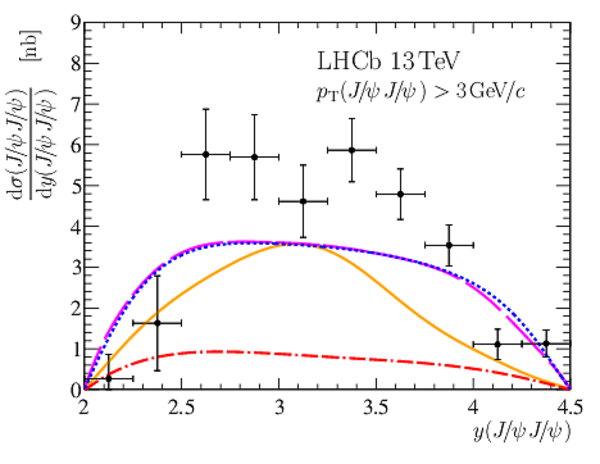
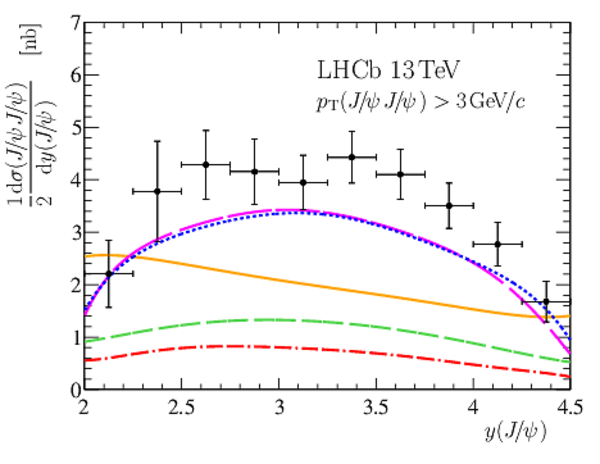
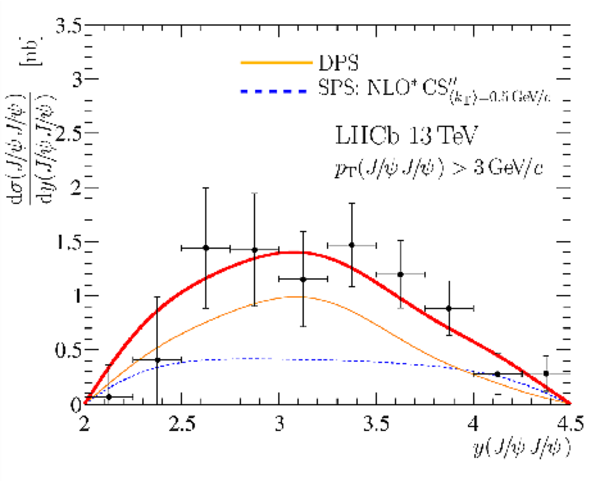
Comparisons between measurements and theoretical predictions with $p_{\mathrm{T}}( { J \mskip -3mu/\mskip -2mu\psi \mskip 2mu} { J \mskip -3mu/\mskip -2mu\psi \mskip 2mu} )>3 {\mathrm{ Ge V /}c} $ for the differential cross-sections as functions of (top left) $p_{\mathrm{T}}( { J \mskip -3mu/\mskip -2mu\psi \mskip 2mu} )$, (top right) $y( { J \mskip -3mu/\mskip -2mu\psi \mskip 2mu} { J \mskip -3mu/\mskip -2mu\psi \mskip 2mu} )$ and (bottom) $y( { J \mskip -3mu/\mskip -2mu\psi \mskip 2mu} )$. The (black) points with error bars represent the measurements. |
Fig7a.pdf [101 KiB] HiDef png [287 KiB] Thumbnail [253 KiB] *.C file |
|
|
Fig7b.pdf [54 KiB] HiDef png [214 KiB] Thumbnail [196 KiB] *.C file |
|
|
|
Fig7c.pdf [57 KiB] HiDef png [233 KiB] Thumbnail [196 KiB] *.C file |
|
|
|
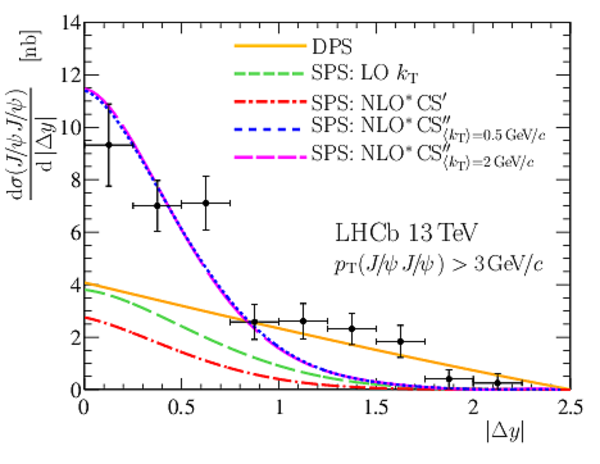
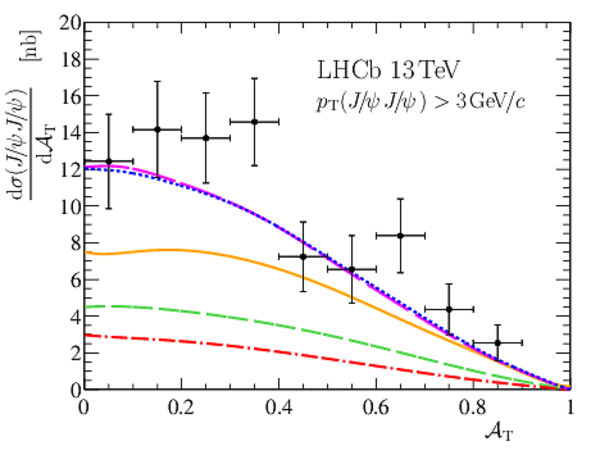
Comparisons between measurements and theoretical predictions with $p_{\mathrm{T}}( { J \mskip -3mu/\mskip -2mu\psi \mskip 2mu} { J \mskip -3mu/\mskip -2mu\psi \mskip 2mu} )>3 {\mathrm{ Ge V /}c} $ for the differential cross-sections as functions of (top left) $\left| \Delta y \right|$, (top right) $\left| \Delta \phi \right|$, (bottom left) $\mathcal{A}_{\mathrm{T}}$ and (bottom right) $m( { J \mskip -3mu/\mskip -2mu\psi \mskip 2mu} { J \mskip -3mu/\mskip -2mu\psi \mskip 2mu} )$. The (black) points with error bars represent the measurements. |
Fig8a.pdf [75 KiB] HiDef png [268 KiB] Thumbnail [234 KiB] *.C file |
|
|
Fig8b.pdf [63 KiB] HiDef png [227 KiB] Thumbnail [200 KiB] *.C file |

|
|
|
Fig8c.pdf [63 KiB] HiDef png [230 KiB] Thumbnail [194 KiB] *.C file |
|
|
|
Fig8d.pdf [70 KiB] HiDef png [247 KiB] Thumbnail [215 KiB] *.C file |

|
|
|
Result of templated DPS fit for $\frac{ \mathrm{d}\sigma( { J \mskip -3mu/\mskip -2mu\psi \mskip 2mu} { J \mskip -3mu/\mskip -2mu\psi \mskip 2mu} )}{\mathrm{d} p_{\mathrm{ T}} ( { J \mskip -3mu/\mskip -2mu\psi \mskip 2mu} { J \mskip -3mu/\mskip -2mu\psi \mskip 2mu} )}$ and $\frac{ \mathrm{d}\sigma( { J \mskip -3mu/\mskip -2mu\psi \mskip 2mu} { J \mskip -3mu/\mskip -2mu\psi \mskip 2mu} )}{\mathrm{d} y( { J \mskip -3mu/\mskip -2mu\psi \mskip 2mu} { J \mskip -3mu/\mskip -2mu\psi \mskip 2mu} )}$. The (black) points with error bars represent the data. The total fit result is shown with the thick (red) solid line and the DPS component is shown with the thin (orange) solid line. |
Fig9a.pdf [201 KiB] HiDef png [625 KiB] Thumbnail [231 KiB] *.C file |

|
|
Fig9b.pdf [212 KiB] HiDef png [258 KiB] Thumbnail [157 KiB] *.C file |
|
|
|
Fig9c.pdf [205 KiB] HiDef png [637 KiB] Thumbnail [236 KiB] *.C file |

|
|
|
Fig9d.pdf [217 KiB] HiDef png [264 KiB] Thumbnail [163 KiB] *.C file |

|
|
|
Fig9e.pdf [205 KiB] HiDef png [659 KiB] Thumbnail [243 KiB] *.C file |
|
|
|
Fig9f.pdf [215 KiB] HiDef png [267 KiB] Thumbnail [166 KiB] *.C file |

|
|
|
Result of templated DPS fit for $\frac{ \mathrm{d}\sigma( { J \mskip -3mu/\mskip -2mu\psi \mskip 2mu} { J \mskip -3mu/\mskip -2mu\psi \mskip 2mu} )}{\mathrm{d} m( { J \mskip -3mu/\mskip -2mu\psi \mskip 2mu} { J \mskip -3mu/\mskip -2mu\psi \mskip 2mu} )}$. The (black) points with error bars represent the data. The total fit result is shown with the thick (red) solid line and the DPS component is shown with the thin (orange) solid line. |
Fig10a.pdf [224 KiB] HiDef png [634 KiB] Thumbnail [221 KiB] *.C file |
|
|
Fig10b.pdf [221 KiB] HiDef png [265 KiB] Thumbnail [151 KiB] *.C file |

|
|
|
Fig10c.pdf [225 KiB] HiDef png [632 KiB] Thumbnail [226 KiB] *.C file |
|
|
|
Fig10d.pdf [241 KiB] HiDef png [690 KiB] Thumbnail [237 KiB] *.C file |
|
|
|
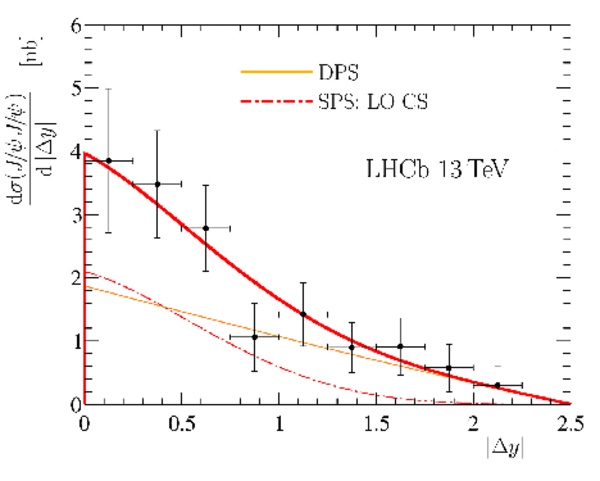
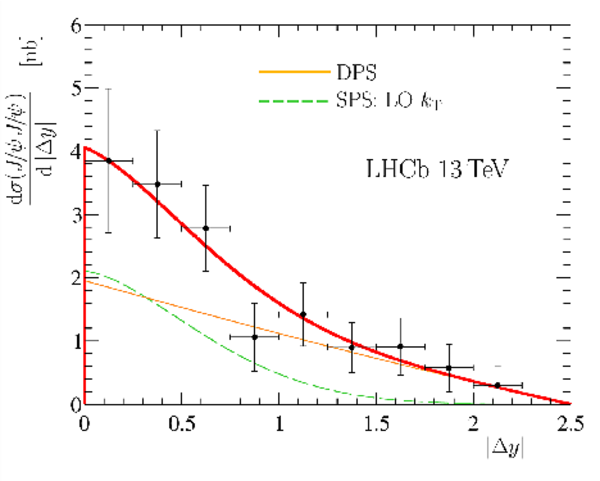
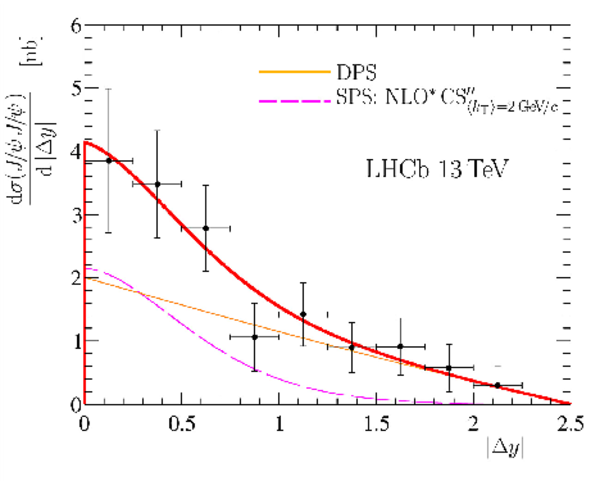
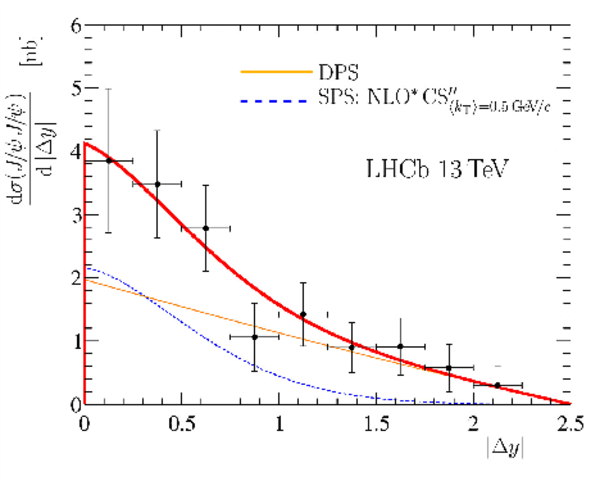
Result of templated DPS fit for $\frac{ \mathrm{d}\sigma( { J \mskip -3mu/\mskip -2mu\psi \mskip 2mu} { J \mskip -3mu/\mskip -2mu\psi \mskip 2mu} )}{\mathrm{d} \left| \Delta y \right|}$. The (black) points with error bars represent the data. The total fit result is shown with the thick (red) solid line and the DPS component is shown with the thin (orange) solid line. |
Fig11a.pdf [197 KiB] HiDef png [504 KiB] Thumbnail [179 KiB] *.C file |
|
|
Fig11b.pdf [197 KiB] HiDef png [209 KiB] Thumbnail [124 KiB] *.C file |
|
|
|
Fig11c.pdf [202 KiB] HiDef png [522 KiB] Thumbnail [189 KiB] *.C file |
|
|
|
Fig11d.pdf [200 KiB] HiDef png [530 KiB] Thumbnail [191 KiB] *.C file |
|
|
|
Fig11e.pdf [220 KiB] HiDef png [588 KiB] Thumbnail [201 KiB] *.C file |

|
|
|
Result of templated DPS fit for $\frac{ \mathrm{d}\sigma( { J \mskip -3mu/\mskip -2mu\psi \mskip 2mu} { J \mskip -3mu/\mskip -2mu\psi \mskip 2mu} )}{\mathrm{d} y( { J \mskip -3mu/\mskip -2mu\psi \mskip 2mu} { J \mskip -3mu/\mskip -2mu\psi \mskip 2mu} )}$ and $\frac{ \mathrm{d}\sigma( { J \mskip -3mu/\mskip -2mu\psi \mskip 2mu} )}{\mathrm{d} m( { J \mskip -3mu/\mskip -2mu\psi \mskip 2mu} { J \mskip -3mu/\mskip -2mu\psi \mskip 2mu} )}$ for the $ p_{\mathrm{ T}} ( { J \mskip -3mu/\mskip -2mu\psi \mskip 2mu} { J \mskip -3mu/\mskip -2mu\psi \mskip 2mu} )>1 {\mathrm{ Ge V /}c} $ region. The (black) points with error bars represent the data. The total fit result is shown with the thick (red) solid line and the DPS component is shown with the thin (orange) solid line. |
Fig12a.pdf [217 KiB] HiDef png [274 KiB] Thumbnail [172 KiB] *.C file |

|
|
Fig12b.pdf [223 KiB] HiDef png [274 KiB] Thumbnail [162 KiB] *.C file |
|
|
|
Fig12c.pdf [220 KiB] HiDef png [274 KiB] Thumbnail [174 KiB] *.C file |

|
|
|
Fig12d.pdf [226 KiB] HiDef png [654 KiB] Thumbnail [236 KiB] *.C file |

|
|
|
Fig12e.pdf [218 KiB] HiDef png [279 KiB] Thumbnail [177 KiB] *.C file |

|
|
|
Fig12f.pdf [221 KiB] HiDef png [612 KiB] Thumbnail [229 KiB] *.C file |

|
|
|
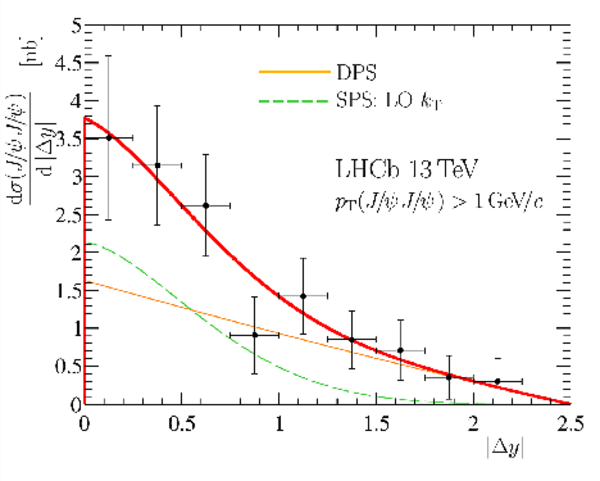
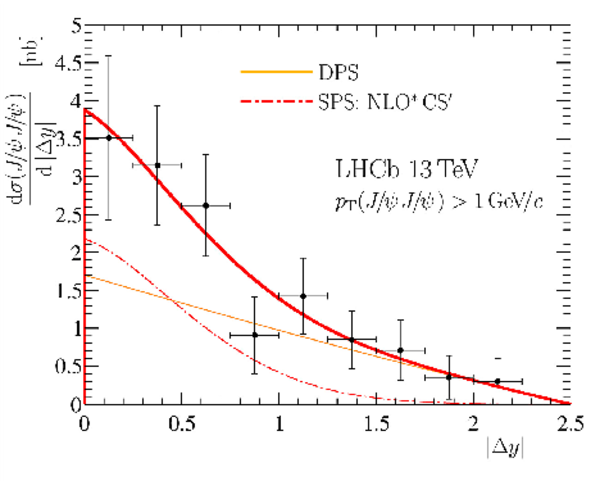
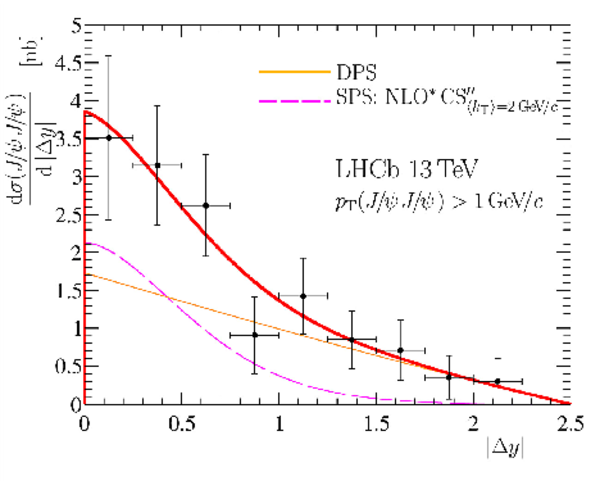
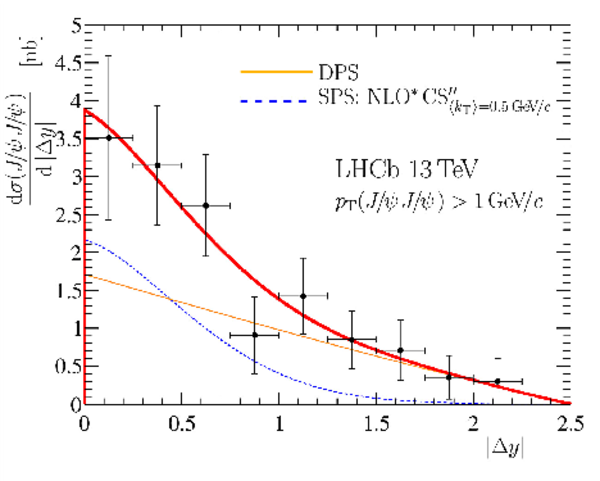
Result of templated DPS fit for $\frac{ \mathrm{d}\sigma( { J \mskip -3mu/\mskip -2mu\psi \mskip 2mu} { J \mskip -3mu/\mskip -2mu\psi \mskip 2mu} )}{\mathrm{d} \left| \Delta y \right|}$ for the $ p_{\mathrm{ T}} ( { J \mskip -3mu/\mskip -2mu\psi \mskip 2mu} { J \mskip -3mu/\mskip -2mu\psi \mskip 2mu} )>1 {\mathrm{ Ge V /}c} $ region. The (black) points with error bars represent the data. The total fit result is shown with the thick (red) solid line and the DPS component is shown with the thin (orange) solid line. |
Fig13a.pdf [211 KiB] HiDef png [247 KiB] Thumbnail [154 KiB] *.C file |
|
|
Fig13b.pdf [212 KiB] HiDef png [602 KiB] Thumbnail [223 KiB] *.C file |
|
|
|
Fig13c.pdf [216 KiB] HiDef png [611 KiB] Thumbnail [229 KiB] *.C file |
|
|
|
Fig13d.pdf [214 KiB] HiDef png [626 KiB] Thumbnail [234 KiB] *.C file |
|
|
|
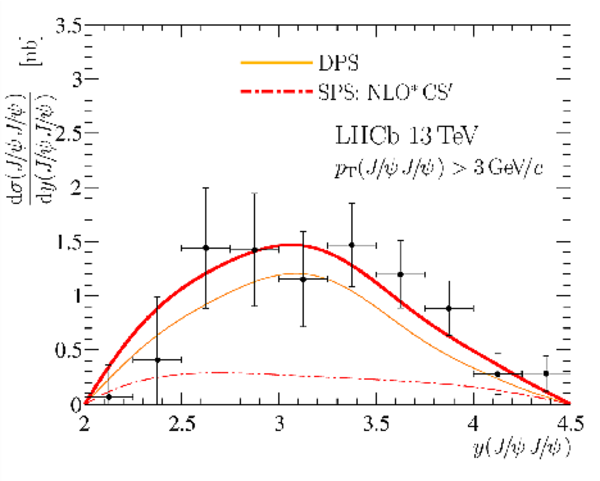
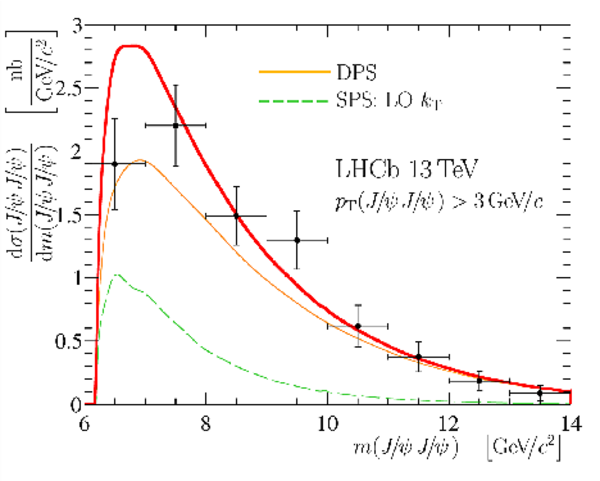
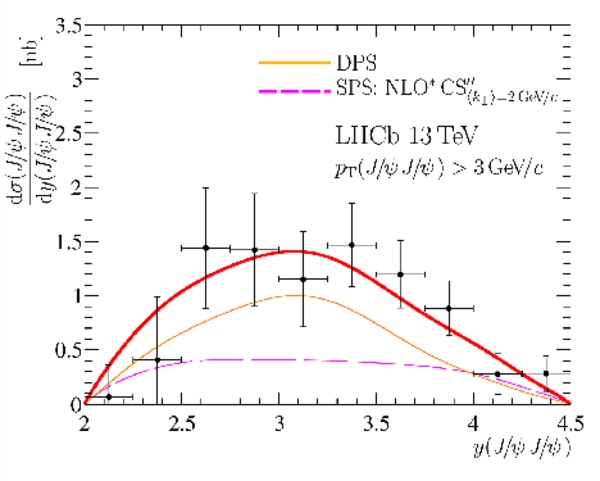
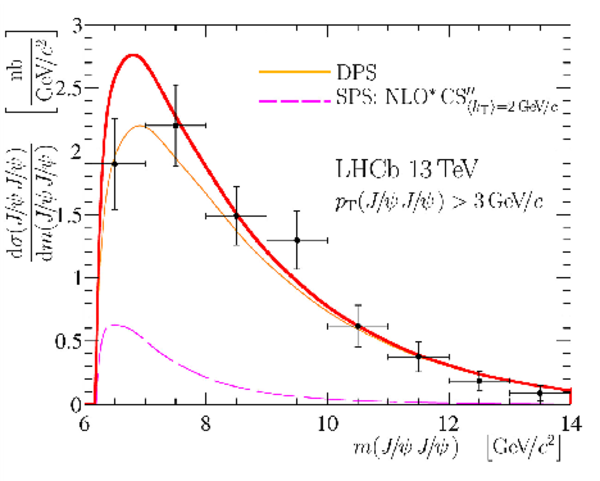
Result of templated DPS fit for $\frac{ \mathrm{d}\sigma( { J \mskip -3mu/\mskip -2mu\psi \mskip 2mu} { J \mskip -3mu/\mskip -2mu\psi \mskip 2mu} )}{\mathrm{d} y( { J \mskip -3mu/\mskip -2mu\psi \mskip 2mu} { J \mskip -3mu/\mskip -2mu\psi \mskip 2mu} )}$ and $\frac{ \mathrm{d}\sigma( { J \mskip -3mu/\mskip -2mu\psi \mskip 2mu} { J \mskip -3mu/\mskip -2mu\psi \mskip 2mu} )}{\mathrm{d} m( { J \mskip -3mu/\mskip -2mu\psi \mskip 2mu} { J \mskip -3mu/\mskip -2mu\psi \mskip 2mu} )}$ for the $ p_{\mathrm{ T}} ( { J \mskip -3mu/\mskip -2mu\psi \mskip 2mu} { J \mskip -3mu/\mskip -2mu\psi \mskip 2mu} )>3 {\mathrm{ Ge V /}c} $ region. The (black) points with error bars represent the data. The total fit result is shown with the thick (red) solid line and the DPS component is shown with the thin (orange) solid line. |
Fig14a.pdf [213 KiB] HiDef png [262 KiB] Thumbnail [161 KiB] *.C file |
|
|
Fig14b.pdf [232 KiB] HiDef png [292 KiB] Thumbnail [171 KiB] *.C file |
|
|
|
Fig14c.pdf [216 KiB] HiDef png [262 KiB] Thumbnail [163 KiB] *.C file |
|
|
|
Fig14d.pdf [232 KiB] HiDef png [670 KiB] Thumbnail [242 KiB] *.C file |

|
|
|
Fig14e.pdf [214 KiB] HiDef png [267 KiB] Thumbnail [167 KiB] *.C file |
|
|
|
Fig14f.pdf [233 KiB] HiDef png [660 KiB] Thumbnail [244 KiB] *.C file |
|
|
|
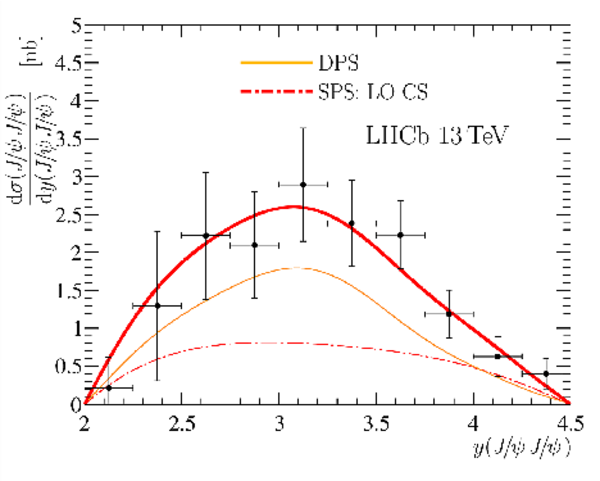
Result of templated DPS fit for $\frac{ \mathrm{d}\sigma( { J \mskip -3mu/\mskip -2mu\psi \mskip 2mu} { J \mskip -3mu/\mskip -2mu\psi \mskip 2mu} )}{\mathrm{d} \left| \Delta y \right|}$ for the $ p_{\mathrm{ T}} ( { J \mskip -3mu/\mskip -2mu\psi \mskip 2mu} { J \mskip -3mu/\mskip -2mu\psi \mskip 2mu} )>3 {\mathrm{ Ge V /}c} $ region. The (black) points with error bars represent the data. The total fit result is shown with the thick (red) solid line and the DPS component is shown with the thin (orange) solid line. |
Fig15a.pdf [204 KiB] HiDef png [234 KiB] Thumbnail [144 KiB] *.C file |

|
|
Fig15b.pdf [205 KiB] HiDef png [562 KiB] Thumbnail [208 KiB] *.C file |

|
|
|
Fig15c.pdf [209 KiB] HiDef png [574 KiB] Thumbnail [216 KiB] *.C file |

|
|
|
Fig15d.pdf [207 KiB] HiDef png [584 KiB] Thumbnail [218 KiB] *.C file |

|
|
|
Animated gif made out of all figures. |
PAPER-2016-057.gif Thumbnail |

|
![HiDef png [845 KiB]](Directory_LHCb-PAPER-2016-057/hidef_Fig1a.png)
![HiDef png [846 KiB]](Directory_LHCb-PAPER-2016-057/hidef_Fig1b.png)
![HiDef png [396 KiB]](Directory_LHCb-PAPER-2016-057/hidef_Fig2.png)
![HiDef png [340 KiB]](Directory_LHCb-PAPER-2016-057/hidef_Fig3a.png)
![HiDef png [247 KiB]](Directory_LHCb-PAPER-2016-057/hidef_Fig3b.png)
![HiDef png [255 KiB]](Directory_LHCb-PAPER-2016-057/hidef_Fig3c.png)
![HiDef png [359 KiB]](Directory_LHCb-PAPER-2016-057/hidef_Fig4a.png)
![HiDef png [212 KiB]](Directory_LHCb-PAPER-2016-057/hidef_Fig4b.png)
![HiDef png [247 KiB]](Directory_LHCb-PAPER-2016-057/hidef_Fig4c.png)
![HiDef png [279 KiB]](Directory_LHCb-PAPER-2016-057/hidef_Fig4d.png)
![HiDef png [313 KiB]](Directory_LHCb-PAPER-2016-057/hidef_Fig5a.png)
![HiDef png [227 KiB]](Directory_LHCb-PAPER-2016-057/hidef_Fig5b.png)
![HiDef png [253 KiB]](Directory_LHCb-PAPER-2016-057/hidef_Fig5c.png)
![HiDef png [269 KiB]](Directory_LHCb-PAPER-2016-057/hidef_Fig6a.png)
![HiDef png [209 KiB]](Directory_LHCb-PAPER-2016-057/hidef_Fig6b.png)
![HiDef png [236 KiB]](Directory_LHCb-PAPER-2016-057/hidef_Fig6c.png)
![HiDef png [253 KiB]](Directory_LHCb-PAPER-2016-057/hidef_Fig6d.png)
![HiDef png [287 KiB]](Directory_LHCb-PAPER-2016-057/hidef_Fig7a.png)
![HiDef png [214 KiB]](Directory_LHCb-PAPER-2016-057/hidef_Fig7b.png)
![HiDef png [233 KiB]](Directory_LHCb-PAPER-2016-057/hidef_Fig7c.png)
![HiDef png [268 KiB]](Directory_LHCb-PAPER-2016-057/hidef_Fig8a.png)
![HiDef png [227 KiB]](Directory_LHCb-PAPER-2016-057/hidef_Fig8b.png)
![HiDef png [230 KiB]](Directory_LHCb-PAPER-2016-057/hidef_Fig8c.png)
![HiDef png [247 KiB]](Directory_LHCb-PAPER-2016-057/hidef_Fig8d.png)
![HiDef png [625 KiB]](Directory_LHCb-PAPER-2016-057/hidef_Fig9a.png)
![HiDef png [258 KiB]](Directory_LHCb-PAPER-2016-057/hidef_Fig9b.png)
![HiDef png [637 KiB]](Directory_LHCb-PAPER-2016-057/hidef_Fig9c.png)
![HiDef png [264 KiB]](Directory_LHCb-PAPER-2016-057/hidef_Fig9d.png)
![HiDef png [659 KiB]](Directory_LHCb-PAPER-2016-057/hidef_Fig9e.png)
![HiDef png [267 KiB]](Directory_LHCb-PAPER-2016-057/hidef_Fig9f.png)
![HiDef png [634 KiB]](Directory_LHCb-PAPER-2016-057/hidef_Fig10a.png)
![HiDef png [265 KiB]](Directory_LHCb-PAPER-2016-057/hidef_Fig10b.png)
![HiDef png [632 KiB]](Directory_LHCb-PAPER-2016-057/hidef_Fig10c.png)
![HiDef png [690 KiB]](Directory_LHCb-PAPER-2016-057/hidef_Fig10d.png)
![HiDef png [504 KiB]](Directory_LHCb-PAPER-2016-057/hidef_Fig11a.png)
![HiDef png [209 KiB]](Directory_LHCb-PAPER-2016-057/hidef_Fig11b.png)
![HiDef png [522 KiB]](Directory_LHCb-PAPER-2016-057/hidef_Fig11c.png)
![HiDef png [530 KiB]](Directory_LHCb-PAPER-2016-057/hidef_Fig11d.png)
![HiDef png [588 KiB]](Directory_LHCb-PAPER-2016-057/hidef_Fig11e.png)
![HiDef png [274 KiB]](Directory_LHCb-PAPER-2016-057/hidef_Fig12a.png)
![HiDef png [274 KiB]](Directory_LHCb-PAPER-2016-057/hidef_Fig12b.png)
![HiDef png [274 KiB]](Directory_LHCb-PAPER-2016-057/hidef_Fig12c.png)
![HiDef png [654 KiB]](Directory_LHCb-PAPER-2016-057/hidef_Fig12d.png)
![HiDef png [279 KiB]](Directory_LHCb-PAPER-2016-057/hidef_Fig12e.png)
![HiDef png [612 KiB]](Directory_LHCb-PAPER-2016-057/hidef_Fig12f.png)
![HiDef png [247 KiB]](Directory_LHCb-PAPER-2016-057/hidef_Fig13a.png)
![HiDef png [602 KiB]](Directory_LHCb-PAPER-2016-057/hidef_Fig13b.png)
![HiDef png [611 KiB]](Directory_LHCb-PAPER-2016-057/hidef_Fig13c.png)
![HiDef png [626 KiB]](Directory_LHCb-PAPER-2016-057/hidef_Fig13d.png)
![HiDef png [262 KiB]](Directory_LHCb-PAPER-2016-057/hidef_Fig14a.png)
![HiDef png [292 KiB]](Directory_LHCb-PAPER-2016-057/hidef_Fig14b.png)
![HiDef png [262 KiB]](Directory_LHCb-PAPER-2016-057/hidef_Fig14c.png)
![HiDef png [670 KiB]](Directory_LHCb-PAPER-2016-057/hidef_Fig14d.png)
![HiDef png [267 KiB]](Directory_LHCb-PAPER-2016-057/hidef_Fig14e.png)
![HiDef png [660 KiB]](Directory_LHCb-PAPER-2016-057/hidef_Fig14f.png)
![HiDef png [234 KiB]](Directory_LHCb-PAPER-2016-057/hidef_Fig15a.png)
![HiDef png [562 KiB]](Directory_LHCb-PAPER-2016-057/hidef_Fig15b.png)
![HiDef png [574 KiB]](Directory_LHCb-PAPER-2016-057/hidef_Fig15c.png)
![HiDef png [584 KiB]](Directory_LHCb-PAPER-2016-057/hidef_Fig15d.png)
Tables and captions
|
Summary of the systematic uncertainties on the measurement of the $ { J \mskip -3mu/\mskip -2mu\psi \mskip 2mu} $ pair production cross-section. |
Table_1.pdf [48 KiB] HiDef png [68 KiB] Thumbnail [31 KiB] tex code |

|
|
Summary of the theoretical predictions and the measurement of $\sigma( { J \mskip -3mu/\mskip -2mu\psi \mskip 2mu} { J \mskip -3mu/\mskip -2mu\psi \mskip 2mu} )$ for different regions of transverse momentum of the $ { J \mskip -3mu/\mskip -2mu\psi \mskip 2mu} $ pair. For SPS predictions, the first uncertainty accounts for the variation of PDFs and gluon densities, while the second one corresponds to the variation of the factorisation and renormalisation scales. For the LO CO predictions the third uncertainty corresponds to the choice of LDMEs from Refs. [114,115,116,117,118,119,120,25]. For NLO CS predictions [39] the uncertainty corresponds to the variation of the factorisation and renormalization scales. For the DPS prediction the first uncertainty is due to the measured prompt $ { J \mskip -3mu/\mskip -2mu\psi \mskip 2mu}$ production cross-section [86] and the second is due to the uncertainty in $\sigma_{\mathrm{eff}}$ [44,92]. |
Table_2.pdf [55 KiB] HiDef png [79 KiB] Thumbnail [40 KiB] tex code |

|
|
Percentages of the DPS component, $f_{\mathrm{DPS}}$, determined with the simple twodash-component fit to different distributions for different SPS models. |
Table_3.pdf [47 KiB] HiDef png [100 KiB] Thumbnail [50 KiB] tex code |

|
|
Summary of the $\sigma_{\mathrm{eff}}$ values (in ${\mathrm{mb}} $) from DPS fits for different SPS models. The uncertainty is statistical only, originating from the statistical uncertainty in $\sigma_{\mathrm{DPS}}$ (and ${\mathrm{d}\sigma\left( { J \mskip -3mu/\mskip -2mu\psi \mskip 2mu} { J \mskip -3mu/\mskip -2mu\psi \mskip 2mu} \right)}/{\mathrm{d}v}$). The common systematic uncertainty of 12%, accounting for the systematic uncertainty of $\sigma\left( { J \mskip -3mu/\mskip -2mu\psi \mskip 2mu} { J \mskip -3mu/\mskip -2mu\psi \mskip 2mu} \right)$ and the total uncertainty for $\sigma( { J \mskip -3mu/\mskip -2mu\psi \mskip 2mu} )$, is not shown. |
Table_4.pdf [46 KiB] HiDef png [50 KiB] Thumbnail [25 KiB] tex code |

|
![HiDef png [68 KiB]](Directory_LHCb-PAPER-2016-057/hidef_Table_1.png)
![HiDef png [79 KiB]](Directory_LHCb-PAPER-2016-057/hidef_Table_2.png)
![HiDef png [100 KiB]](Directory_LHCb-PAPER-2016-057/hidef_Table_3.png)
![HiDef png [50 KiB]](Directory_LHCb-PAPER-2016-057/hidef_Table_4.png)
Supplementary Material [file]
| Supplementary material full pdf |
supple[..].pdf [183 KiB] |
|
|
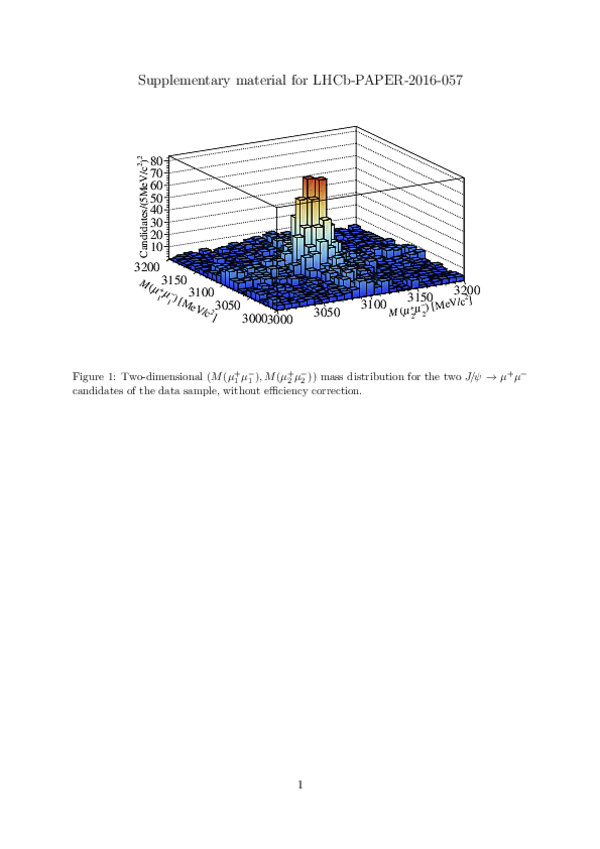
This ZIP file contains supplemetary material for the publication LHCb-PAPER-2016-057. The files are: Supplementary.pdf : An overview of the extra figure *.pdf, *.png, *.eps : The figure in variuous formats |
Fig1.pdf [128 KiB] HiDef png [1 MiB] Thumbnail [501 KiB] *C file |

|
![HiDef png [1 MiB]](Directory_LHCb-PAPER-2016-057/supplementary/hidef_Fig1.png)
Created on 26 April 2024.