Information
LHCb-PAPER-2016-058
CERN-EP-2016-314
arXiv:1701.01856 [PDF]
(Submitted on 07 Jan 2017)
Phys. Rev. Lett. 118 (2017) 111803
Inspire 1508166
Tools
Abstract
Using proton-proton collision data corresponding to an integrated luminosity of 3.0 fb$^{-1}$, recorded by the LHCb detector at centre-of-mass energies of 7 and 8 TeV, the $B_{c}^{+} \rightarrow D^{0} K^{+}$ decay is observed with a statistical significance of 5.1 standard deviations. By normalising to $B^{+} \rightarrow \bar{D}^{0} \pi^{+}$ decays, a measurement of the branching fraction multiplied by the production rates for $B_{c}^{+}$ relative to $B^{+}$ mesons in the LHCb acceptance is obtained, $$ R_{D^{0} K} = \frac{f_{c}}{f_{u}}\times\mathcal{B}(B_{c}^{+} \rightarrow D^{0} K^{+}) = (9.3 ^{+2.8}_{-2.5} \pm 0.6) \times 10^{-7} , $$ where the first uncertainty is statistical and the second is systematic. This decay is expected to proceed predominantly through weak annihilation and penguin amplitudes, and is the first $B_{c}^{+}$ decay of this nature to be observed.
Figures and captions
|
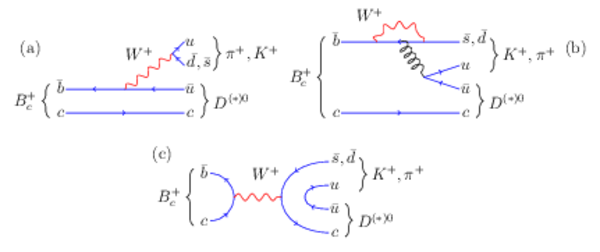
Tree (a), penguin (b), and weak annihilation (c) diagrams for the decays studied. In each case, the meson appearing before the comma denotes the favoured decay. |
Diagrams.pdf [193 KiB] HiDef png [78 KiB] Thumbnail [50 KiB] *.C file |
|
|
Results of the simultaneous fit to the $ D ^0 K ^+ $ (top plot) and $ D ^0 \pi ^+ $ (bottom plot) invariant mass distributions in the $ B _ c ^+ $ mass region, including the $ D ^0 \rightarrow K ^- \pi ^+ $ and $ D ^0 \rightarrow K ^- \pi ^+ \pi ^- \pi ^+ $ final states. Inclusion of the charge conjugate decays is implied. The red solid curve illustrates $ B _ c ^+ \rightarrow D ^0 K^+$ decays, the red dashed curve illustrates $ B _ c ^+ \rightarrow D ^{*0} K^+$ decays, the green dashed curve represents $ B _ c ^+ \rightarrow D ^{*0} \pi^+$ decays, the grey shaded region represents partially reconstructed background decays, the cyan dashed line represents the combinatorial background, and the total PDF is displayed as a blue solid line. The small drop visible in the total $ B _ c ^+ \rightarrow D^{(*)0} \pi ^+ $ PDF around the $ B _ c ^+$ mass arises from the fact that the fit finds a small negative value for the $ B _ c ^+ \rightarrow D ^0 \pi ^+ $ yield. |
Data_S[..].pdf [19 KiB] HiDef png [316 KiB] Thumbnail [239 KiB] *.C file |

|
|
CL$_{\text{s}}$ $p$-value distributions for the $R_{ D ^0 h}$ observables. The dashed line represents the expected CL$_{\text{s}}$ values, where the $1\sigma$ and $2\sigma$ contours are indicated by the green (dark) and yellow (light) shaded regions, respectively. Upper limits are determined by the points at which the observed $\text{CL}_{\text{s+b}}$ $p$-values (black points connected by straight lines) fall below 5% (red solid line). Also displayed are the corresponding $\text{CL}_{\text{s}} = \text{CL}_{\text{s+b}} / \text{CL}_{\text{b}}$ values (blue points connected by straight dotted lines). |
CLS_r_[..].pdf [10 KiB] HiDef png [121 KiB] Thumbnail [85 KiB] *.C file |

|
|
CLS_r_[..].pdf [10 KiB] HiDef png [148 KiB] Thumbnail [108 KiB] *.C file |

|
|
|
Animated gif made out of all figures. |
PAPER-2016-058.gif Thumbnail |

|
![HiDef png [78 KiB]](Directory_LHCb-PAPER-2016-058/hidef_Diagrams.png)
![HiDef png [316 KiB]](Directory_LHCb-PAPER-2016-058/hidef_Data_Sim_massFit_Bc2D0pi_Bc2D0K.png)
![HiDef png [121 KiB]](Directory_LHCb-PAPER-2016-058/hidef_CLS_r_bc_dpi.png)
![HiDef png [148 KiB]](Directory_LHCb-PAPER-2016-058/hidef_CLS_r_bc_dk.png)
Supplementary Material [file]
| Supplementary material full pdf |
supple[..].pdf [110 KiB] |
|
|
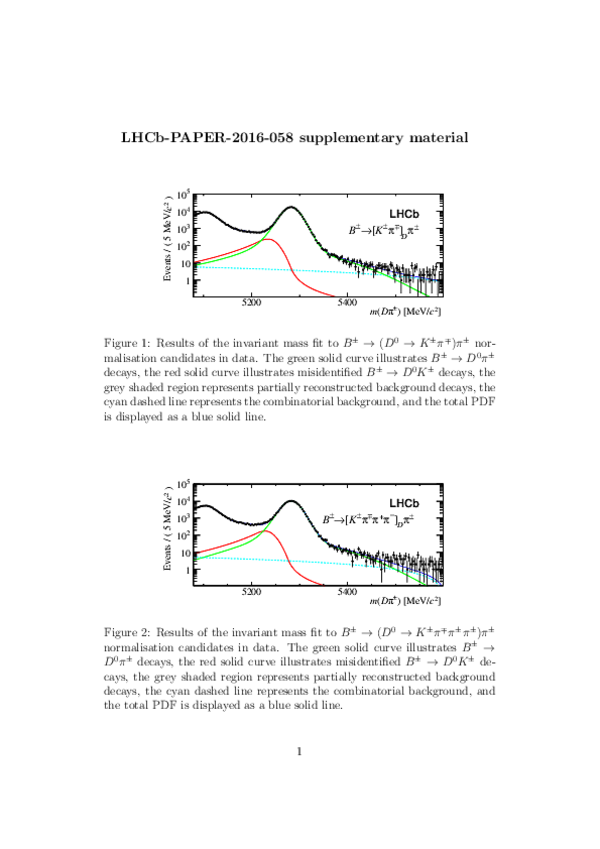
Supplementary material for LHCb-PAPER-2016-058 Contains the invariant mass fits to the B- -> (D0 -> K- π+) π- and B- -> (D0 -> K- π+ π- π+) π- modes, in Fig. 1 and Fig. 2, respectively. The normalisation yield used in this paper is taken from the sum of the signal yields measured in both of these fits. |
Fig1.pdf [29 KiB] HiDef png [554 KiB] Thumbnail [283 KiB] *C file |

|
|
Fig2.pdf [29 KiB] HiDef png [486 KiB] Thumbnail [273 KiB] *C file |

|
![HiDef png [554 KiB]](Directory_LHCb-PAPER-2016-058/supplementary/hidef_Fig1.png)
![HiDef png [486 KiB]](Directory_LHCb-PAPER-2016-058/supplementary/hidef_Fig2.png)
Created on 26 April 2024.