Measurement of the $C P$ violation parameter $A_\Gamma$ in $D^0 \to K^+K^-$ and $D^0 \to \pi^+\pi^-$ decays
[to restricted-access page]Information
LHCb-PAPER-2016-063
CERN-EP-2017-028
arXiv:1702.06490 [PDF]
(Submitted on 21 Feb 2017)
Phys. Rev. Lett. 118 (2017) 261803
Inspire 1514549
Tools
Abstract
Asymmetries in the time-dependent rates of $D^0 \to K^+K^-$ and $D^0 \to \pi^+\pi^-$ decays are measured in a $pp$ collision data sample collected with the LHCb detector during LHC Run 1, corresponding to an integrated luminosity of $3 \mathrm{fb}^{-1}$. The asymmetries in effective decay widths between $D^0$ and $\overline{D}^0$ decays, sensitive to indirect $CP$ violation, are measured to be $A_\Gamma(K^+ K^-) = (-0.30 \pm 0.32 \pm 0.10)\times 10^{-3}$ and $A_\Gamma(\pi^+\pi^-) = (0.46 \pm 0.58 \pm 0.12)\times 10^{-3}$, where the first uncertainty is statistical and the second systematic. These measurements show no evidence for $C P$ violation and improve on the precision of the previous best measurements by nearly a factor of two.
Figures and captions
|
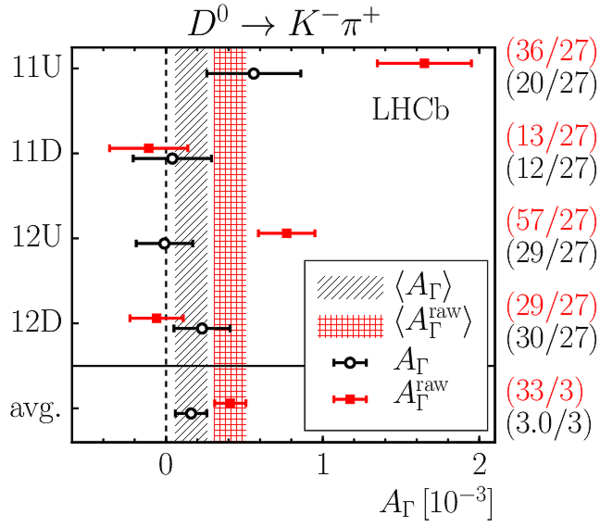
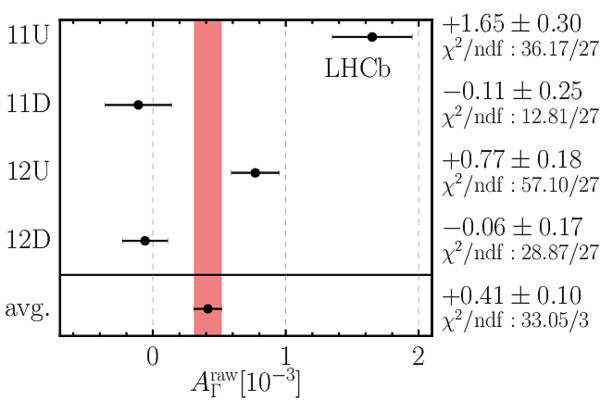
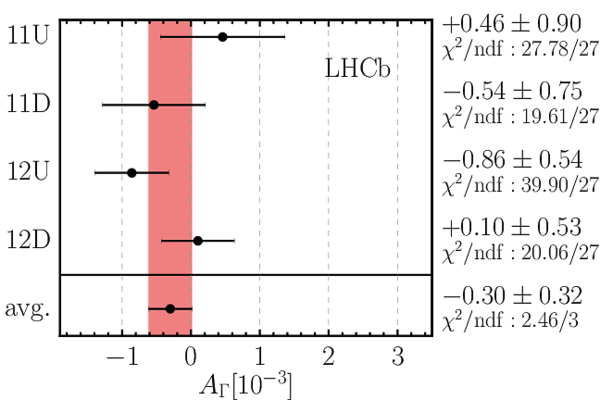
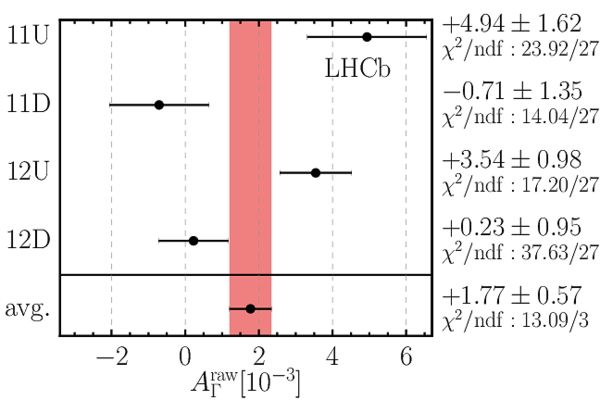
Results from $ A_{\Gamma} $ fits in each subsample, before (solid red squares) and after (empty black dots) the asymmetry correction. Fit qualities ($\chi^2 /$number of degrees of freedom) are also reported to the right of each graph. The weighted average of the four $ A_{\Gamma}$ values is indicated before (red hatched band) and after (black hatched band) the correction. The numerical values for the averages are $ A_{\Gamma} ( K ^- \pi ^+ ) =(0.41 \pm 0.10)\times 10^{-3}$, $ A_{\Gamma} ( K ^+ K ^- ) =(0.93 \pm 0.31)\times 10^{-3}$ and $ A_{\Gamma} (\pi ^+ \pi ^- ) =(1.77 \pm 0.57)\times 10^{-3}$ before the correction, and $ A_{\Gamma} ( K ^- \pi ^+ ) =(0.16 \pm 0.10)\times 10^{-3}$, $ A_{\Gamma} ( K ^+ K ^- ) =(-0.30 \pm 0.32)\times 10^{-3}$ and $ A_{\Gamma} (\pi ^+ \pi ^- ) =(0.46 \pm 0.58)\times 10^{-3}$ after the correction. The label 2011 (2012) is abbreviated 11 (12) and Mag Up ( MagDown ) is abbreviated $\mathrm{U}(\mathrm{D})$. |
Fig1a.pdf [13 KiB] HiDef png [277 KiB] Thumbnail [257 KiB] *.C file |
|
|
Fig1b.pdf [12 KiB] HiDef png [294 KiB] Thumbnail [278 KiB] *.C file |

|
|
|
Fig1c.pdf [12 KiB] HiDef png [283 KiB] Thumbnail [262 KiB] *.C file |

|
|
|
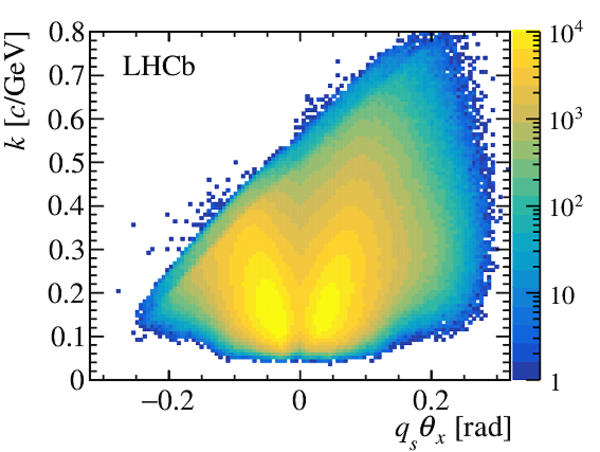
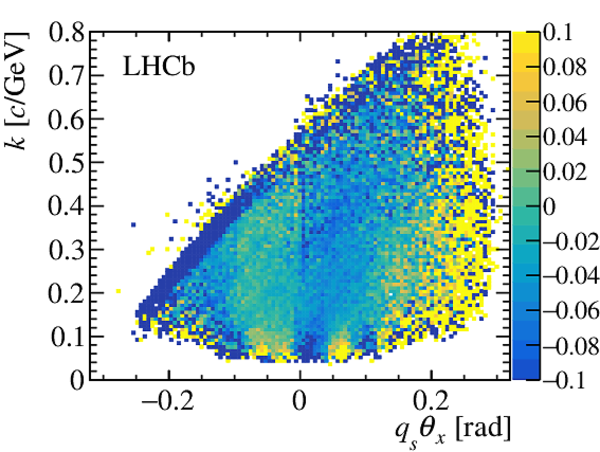
(Left) Sum and (right) asymmetry of distributions of positive and negative soft pions in the $(k, q_{s}\theta_x)$ plane for the 2011 Mag Up $ D ^0 \rightarrow K ^- \pi ^+ $ subsample, after integration over $\theta_y$. |
Fig2a.pdf [52 KiB] HiDef png [580 KiB] Thumbnail [508 KiB] *.C file |
|
|
Fig2b.pdf [58 KiB] HiDef png [955 KiB] Thumbnail [596 KiB] *.C file |
|
|
|
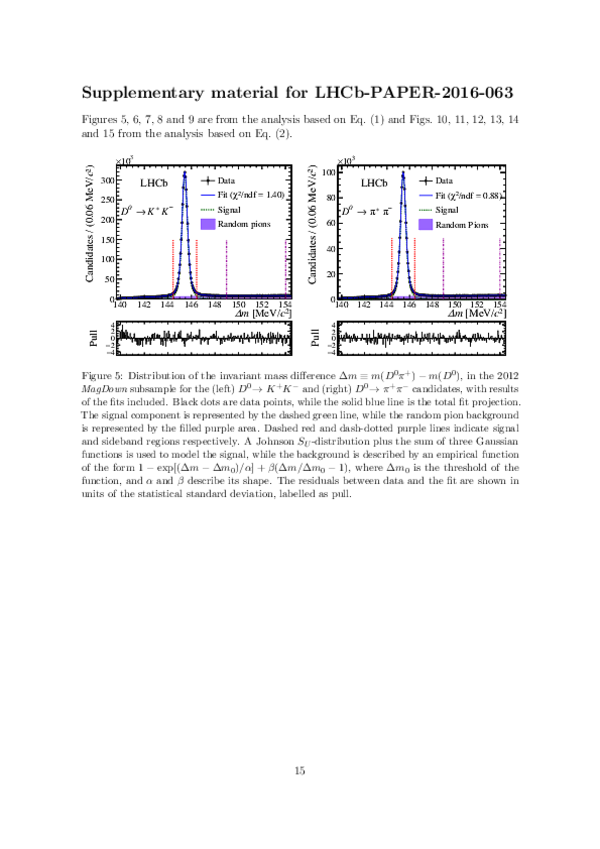
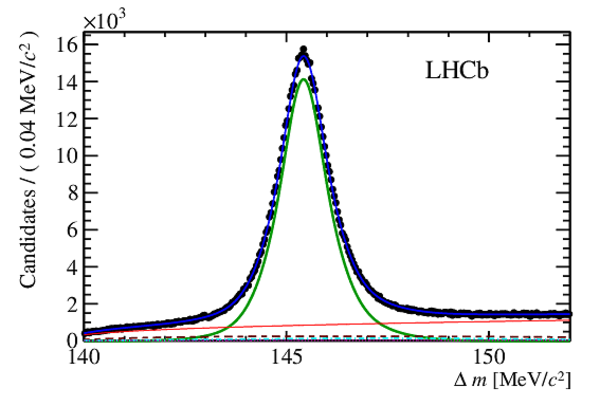
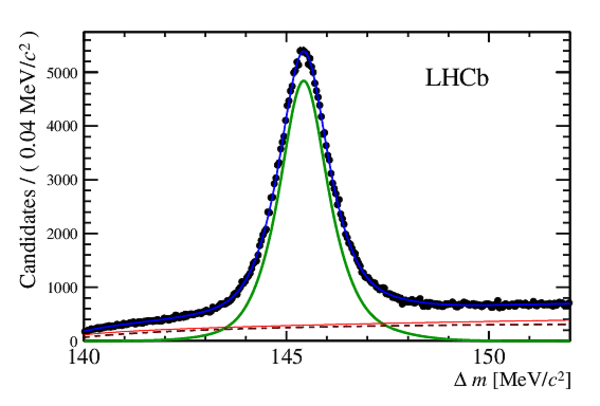
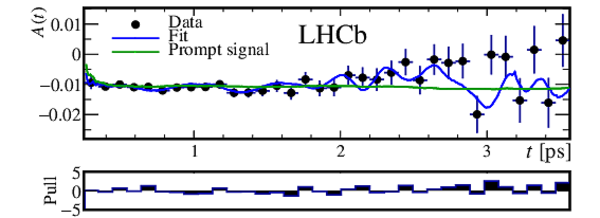
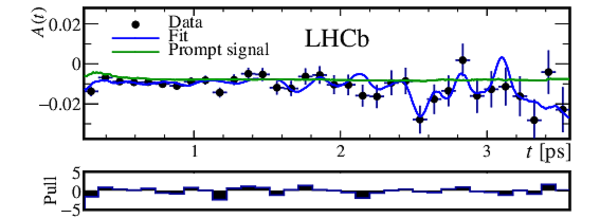
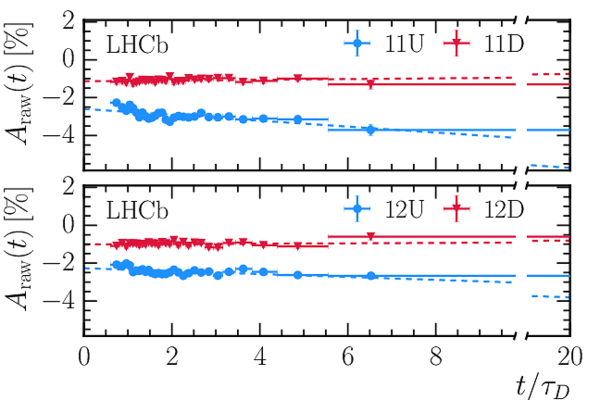
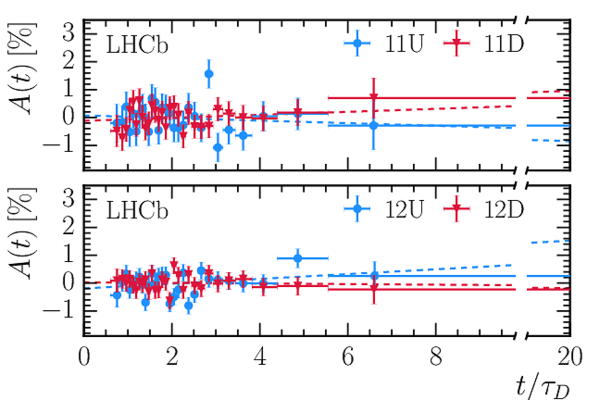
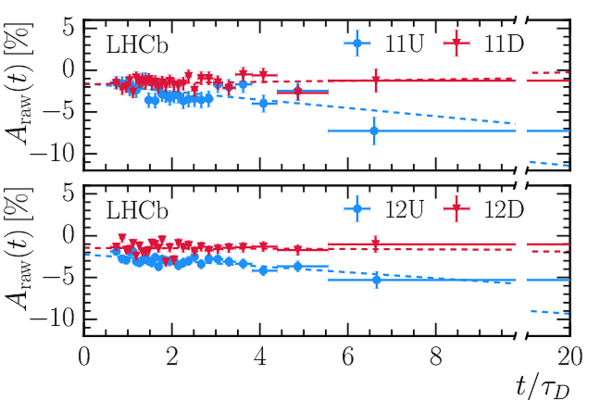
Measured asymmetry $A(t)$ in bins of $t/\tau_D$, where $\tau_D = 0.410 {\mathrm{ ps}} $ [16], for (top) $ D ^0 \rightarrow K ^+ K ^- $ and (bottom) $ D ^0 \rightarrow \pi ^+ \pi ^- $ , averaged over the full Run 1 data sample. Solid lines show the time dependence with a slope equal to the best estimates of $- A_{\Gamma} $. |
Fig3a.pdf [102 KiB] HiDef png [121 KiB] Thumbnail [98 KiB] *.C file |

|
|
Fig3b.pdf [103 KiB] HiDef png [123 KiB] Thumbnail [103 KiB] *.C file |

|
|
|
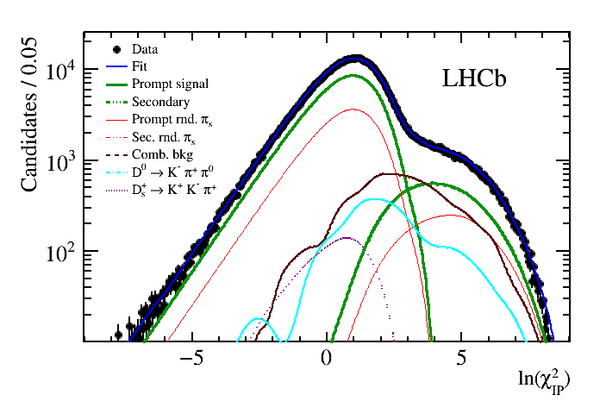
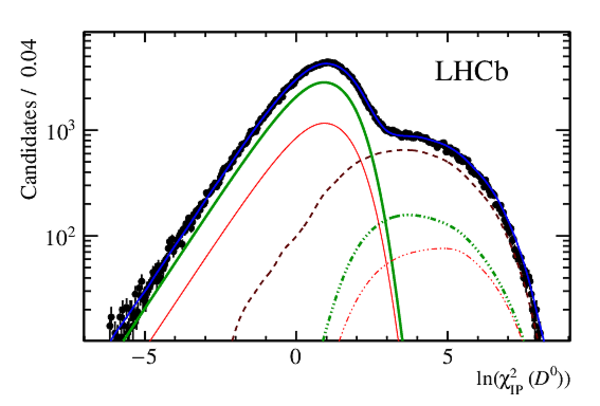
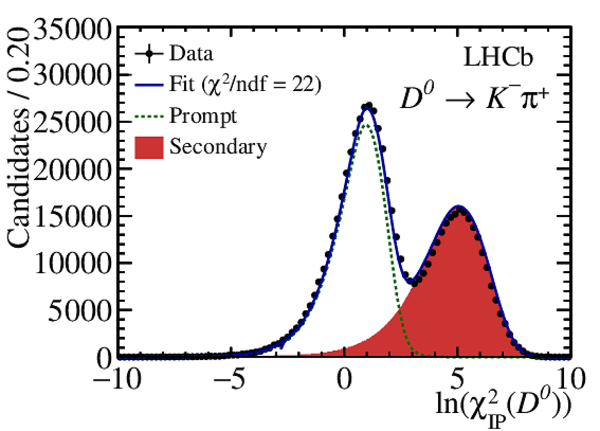
Distribution of $\ln(\chi^2_{\text{IP}} ( D ^0 ))$ for the $ D ^0 \rightarrow K ^+ K ^- $ candidates selected in the second of the three 2012 data taking periods with magnetic field pointing downwards. The unbinned maximum likelihood fit results are overlaid. Gaussian kernels are used to smooth the combinatorial and partially reconstructed backgrounds. |
Fig4.png [30 KiB] HiDef png [223 KiB] Thumbnail [101 KiB] *.C file |
|
|
Animated gif made out of all figures. |
PAPER-2016-063.gif Thumbnail |

|
Tables and captions
|
Signal yields in millions after all selection requirements. |
Table_1.pdf [53 KiB] HiDef png [44 KiB] Thumbnail [21 KiB] tex code |

|
Supplementary Material [file]


![HiDef png [277 KiB]](Directory_LHCb-PAPER-2016-063/hidef_Fig1a.png)
![HiDef png [294 KiB]](Directory_LHCb-PAPER-2016-063/hidef_Fig1b.png)
![HiDef png [283 KiB]](Directory_LHCb-PAPER-2016-063/hidef_Fig1c.png)
![HiDef png [580 KiB]](Directory_LHCb-PAPER-2016-063/hidef_Fig2a.png)
![HiDef png [955 KiB]](Directory_LHCb-PAPER-2016-063/hidef_Fig2b.png)
![HiDef png [121 KiB]](Directory_LHCb-PAPER-2016-063/hidef_Fig3a.png)
![HiDef png [123 KiB]](Directory_LHCb-PAPER-2016-063/hidef_Fig3b.png)
![Fig4.png [30 KiB]](Directory_LHCb-PAPER-2016-063/Fig4.png)
![HiDef png [223 KiB]](Directory_LHCb-PAPER-2016-063/hidef_Fig4.png)
![HiDef png [44 KiB]](Directory_LHCb-PAPER-2016-063/hidef_Table_1.png)
![HiDef png [287 KiB]](Directory_LHCb-PAPER-2016-063/supplementary/hidef_Fig10a.png)
![HiDef png [252 KiB]](Directory_LHCb-PAPER-2016-063/supplementary/hidef_Fig10b.png)
![HiDef png [250 KiB]](Directory_LHCb-PAPER-2016-063/supplementary/hidef_Fig11a.png)
![HiDef png [228 KiB]](Directory_LHCb-PAPER-2016-063/supplementary/hidef_Fig11b.png)
![HiDef png [313 KiB]](Directory_LHCb-PAPER-2016-063/supplementary/hidef_Fig12.png)
![HiDef png [270 KiB]](Directory_LHCb-PAPER-2016-063/supplementary/hidef_Fig13a.png)
![HiDef png [239 KiB]](Directory_LHCb-PAPER-2016-063/supplementary/hidef_Fig13b.png)
![HiDef png [148 KiB]](Directory_LHCb-PAPER-2016-063/supplementary/hidef_Fig14.png)
![HiDef png [144 KiB]](Directory_LHCb-PAPER-2016-063/supplementary/hidef_Fig15.png)
![HiDef png [322 KiB]](Directory_LHCb-PAPER-2016-063/supplementary/hidef_Fig5a.png)
![HiDef png [328 KiB]](Directory_LHCb-PAPER-2016-063/supplementary/hidef_Fig5b.png)
![HiDef png [220 KiB]](Directory_LHCb-PAPER-2016-063/supplementary/hidef_Fig6a.png)
![HiDef png [150 KiB]](Directory_LHCb-PAPER-2016-063/supplementary/hidef_Fig6b.png)
![HiDef png [265 KiB]](Directory_LHCb-PAPER-2016-063/supplementary/hidef_Fig6c.png)
![HiDef png [153 KiB]](Directory_LHCb-PAPER-2016-063/supplementary/hidef_Fig6d.png)
![HiDef png [281 KiB]](Directory_LHCb-PAPER-2016-063/supplementary/hidef_Fig7a.png)
![HiDef png [175 KiB]](Directory_LHCb-PAPER-2016-063/supplementary/hidef_Fig7b.png)
![HiDef png [297 KiB]](Directory_LHCb-PAPER-2016-063/supplementary/hidef_Fig7c.png)
![HiDef png [173 KiB]](Directory_LHCb-PAPER-2016-063/supplementary/hidef_Fig7d.png)
![HiDef png [265 KiB]](Directory_LHCb-PAPER-2016-063/supplementary/hidef_Fig8a.png)
![HiDef png [171 KiB]](Directory_LHCb-PAPER-2016-063/supplementary/hidef_Fig8b.png)
![HiDef png [275 KiB]](Directory_LHCb-PAPER-2016-063/supplementary/hidef_Fig8c.png)
![HiDef png [171 KiB]](Directory_LHCb-PAPER-2016-063/supplementary/hidef_Fig8d.png)
![HiDef png [287 KiB]](Directory_LHCb-PAPER-2016-063/supplementary/hidef_Fig9a.png)
![HiDef png [171 KiB]](Directory_LHCb-PAPER-2016-063/supplementary/hidef_Fig9b.png)
Created on 27 April 2024.