Information
LHCb-PAPER-2017-006
CERN-EP-2017-064
arXiv:1704.07581 [PDF]
(Submitted on 25 Apr 2017)
Phys. Rev. D96 (2017) 011101
Inspire 1594907
Tools
Abstract
The $B^+ \to D^{*-}K^+\pi^+$ decay potentially provides an excellent way to investigate charm meson spectroscopy. The decay is searched for in a sample of proton-proton collision data collected with the LHCb detector at centre-of-mass energies of 7 and 8 TeV, corresponding to an integrated luminosity of $3 {\rm fb}^{-1}$. A clear signal is observed, and the ratio of its branching fraction to that of the $B^+ \to D^{*-}\pi^+\pi^+$ normalisation channel is measured to be \begin{equation*} \frac{\mathcal{B}(B^+ \to D^{*-}K^+\pi^+)}{\mathcal{B}(B^+ \to D^{*-}\pi^+\pi^+)} = \left( 6.39 \pm 0.27 \pm 0.48 \right) \times 10^{-2} , \end{equation*} where the first uncertainty is statistical and the second is systematic. This is the first observation of the $B^+ \to D^{*-}K^+\pi^+$ decay.
Figures and captions
|
Leading diagram for $ B ^+ \rightarrow D ^{*-} K ^+ \pi ^+ $ and $ D ^{*-} \pi ^+ \pi ^+ $ decays, where the $ D ^{*-} \pi ^+ $ system is produced through the decay of an excited charm state denoted $\overline{ D }{} {}^{**0}$. |
BToDhh.pdf [34 KiB] HiDef png [30 KiB] Thumbnail [15 KiB] *.C file |

|
|
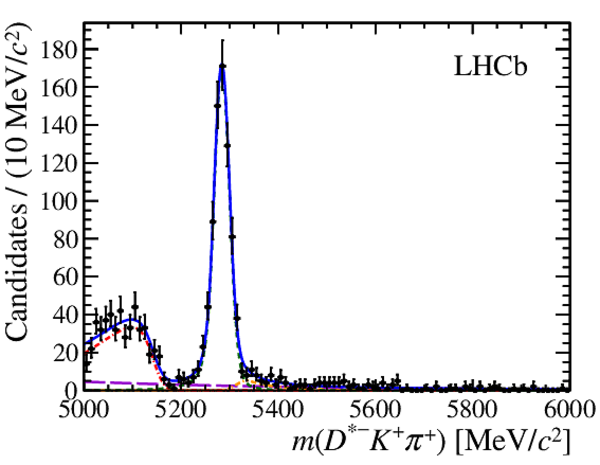
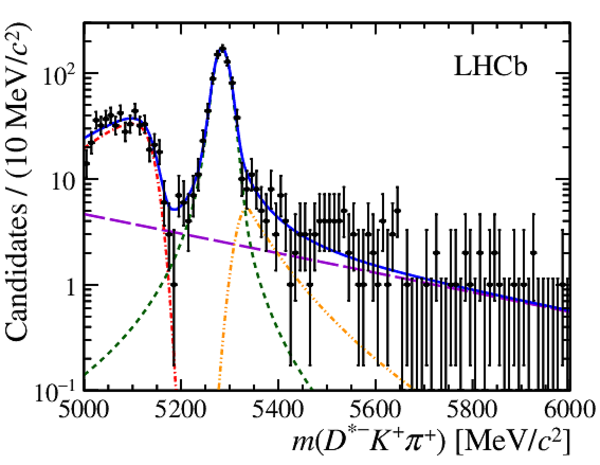
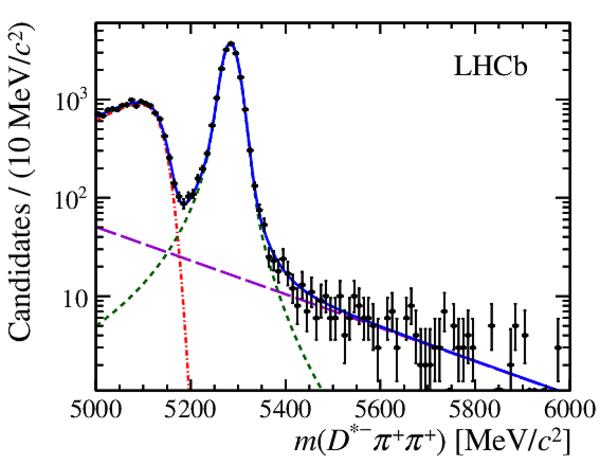
Fits to $ B $ candidate mass distributions for (left) $ D ^{*-} K ^+ \pi ^+ $ and (right) $ D ^{*-} \pi ^+ \pi ^+ $ samples with (top) linear and (bottom) logarithmic $y$-axis scales. The individual components are (solid blue) total fit function, (dashed green) signal shape, (long-dashed violet) combinatorial background, (dot dashed red) partially reconstructed background and (double-dot dashed orange) $ D ^{*-} \pi ^+ \pi ^+ $ to $ D ^{*-} K ^+ \pi ^+ $ cross-feed. |
DstKpi[..].pdf [34 KiB] HiDef png [255 KiB] Thumbnail [204 KiB] *.C file |
|
|
Dstpip[..].pdf [34 KiB] HiDef png [229 KiB] Thumbnail [190 KiB] *.C file |

|
|
|
DstKpi[..].pdf [32 KiB] HiDef png [311 KiB] Thumbnail [241 KiB] *.C file |
|
|
|
Dstpip[..].pdf [32 KiB] HiDef png [254 KiB] Thumbnail [203 KiB] *.C file |
|
|
|
Background-subtracted [38] and efficiency-corrected $m( D ^{*-} \pi ^+ )$ distribution from $ B ^+ \rightarrow D ^{*-} K ^+ \pi ^+ $ decays. The grey dashed line illustrates a phase-space distribution, normalised to the same number of weighted candidates. |
DstKpi[..].pdf [19 KiB] HiDef png [154 KiB] Thumbnail [84 KiB] *.C file |

|
|
Animated gif made out of all figures. |
PAPER-2017-006.gif Thumbnail |

|
![HiDef png [30 KiB]](Directory_LHCb-PAPER-2017-006/hidef_BToDhh.png)
![HiDef png [255 KiB]](Directory_LHCb-PAPER-2017-006/hidef_DstKpi_SigFit.png)
![HiDef png [229 KiB]](Directory_LHCb-PAPER-2017-006/hidef_Dstpipi_SigFit.png)
![HiDef png [311 KiB]](Directory_LHCb-PAPER-2017-006/hidef_DstKpi_SigFit_Log.png)
![HiDef png [254 KiB]](Directory_LHCb-PAPER-2017-006/hidef_Dstpipi_SigFit_Log.png)
![HiDef png [154 KiB]](Directory_LHCb-PAPER-2017-006/hidef_DstKpi_1D_SW_Eff.png)
Tables and captions
|
Systematic uncertainties on the ratio of branching fractions. |
Table_1.pdf [24 KiB] HiDef png [68 KiB] Thumbnail [31 KiB] tex code |

|
![HiDef png [68 KiB]](Directory_LHCb-PAPER-2017-006/hidef_Table_1.png)
Created on 02 May 2024.