Test of lepton universality with $B^{0} \rightarrow K^{*0}\ell^{+}\ell^{-}$ decays
[to restricted-access page]Information
LHCb-PAPER-2017-013
CERN-EP-2017-100
arXiv:1705.05802 [PDF]
(Submitted on 16 May 2017)
JHEP 08 (2017) 055
Inspire 1599846
Tools
Abstract
A test of lepton universality, performed by measuring the ratio of the branching fractions of the $B^{0} \rightarrow K^{*0}\mu^{+}\mu^{-}$ and $B^{0} \rightarrow K^{*0}e^{+}e^{-}$ decays, $R_{K^{*0}}$, is presented. The $K^{*0}$ meson is reconstructed in the final state $K^{+}\pi^{-}$, which is required to have an invariant mass within 100$\mathrm{ MeV}c^2$ of the known $K^{*}(892)^{0}$ mass. The analysis is performed using proton-proton collision data, corresponding to an integrated luminosity of about 3$\mathrm{ fb}^{-1}$, collected by the LHCb experiment at centre-of-mass energies of 7 and 8$\mathrm{ TeV}$. The ratio is measured in two regions of the dilepton invariant mass squared, $q^{2}$, to be \begin{eqnarray*} R_{K^{*0}} = \begin{cases} 0.66 ^{+ 0.11}_{- 0.07}\mathrm{ (stat)} \pm 0.03\mathrm{ (syst)} & \textrm{for } 0.045 < q^{2} < 1.1 \mathrm{ GeV^2}c^4 , \\ 0.69 ^{+ 0.11}_{- 0.07}\mathrm{ (stat)} \pm 0.05\mathrm{ (syst)} & \textrm{for } 1.1\phantom{00} < q^{2} < 6.0 \mathrm{ GeV^2}c^4 . \end{cases} \end{eqnarray*} The corresponding 95.4% confidence level intervals are $[0.52, 0.89]$ and $[0.53, 0.94]$. The results, which represent the most precise measurements of $R_{K^{*0}}$ to date, are compatible with the Standard Model expectations at the level of 2.1--2.3 and 2.4--2.5 standard deviations in the two $q^{2}$ regions, respectively.
Figures and captions
|
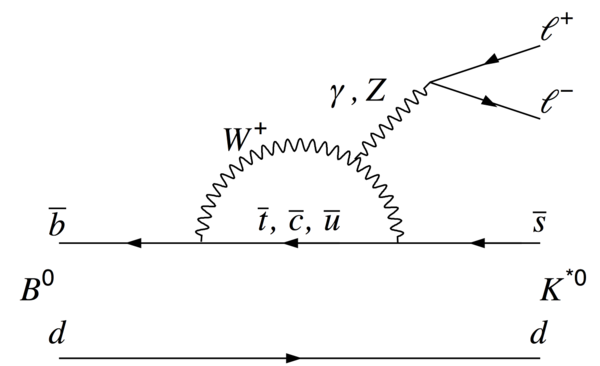
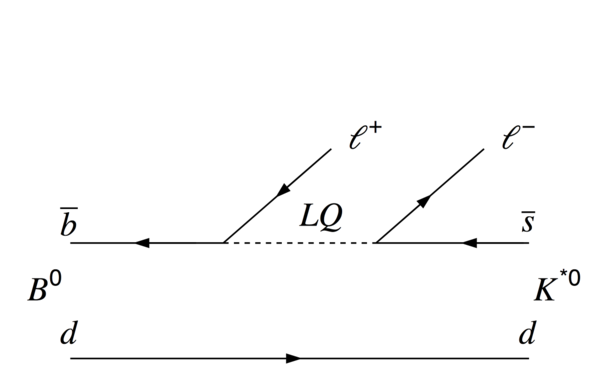
Feynman diagrams in the SM of the $ B ^0 \rightarrow K ^{*0} \ell^+ \ell^- $ decay for the (top left) electroweak penguin and (top right) box diagram. Possible NP contributions violating LU: (bottom left) a tree-level diagram mediated by a new gauge boson $ Z ^{\prime}$ and (bottom right) a tree-level diagram involving a leptoquark $LQ$. |
Fig1a.pdf [152 KiB] HiDef png [118 KiB] Thumbnail [70 KiB] *.C file |
|
|
Fig1b.pdf [130 KiB] HiDef png [111 KiB] Thumbnail [62 KiB] *.C file |

|
|
|
Fig1c.pdf [117 KiB] HiDef png [82 KiB] Thumbnail [46 KiB] *.C file |

|
|
|
Fig1d.pdf [120 KiB] HiDef png [74 KiB] Thumbnail [41 KiB] *.C file |
|
|
|
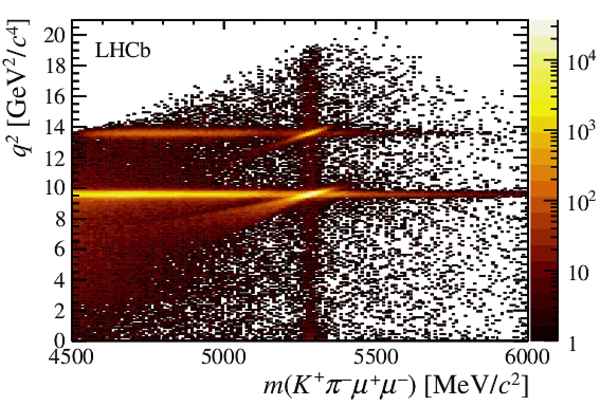
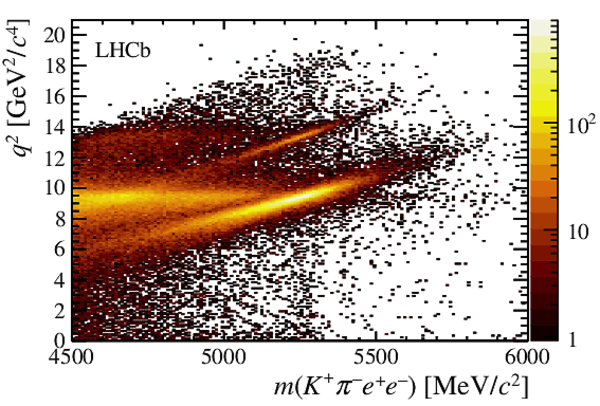
Number of candidates for $ B ^0 \rightarrow K ^{*0} \ell^+ \ell^- $ final states with (left) muons and (right) electrons as a function of the dilepton invariant mass squared, $ q^2$ , and the four-body invariant mass of the $ B ^0$ . |
Fig2a.pdf [82 KiB] HiDef png [1 MiB] Thumbnail [723 KiB] *.C file |
|
|
Fig2b.pdf [71 KiB] HiDef png [1 MiB] Thumbnail [616 KiB] *.C file |
|
|
|
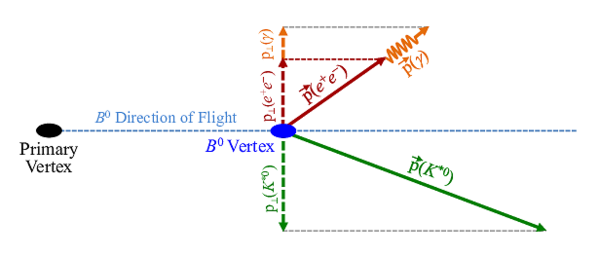
Sketch of the topology of a $ B ^0 \rightarrow K ^{*0} e ^+ e ^- $ decay. The transverse momentum lost via bremsstrahlung is evaluated as the difference between the $p_{\rm T}$ of the $ K ^{*0}$ meson and that of the dielectron system, where both are calculated with respect to the $ B ^0$ meson direction of flight. Bremsstrahlung photons that are not recovered by the reconstruction are assumed to follow the dielectron momentum direction. |
Fig3.pdf [51 KiB] HiDef png [168 KiB] Thumbnail [91 KiB] *.C file |
|
|
Fig4a.pdf [37 KiB] HiDef png [744 KiB] Thumbnail [523 KiB] *.C file |

|
|
|
Fig4b.pdf [33 KiB] HiDef png [663 KiB] Thumbnail [481 KiB] *.C file |

|
|
|
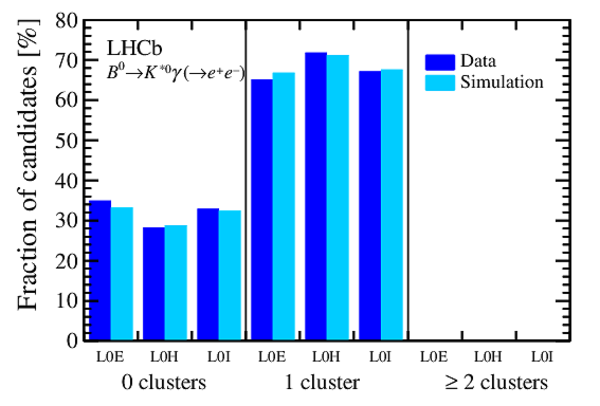
Fraction of (left) $ B ^0 \rightarrow K ^{*0} { J \mskip -3mu/\mskip -2mu\psi \mskip 2mu} (\rightarrow e ^+ e ^- )$ and (right) $ B ^0 \rightarrow K ^{*0} \gamma(\rightarrow e ^+ e ^- )$ candidates (in percent) with zero, one, and two or more recovered clusters per trigger category. The numbers are from (darker colour) data and (lighter colour) simulation. Due to the very low opening angle of the two electrons in $ B ^0 \rightarrow K ^{*0} \gamma(\rightarrow e ^+ e ^- )$ decays, the bremsstrahlung photon energy deposits overlap and only one bremsstrahlung cluster at most is resolved. |
Fig5a.pdf [13 KiB] HiDef png [143 KiB] Thumbnail [129 KiB] *.C file |

|
|
Fig5b.pdf [13 KiB] HiDef png [142 KiB] Thumbnail [131 KiB] *.C file |
|
|
|
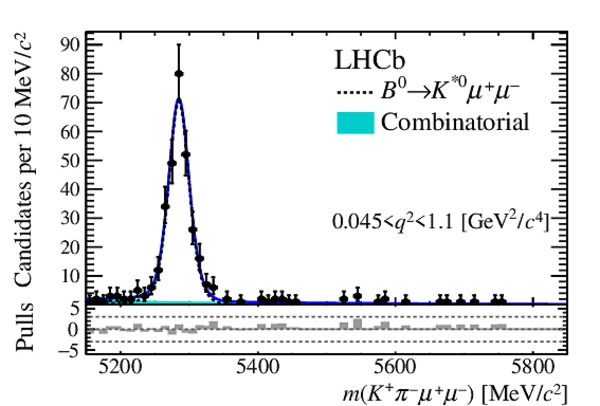
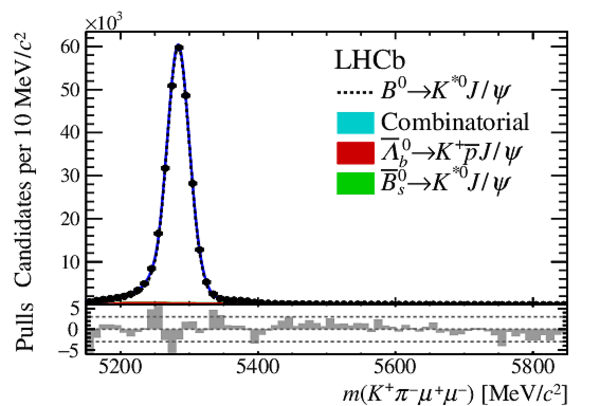
Fit to the $ m( K ^+ \pi ^- \mu ^+\mu ^- )$ invariant mass of (top) $ B ^0 \rightarrow K ^{*0} \mu ^+\mu ^- $ in the low- and central- $ q^2$ bins and (bottom) $ B ^0 \rightarrow K ^{*0} { J \mskip -3mu/\mskip -2mu\psi \mskip 2mu} ( \rightarrow \mu ^+\mu ^- )$ candidates. The dashed line is the signal PDF, the shaded shapes are the background PDFs and the solid line is the total PDF. The fit residuals normalised to the data uncertainty are shown at the bottom of each distribution. |
Fig6a.pdf [21 KiB] HiDef png [229 KiB] Thumbnail [224 KiB] *.C file |
|
|
Fig6b.pdf [21 KiB] HiDef png [244 KiB] Thumbnail [230 KiB] *.C file |

|
|
|
Fig6c.pdf [31 KiB] HiDef png [227 KiB] Thumbnail [222 KiB] *.C file |
|
|
|
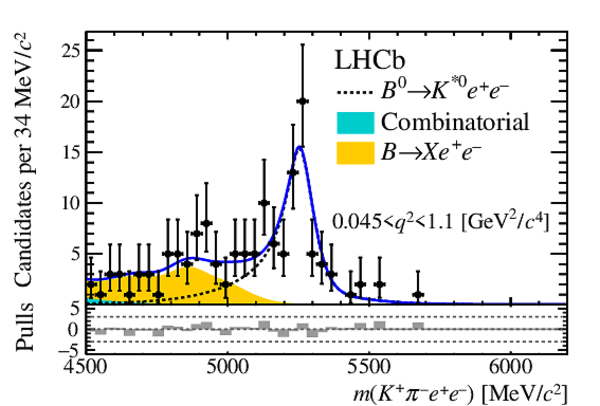
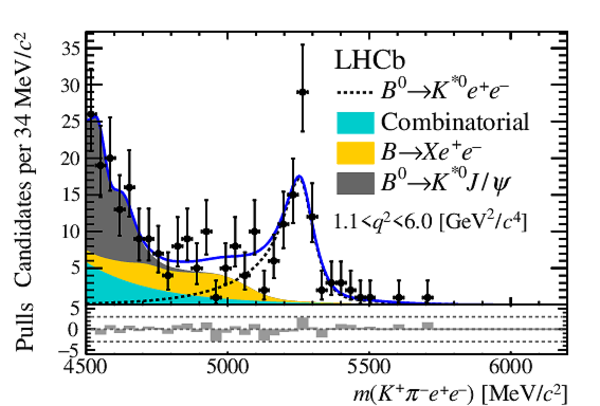
Fit to the $ m( K ^+ \pi ^- e ^+ e ^- )$ invariant mass of (top) $ B ^0 \rightarrow K ^{*0} e ^+ e ^- $ in the low- and central- $ q^2$ bins and (bottom) $ B ^0 \rightarrow K ^{*0} { J \mskip -3mu/\mskip -2mu\psi \mskip 2mu} (\rightarrow e ^+ e ^- )$ candidates. The dashed line is the signal PDF, the shaded shapes are the background PDFs and the solid line is the total PDF. The fit residuals normalised to the data uncertainty are shown at the bottom of each distribution. |
Fig7a.pdf [27 KiB] HiDef png [247 KiB] Thumbnail [228 KiB] *.C file |
|
|
Fig7b.pdf [30 KiB] HiDef png [283 KiB] Thumbnail [261 KiB] *.C file |
|
|
|
Fig7c.pdf [34 KiB] HiDef png [260 KiB] Thumbnail [242 KiB] *.C file |

|
|
|
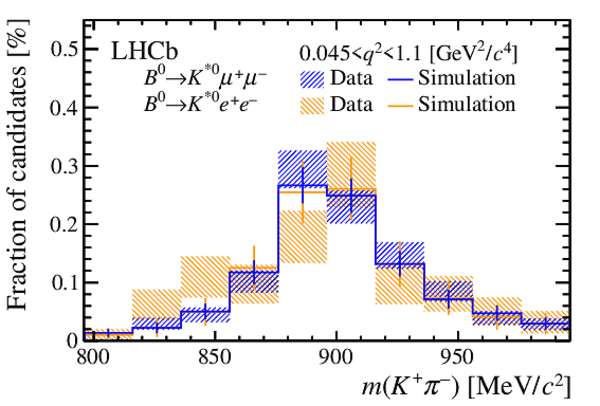
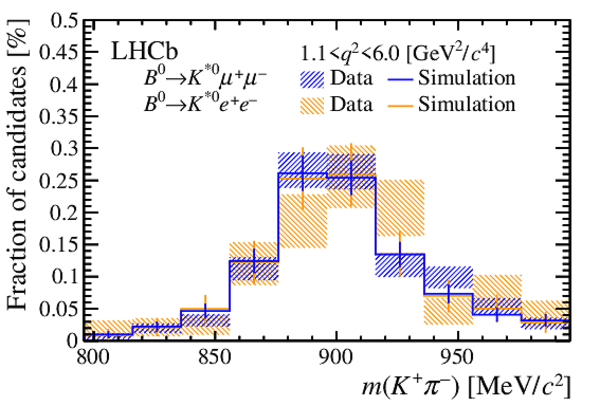
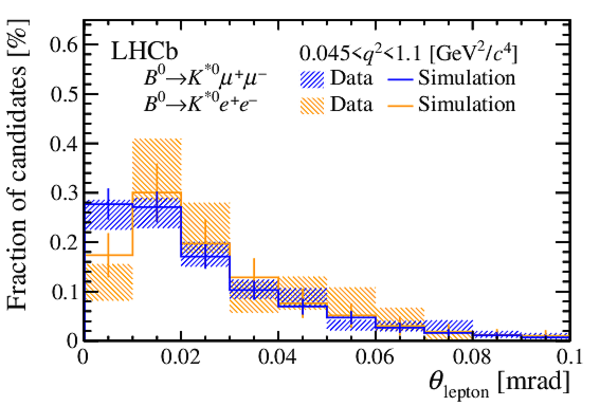
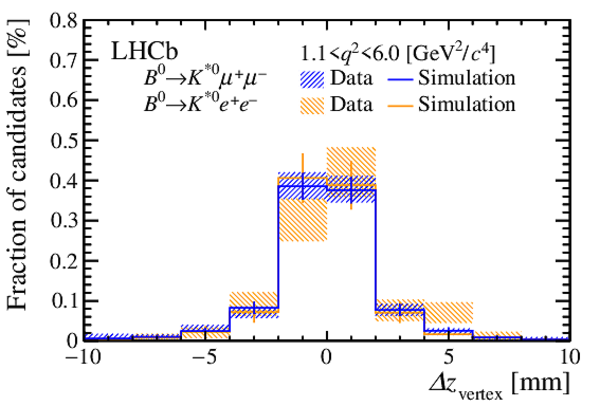
(hatched) Background-subtracted distributions for (darker colour) $ B ^0 \rightarrow K ^{*0} \mu ^+\mu ^- $ and (lighter colour) $ B ^0 \rightarrow K ^{*0} e ^+ e ^- $ candidates, compared to (full line) simulation. From top to bottom: $ q^2$ , $ K ^+ \pi ^- $ invariant mass, $ m( K ^+ \pi ^- )$ , opening angle between the two leptons, $\theta_{\textrm{lepton}}$, and projection along the beam axis of the distance between the $ K ^+ \pi ^- $ and $\ell^+ \ell^- $ vertices, $\Delta z_{\textrm{vertex}}$. The distributions are normalised to unity. The hatched areas correspond to the statistical uncertainties only. The data are not efficiency corrected. |
Fig8a.pdf [17 KiB] HiDef png [452 KiB] Thumbnail [269 KiB] *.C file |

|
|
Fig8b.pdf [18 KiB] HiDef png [557 KiB] Thumbnail [331 KiB] *.C file |

|
|
|
Fig8c.pdf [18 KiB] HiDef png [461 KiB] Thumbnail [287 KiB] *.C file |
|
|
|
Fig8d.pdf [18 KiB] HiDef png [474 KiB] Thumbnail [304 KiB] *.C file |
|
|
|
Fig8e.pdf [17 KiB] HiDef png [408 KiB] Thumbnail [263 KiB] *.C file |
|
|
|
Fig8f.pdf [18 KiB] HiDef png [470 KiB] Thumbnail [296 KiB] *.C file |

|
|
|
Fig8g.pdf [17 KiB] HiDef png [367 KiB] Thumbnail [244 KiB] *.C file |

|
|
|
Fig8h.pdf [17 KiB] HiDef png [314 KiB] Thumbnail [222 KiB] *.C file |
|
|
|
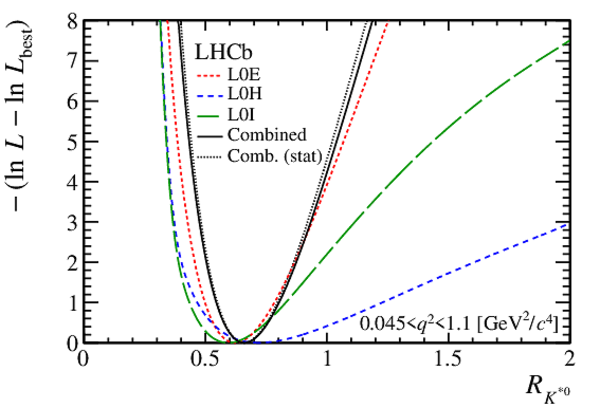
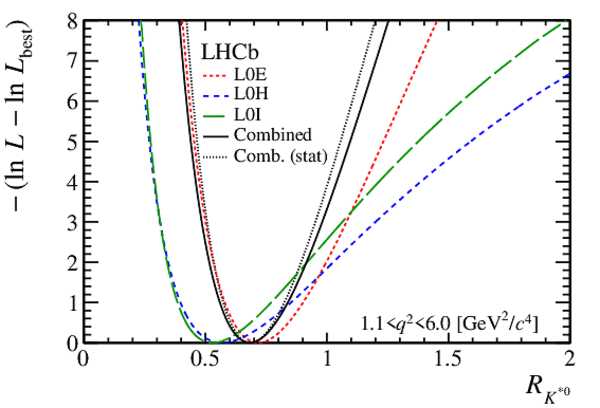
Distributions of the $ R_{ K ^{*0} }$ delta log-likelihood for the three trigger categories separately and combined. |
Fig9a.pdf [24 KiB] HiDef png [225 KiB] Thumbnail [185 KiB] *.C file |
|
|
Fig9b.pdf [24 KiB] HiDef png [235 KiB] Thumbnail [192 KiB] *.C file |
|
|
|
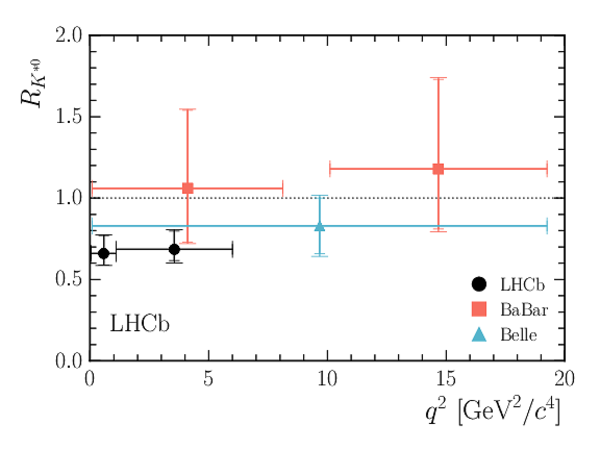
(left) Comparison of the LHCb $ R_{ K ^{*0} }$ measurements with the SM theoretical predictions: BIP [26] CDHMV [27,28,29], \texttt{EOS} [30,31], \texttt{flav.io} [33,34,35] and JC [36]. The predictions are displaced horizontally for presentation. (right) Comparison of the LHCb $ R_{ K ^{*0} }$ measurements with previous experimental results from the $ B $ factories [4,5]. In the case of the $ B $ factories the specific vetoes for charmonium resonances are not represented. |
Fig10a.pdf [176 KiB] HiDef png [104 KiB] Thumbnail [107 KiB] *.C file |

|
|
Fig10b.pdf [129 KiB] HiDef png [88 KiB] Thumbnail [89 KiB] *.C file |
|
|
|
Animated gif made out of all figures. |
PAPER-2017-013.gif Thumbnail |

|
![HiDef png [118 KiB]](Directory_LHCb-PAPER-2017-013/hidef_Fig1a.png)
![HiDef png [111 KiB]](Directory_LHCb-PAPER-2017-013/hidef_Fig1b.png)
![HiDef png [82 KiB]](Directory_LHCb-PAPER-2017-013/hidef_Fig1c.png)
![HiDef png [74 KiB]](Directory_LHCb-PAPER-2017-013/hidef_Fig1d.png)
![HiDef png [1 MiB]](Directory_LHCb-PAPER-2017-013/hidef_Fig2a.png)
![HiDef png [1 MiB]](Directory_LHCb-PAPER-2017-013/hidef_Fig2b.png)
![HiDef png [168 KiB]](Directory_LHCb-PAPER-2017-013/hidef_Fig3.png)
![HiDef png [744 KiB]](Directory_LHCb-PAPER-2017-013/hidef_Fig4a.png)
![HiDef png [663 KiB]](Directory_LHCb-PAPER-2017-013/hidef_Fig4b.png)
![HiDef png [143 KiB]](Directory_LHCb-PAPER-2017-013/hidef_Fig5a.png)
![HiDef png [142 KiB]](Directory_LHCb-PAPER-2017-013/hidef_Fig5b.png)
![HiDef png [229 KiB]](Directory_LHCb-PAPER-2017-013/hidef_Fig6a.png)
![HiDef png [244 KiB]](Directory_LHCb-PAPER-2017-013/hidef_Fig6b.png)
![HiDef png [227 KiB]](Directory_LHCb-PAPER-2017-013/hidef_Fig6c.png)
![HiDef png [247 KiB]](Directory_LHCb-PAPER-2017-013/hidef_Fig7a.png)
![HiDef png [283 KiB]](Directory_LHCb-PAPER-2017-013/hidef_Fig7b.png)
![HiDef png [260 KiB]](Directory_LHCb-PAPER-2017-013/hidef_Fig7c.png)
![HiDef png [452 KiB]](Directory_LHCb-PAPER-2017-013/hidef_Fig8a.png)
![HiDef png [557 KiB]](Directory_LHCb-PAPER-2017-013/hidef_Fig8b.png)
![HiDef png [461 KiB]](Directory_LHCb-PAPER-2017-013/hidef_Fig8c.png)
![HiDef png [474 KiB]](Directory_LHCb-PAPER-2017-013/hidef_Fig8d.png)
![HiDef png [408 KiB]](Directory_LHCb-PAPER-2017-013/hidef_Fig8e.png)
![HiDef png [470 KiB]](Directory_LHCb-PAPER-2017-013/hidef_Fig8f.png)
![HiDef png [367 KiB]](Directory_LHCb-PAPER-2017-013/hidef_Fig8g.png)
![HiDef png [314 KiB]](Directory_LHCb-PAPER-2017-013/hidef_Fig8h.png)
![HiDef png [225 KiB]](Directory_LHCb-PAPER-2017-013/hidef_Fig9a.png)
![HiDef png [235 KiB]](Directory_LHCb-PAPER-2017-013/hidef_Fig9b.png)
![HiDef png [104 KiB]](Directory_LHCb-PAPER-2017-013/hidef_Fig10a.png)
![HiDef png [88 KiB]](Directory_LHCb-PAPER-2017-013/hidef_Fig10b.png)
Tables and captions
|
Recent SM predictions for $ R_{ K ^{*0} }$ . |
Table_1.pdf [85 KiB] HiDef png [101 KiB] Thumbnail [50 KiB] tex code |

|
|
Yields obtained from the mass fits to the muon and electron (in the three trigger categories) channels. The uncertainties are statistical only. |
Table_2.pdf [47 KiB] HiDef png [51 KiB] Thumbnail [26 KiB] tex code |

|
|
Efficiency ratios between the nonresonant and resonant modes, $\varepsilon_{\ell^+ \ell^- } / \varepsilon_{ { J \mskip -3mu/\mskip -2mu\psi \mskip 2mu} (\ell^+ \ell^- ) }$, for the muon and electron (in the three trigger categories) channels. The uncertainties are statistical only. |
Table_3.pdf [66 KiB] HiDef png [81 KiB] Thumbnail [40 KiB] tex code |

|
|
Systematic uncertainties on the $ R_{ K ^{*0} }$ ratio for the three trigger categories separately (in percent). The total uncertainty is the sum in quadrature of all the contributions. |
Table_4.pdf [56 KiB] HiDef png [92 KiB] Thumbnail [45 KiB] tex code |

|
|
Measured $ R_{ K ^{*0} }$ ratios in the two $ q^2$ regions. The first uncertainties are statistical and the second are systematic. About 50% of the systematic uncertainty is correlated between the two $ q^2$ bins. The 95.4% and 99.7% confidence level (CL) intervals include both the statistical and systematic uncertainties. |
Table_5.pdf [65 KiB] HiDef png [49 KiB] Thumbnail [21 KiB] tex code |

|
![HiDef png [101 KiB]](Directory_LHCb-PAPER-2017-013/hidef_Table_1.png)
![HiDef png [51 KiB]](Directory_LHCb-PAPER-2017-013/hidef_Table_2.png)
![HiDef png [81 KiB]](Directory_LHCb-PAPER-2017-013/hidef_Table_3.png)
![HiDef png [92 KiB]](Directory_LHCb-PAPER-2017-013/hidef_Table_4.png)
![HiDef png [49 KiB]](Directory_LHCb-PAPER-2017-013/hidef_Table_5.png)
Created on 27 April 2024.