Measurement of the shape of the $\Lambda_b^0\to\Lambda_c^+ \mu^- \overline{\nu}_{\mu}$ differential decay rate
[to restricted-access page]Information
LHCb-PAPER-2017-016
CERN-EP-2017-164
arXiv:1709.01920 [PDF]
(Submitted on 06 Sep 2017)
Phys. Rev. D96 (2017) 112005
Inspire 1621811
Tools
Abstract
A measurement of the shape of the differential decay rate and the associated Isgur-Wise function for the decay $\Lambda_b^0\to\Lambda_c^+\mu^-\overline{\nu}$ is reported, using data corresponding to $3 fb^{-1}$ collected with the LHCb detector in proton-proton collisions. The $\Lambda_c^+\mu^-\overline{\nu}$(+ anything) final states are reconstructed through the detection of a muon and a $\Lambda_c^+$ baryon decaying into $pK^-\pi^+$, and the decays $\Lambda_b^0\to\Lambda_c^+\pi^+\pi^-\mu^-\overline{\nu}$ are used to determine contributions from $\Lambda_b^0\to \Lambda_c^{\star+}\mu ^-\bar{\nu}$ decays. The measured dependence of the differential decay rate upon the squared four-momentum transfer between the heavy baryons, $q^2$, is compared with expectations from heavy-quark effective theory and from unquenched lattice QCD predictions.
Figures and captions
|
(a) The ln(IP/mm) distribution and (b) $p K ^- \pi ^+ $ invariant mass for $\Lambda ^+_ c $ candidate combinations with a muon. The red (dashed-dotted) curves show the combinatorial $\Lambda ^+_ c $ background, the green (dashed) curves the $\Lambda ^+_ c $ from $\Lambda ^0_ b $ and the blue-solid curves the total yields. |
Fig1a.pdf [20 KiB] HiDef png [197 KiB] Thumbnail [162 KiB] *.C file |

|
|
Fig1b.pdf [21 KiB] HiDef png [213 KiB] Thumbnail [166 KiB] *.C file |

|
|
|
The mass difference $m(p K ^- \pi ^+ \pi ^+ \pi ^- )-m(p K ^- \pi ^+ )$ added to the known $\Lambda ^+_ c $ mass, $m_{\rm PDG}(\Lambda ^+_ c )$ [14], for candidates with $p K ^- \pi ^+ $ invariant mass within $\pm$20 MeV of the known $\Lambda ^+_ c $ mass in candidate semileptonic decays for the entire $w$ range: data are shown as black dots, the combinatoric background is shown as a blue solid line, and the gray histogram shows the WS spectrum, obtained by combining a $\pi ^+ \pi ^+ $ or $\pi ^- \pi ^- $ pair with $\Lambda ^+_ c $ instead of $\pi ^+ \pi ^- $. The signal fits are identified as follows: (a) for $m<2700$ MeV, the $\Lambda_ c (2595)^+ $ as magenta dashed line, and the $\Lambda_ c (2625)^+ $ as green long-dashed line, (b) for $m>2700$ MeV, the $\Lambda_ c (2765)^+ $ as magenta dashed line, and the $\Lambda_ c (2880)^+ $ as green long-dashed line. |
Fig2a.pdf [22 KiB] HiDef png [249 KiB] Thumbnail [208 KiB] *.C file |

|
|
Fig2b.pdf [20 KiB] HiDef png [211 KiB] Thumbnail [182 KiB] *.C file |

|
|
|
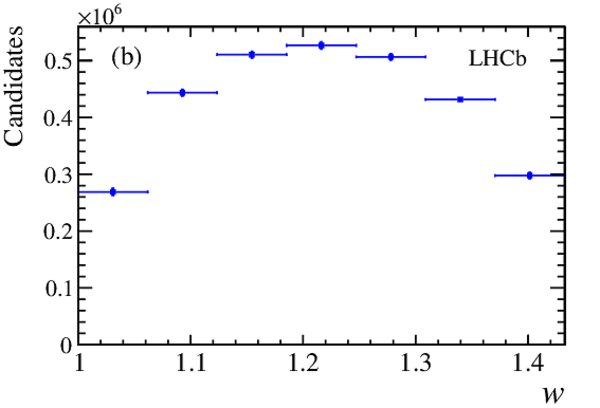
The spectra (a) $dN_{\rm meas}/dw$ before unfolding and (b) $dN_{\rm u}/dw$ after unfolding, for the decay $\Lambda ^0_ b \rightarrow \Lambda ^+_ c \mu ^- \overline{\nu } _\mu $. The latter spectrum is then corrected for acceptance and reconstruction efficiency and fitted to the IW function $\xi_B(w)$ with the procedure discussed in the text. |
Fig3a.pdf [14 KiB] HiDef png [91 KiB] Thumbnail [87 KiB] *.C file |

|
|
Fig3b.pdf [13 KiB] HiDef png [79 KiB] Thumbnail [79 KiB] *.C file |
|
|
|
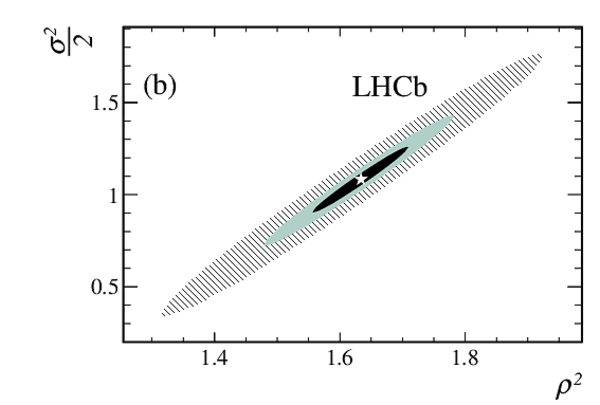
(a) The Isgur-Wise function fit for the decay $\Lambda ^0_ b \rightarrow \Lambda ^+_ c \mu ^- \nu$ with a Taylor series expansion in $(w-1)$ up to second order. The black dots show the data and the solid (blue) line shows the fitted function with the second-order Taylor series expansion model. The vertical scale is in arbitrary units. (b) The correlation between slope $\rho^2$ and curvature $\sigma ^2 /2$: the three ellipses correspond to the 1$\sigma$, 2$\sigma$, and 4$\sigma$ contours. |
Fig4a.pdf [14 KiB] HiDef png [108 KiB] Thumbnail [93 KiB] *.C file |

|
|
Fig4b.pdf [14 KiB] HiDef png [128 KiB] Thumbnail [122 KiB] *.C file |
|
|
|
Comparison between the fit to the seven experimental data points using either the Lattice QCD calculation of Ref. [19], shown as grey points with a shaded area corresponding to the binned 1$\sigma$ theory uncertainty, or a single form factor fit in the $z$-expansion, shown as the solid blue curve. The data points, modulo a scale factor, are shown as black points with error bars. |
Fig5.pdf [16 KiB] HiDef png [135 KiB] Thumbnail [125 KiB] *.C file |

|
|
Animated gif made out of all figures. |
PAPER-2017-016.gif Thumbnail |

|
![HiDef png [197 KiB]](Directory_LHCb-PAPER-2017-016/hidef_Fig1a.png)
![HiDef png [213 KiB]](Directory_LHCb-PAPER-2017-016/hidef_Fig1b.png)
![HiDef png [249 KiB]](Directory_LHCb-PAPER-2017-016/hidef_Fig2a.png)
![HiDef png [211 KiB]](Directory_LHCb-PAPER-2017-016/hidef_Fig2b.png)
![HiDef png [91 KiB]](Directory_LHCb-PAPER-2017-016/hidef_Fig3a.png)
![HiDef png [79 KiB]](Directory_LHCb-PAPER-2017-016/hidef_Fig3b.png)
![HiDef png [108 KiB]](Directory_LHCb-PAPER-2017-016/hidef_Fig4a.png)
![HiDef png [128 KiB]](Directory_LHCb-PAPER-2017-016/hidef_Fig4b.png)
![HiDef png [135 KiB]](Directory_LHCb-PAPER-2017-016/hidef_Fig5.png)
Tables and captions
|
Predictions for the slope at zero recoil of the baryonic Isgur-Wise function $\xi _B$. The evaluation from Ref. [21] includes first-order corrections in HQET. |
Table_1.pdf [67 KiB] HiDef png [40 KiB] Thumbnail [19 KiB] tex code |

|
|
Measured raw yields for the four $\Lambda_ c ^{\ast +} \mu ^- \overline{\nu } _\mu $ final states and the inclusive $\Lambda ^+_ c \mu ^- \overline{\nu } _\mu X$. |
Table_2.pdf [64 KiB] HiDef png [102 KiB] Thumbnail [44 KiB] tex code |

|
|
Summary of the values for the slope and curvature of the Isgur-Wise function with different parameterizations. The quoted uncertainties are statistical only. The models marked with "*" have only the slope at zero recoil as a free parameter, thus the curvature is derived from the fitted $\rho^2$. |
Table_3.pdf [52 KiB] HiDef png [37 KiB] Thumbnail [17 KiB] tex code |

|
|
Summary of the systematic uncertainties on the slope parameter $\rho^2$. The total uncertainty is obtained by adding the individual components in quadrature. |
Table_4.pdf [70 KiB] HiDef png [94 KiB] Thumbnail [39 KiB] tex code |

|
|
Masses of the relevant form factor poles in the physical limit (in GeV). |
Table_5.pdf [65 KiB] HiDef png [32 KiB] Thumbnail [15 KiB] tex code |

|
|
Measured normalized yields $dN_{\rm corr}(\Lambda ^0_ b \rightarrow \Lambda ^+_ c \mu ^- \overline{\nu } _\mu )/d q^2 $ . |
Table_6.pdf [48 KiB] HiDef png [159 KiB] Thumbnail [53 KiB] tex code |

|
|
Covariance matrix of the measured normalized yields ${\rm Cov}[dN_{\rm corr}(\Lambda ^0_ b \rightarrow \Lambda ^+_ c \mu ^- \overline{\nu } _\mu )/d q^2 $] . |
Table_7.pdf [42 KiB] HiDef png [82 KiB] Thumbnail [35 KiB] tex code |

|
![HiDef png [40 KiB]](Directory_LHCb-PAPER-2017-016/hidef_Table_1.png)
![HiDef png [102 KiB]](Directory_LHCb-PAPER-2017-016/hidef_Table_2.png)
![HiDef png [37 KiB]](Directory_LHCb-PAPER-2017-016/hidef_Table_3.png)
![HiDef png [94 KiB]](Directory_LHCb-PAPER-2017-016/hidef_Table_4.png)
![HiDef png [32 KiB]](Directory_LHCb-PAPER-2017-016/hidef_Table_5.png)
![HiDef png [159 KiB]](Directory_LHCb-PAPER-2017-016/hidef_Table_6.png)
![HiDef png [82 KiB]](Directory_LHCb-PAPER-2017-016/hidef_Table_7.png)
Created on 27 April 2024.