Information
LHCb-PAPER-2017-018
CERN-EP-2017-156
arXiv:1707.01621 [PDF]
(Submitted on 06 Jul 2017)
Phys. Rev. Lett. 119 (2017) 112001
Inspire 1608879
Tools
Abstract
A highly significant structure is observed in the $\Lambda_c^+K^-\pi^+\pi^+$ mass spectrum, where the $\Lambda_c^+$ baryon is reconstructed in the decay mode $pK^-\pi^+$. The structure is consistent with originating from a weakly decaying particle, identified as the doubly charmed baryon $\Xi_{cc}^{++}$. The difference between the masses of the $\Xi_{cc}^{++}$ and $\Lambda_c^+$ states is measured to be $1334.94 \pm 0.72 (\mathrm{stat}) \pm 0.27 (\mathrm{syst} \mathrm{MeV}/c^2$, and the $\Xi_{cc}^{++}$ mass is then determined to be $3621.40 \pm 0.72 (\mathrm{stat}) \pm 0.27 (\mathrm{syst} \pm 0.14 (\Lambda_c^+) \mathrm{MeV}/c^2$, where the last uncertainty is due to the limited knowledge of the $\Lambda_c^+$ mass. The state is observed in a sample of proton-proton collision data collected by the LHCb experiment at a center-of-mass energy of 13 TeV, corresponding to an integrated luminosity of 1.7 $\mathrm{fb}^{-1}$, and confirmed in an additional sample of data collected at 8 TeV.
Figures and captions
|
Example Feynman diagram contributing to the decay $\Xi ^{++}_{ c c } \rightarrow \Lambda ^+_ c K ^- \pi ^+ \pi ^+ $ . |
Fig1.pdf [34 KiB] HiDef png [32 KiB] Thumbnail [18 KiB] *.C file |

|
|
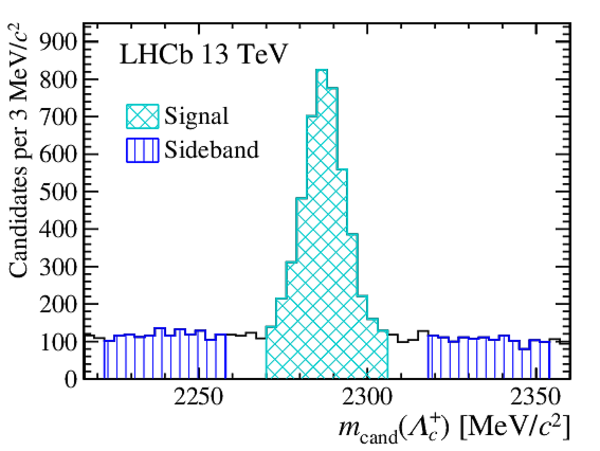
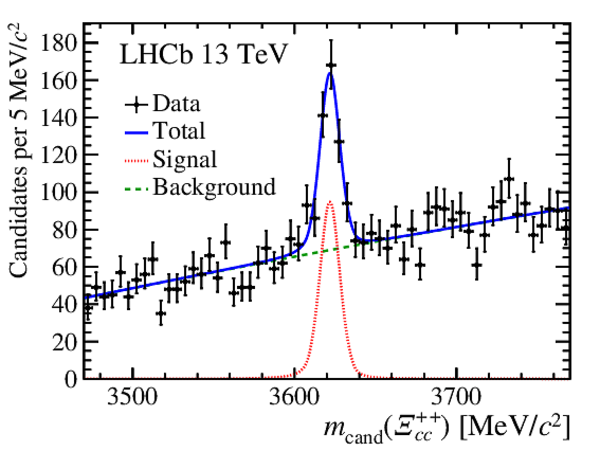
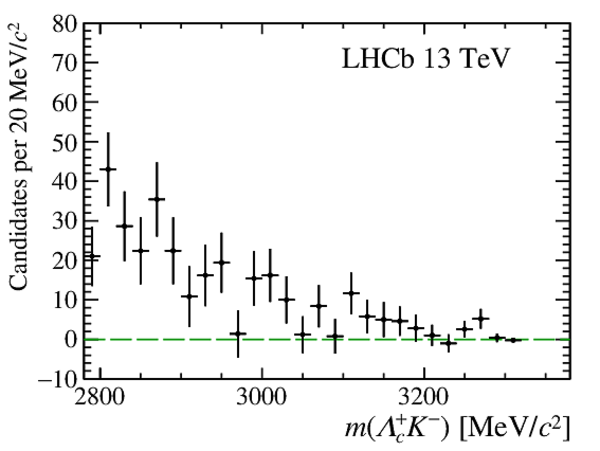
Mass spectra of (left) $\Lambda ^+_ c $ and (right) $\Xi ^{++}_{ c c }$ candidates. The full selection is applied, except for the $\Lambda ^+_ c $ mass requirement in the case of the left plot. For the $\Lambda ^+_ c $ mass distribution the (cross-hatched) signal and (vertical line) sideband regions are indicated; to avoid duplication, the histogram is filled only once in events that contain more than one $\Xi ^{++}_{ c c }$ candidate. In the right plot the right-sign (RS) signal sample $\Xi ^{++}_{ c c } \rightarrow \Lambda ^+_ c K ^- \pi ^+ \pi ^+ $ is shown, along with the control samples: $\Lambda ^+_ c $ sideband (SB) $\Lambda ^+_ c K ^- \pi ^+ \pi ^+ $ candidates and wrong-sign (WS) $\Lambda ^+_ c K ^- \pi ^+ \pi ^- $ candidates, normalized to have the same area as the RS sample in the $ m_{\mathrm{cand}} (\Xi ^{++}_{ c c } )$ sidebands. |
Fig2a.pdf [15 KiB] HiDef png [341 KiB] Thumbnail [253 KiB] *.C file |
|
|
Fig2b.pdf [20 KiB] HiDef png [279 KiB] Thumbnail [227 KiB] *.C file |

|
|
|
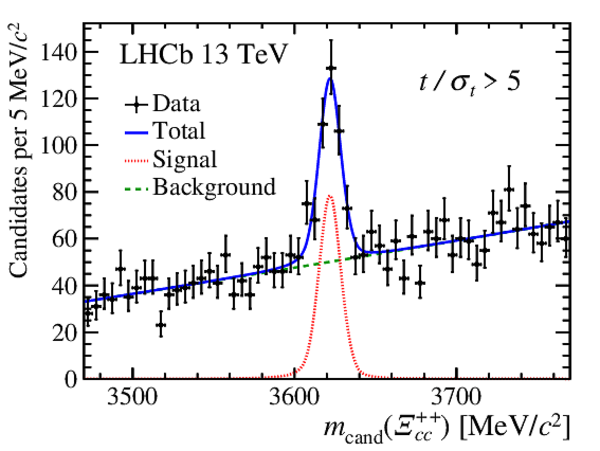
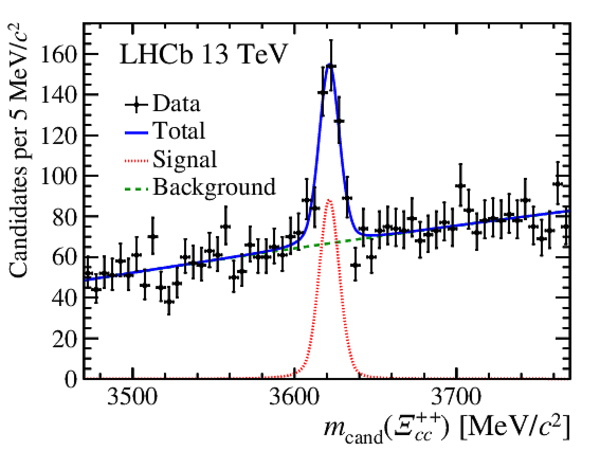
Invariant mass distribution of $\Lambda ^+_ c K ^- \pi ^+ \pi ^+ $ candidates with fit projections overlaid. |
Fig3.pdf [23 KiB] HiDef png [272 KiB] Thumbnail [236 KiB] *.C file |
|
|
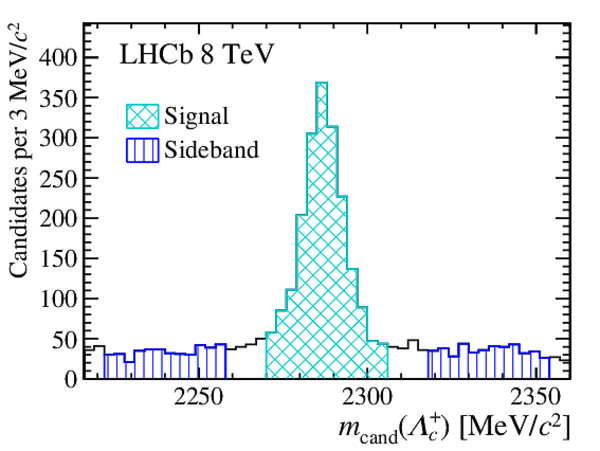
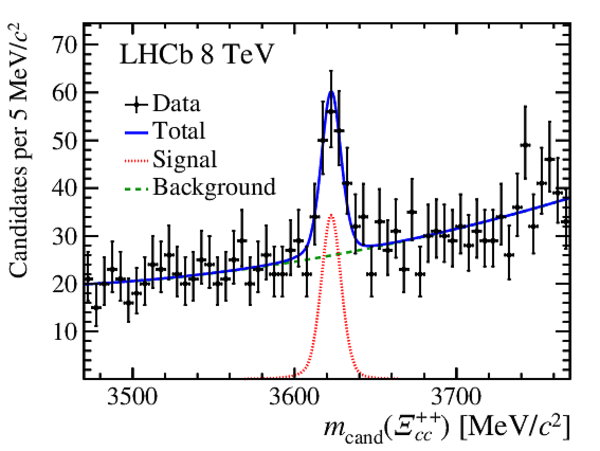
Mass spectra of (left) $\Lambda ^+_ c $ and (right) $\Xi ^{++}_{ c c }$ candidates in the $8\mathrm{ Te V} $ data sample. The full selection is applied, except for the $\Lambda ^+_ c $ mass requirement in the case of the left plot. For the $\Lambda ^+_ c $ mass distribution the (cross-hatched) signal and (vertical lines) sideband regions are indicated; to avoid duplication, the histogram is filled only once in events that contain more than one $\Xi ^{++}_{ c c }$ candidate. In the right plot the right-sign (RS) signal sample $\Xi ^{++}_{ c c } \rightarrow \Lambda ^+_ c K ^- \pi ^+ \pi ^+ $ is shown, along with the control samples: $\Lambda ^+_ c $ sideband (SB) $\Lambda ^+_ c K ^- \pi ^+ \pi ^+ $ candidates and wrong-sign (WS) $\Lambda ^+_ c K ^- \pi ^+ \pi ^- $ candidates, normalized to have the same area as the RS sample in the $ m_{\mathrm{cand}} (\Xi ^{++}_{ c c } )$ sidebands. |
Fig4a.pdf [15 KiB] HiDef png [310 KiB] Thumbnail [236 KiB] *.C file |
|
|
Fig4b.pdf [20 KiB] HiDef png [315 KiB] Thumbnail [250 KiB] *.C file |

|
|
|
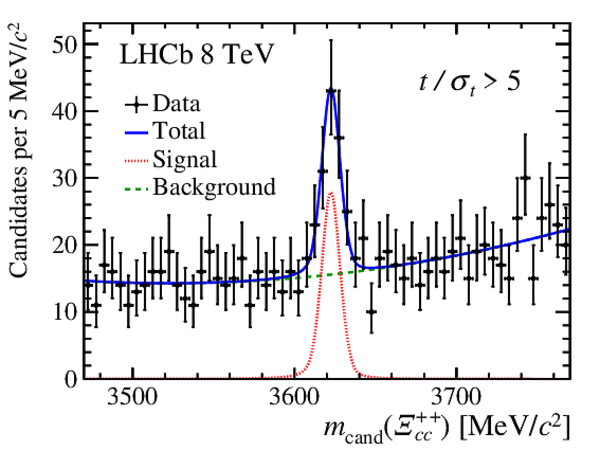
Invariant mass distribution of $\Lambda ^+_ c K ^- \pi ^+ \pi ^+ $ candidates for the 8 TeV data sample with fit projections overlaid. |
Fig5.pdf [22 KiB] HiDef png [253 KiB] Thumbnail [221 KiB] *.C file |
|
|
Animated gif made out of all figures. |
PAPER-2017-018.gif Thumbnail |

|
Tables and captions
|
Systematic uncertainties on the $\Xi ^{++}_{ c c }$ mass measurement. |
Table_1.pdf [53 KiB] HiDef png [80 KiB] Thumbnail [36 KiB] tex code |

|
Supplementary Material [file]


![HiDef png [32 KiB]](Directory_LHCb-PAPER-2017-018/hidef_Fig1.png)
![HiDef png [341 KiB]](Directory_LHCb-PAPER-2017-018/hidef_Fig2a.png)
![HiDef png [279 KiB]](Directory_LHCb-PAPER-2017-018/hidef_Fig2b.png)
![HiDef png [272 KiB]](Directory_LHCb-PAPER-2017-018/hidef_Fig3.png)
![HiDef png [310 KiB]](Directory_LHCb-PAPER-2017-018/hidef_Fig4a.png)
![HiDef png [315 KiB]](Directory_LHCb-PAPER-2017-018/hidef_Fig4b.png)
![HiDef png [253 KiB]](Directory_LHCb-PAPER-2017-018/hidef_Fig5.png)
![HiDef png [80 KiB]](Directory_LHCb-PAPER-2017-018/hidef_Table_1.png)
![HiDef png [360 KiB]](Directory_LHCb-PAPER-2017-018/supplementary/hidef_Fig6.png)
![HiDef png [270 KiB]](Directory_LHCb-PAPER-2017-018/supplementary/hidef_Fig7a.png)
![HiDef png [271 KiB]](Directory_LHCb-PAPER-2017-018/supplementary/hidef_Fig7b.png)
![HiDef png [269 KiB]](Directory_LHCb-PAPER-2017-018/supplementary/hidef_Fig8.png)
![HiDef png [170 KiB]](Directory_LHCb-PAPER-2017-018/supplementary/hidef_Fig9a.png)
![HiDef png [142 KiB]](Directory_LHCb-PAPER-2017-018/supplementary/hidef_Fig9b.png)
![HiDef png [146 KiB]](Directory_LHCb-PAPER-2017-018/supplementary/hidef_Fig9c.png)
![HiDef png [208 KiB]](Directory_LHCb-PAPER-2017-018/supplementary/hidef_Fig9d.png)
![HiDef png [684 KiB]](Directory_LHCb-PAPER-2017-018/supplementary/hidef_LHCb-PAPER-2017-018-supplementary.png)
Created on 27 April 2024.