Measurement of $CP$ observables in $B^\pm \to D^{(*)} K^\pm$ and $B^\pm \to D^{(*)} \pi^\pm$ decays
[to restricted-access page]Information
LHCb-PAPER-2017-021
CERN-EP-2017-195
arXiv:1708.06370 [PDF]
(Submitted on 21 Aug 2017)
Phys. Lett. B777 (2018) 16
Inspire 1618003
Tools
Abstract
Measurements of $CP$ observables in $B^\pm \rightarrow D^{(*)} K^\pm$ and $B^\pm \rightarrow D^{(*)} \pi^\pm$ decays are presented, where $D^{(*)}$ indicates a neutral $D$ or $D^*$ meson that is an admixture of $D^{(*)0}$ and $\bar{D}^{(*)0}$ states. Decays of the $D^*$ meson to the $D\pi^0$ and $D\gamma$ final states are partially reconstructed without inclusion of the neutral pion or photon, resulting in distinctive shapes in the $B$ candidate invariant mass distribution. Decays of the $D$ meson are fully reconstructed in the $K^\pm \pi^\mp$, $K^+ K^-$ and $\pi^+ \pi^-$ final states. The analysis uses a sample of charged $B$ mesons produced in $pp$ collisions collected by the LHCb experiment, corresponding to an integrated luminosity of 2.0, 1.0 and 2.0 fb$^{-1}$ taken at centre-of-mass energies of $\sqrt{s}$ = 7, 8 and 13 TeV, respectively. The study of $B^{\pm} \to D^{*} K^{\pm}$ and $B^{\pm} \to D^{*} \pi^{\pm}$ decays using a partial reconstruction method is the first of its kind, while the measurement of $B^{\pm} \to D K^{\pm}$ and $B^{\pm} \to D \pi^{\pm}$ decays is an update of previous LHCb measurements. The $B^{\pm} \to D K^{\pm}$ results are the most precise to date.
Figures and captions
|
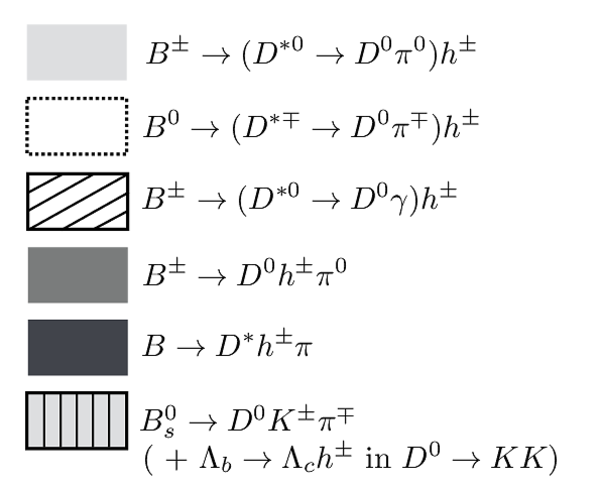
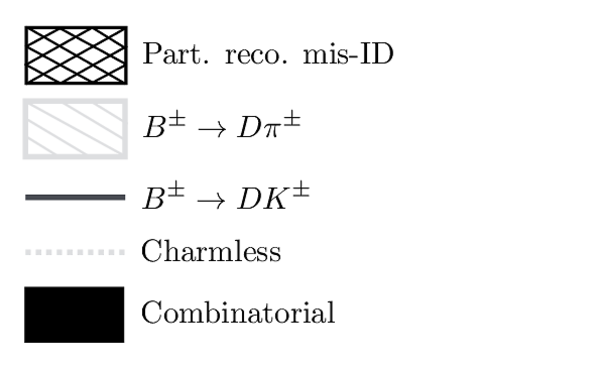
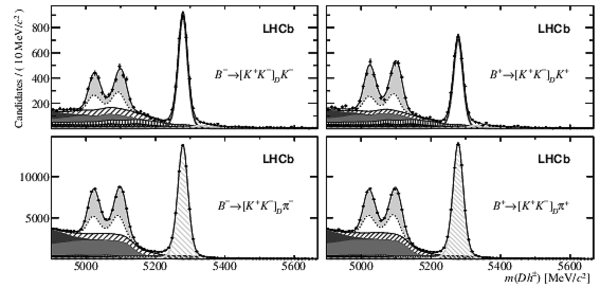
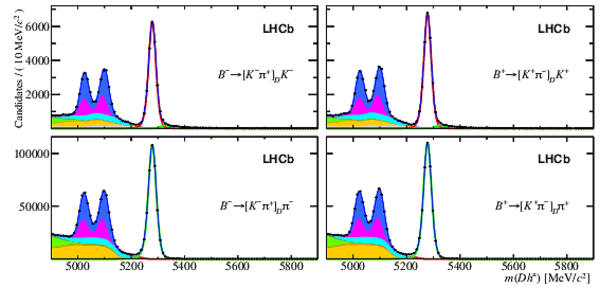
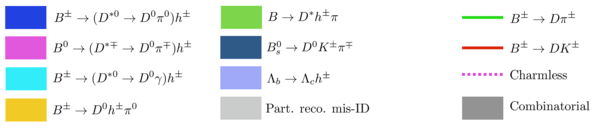
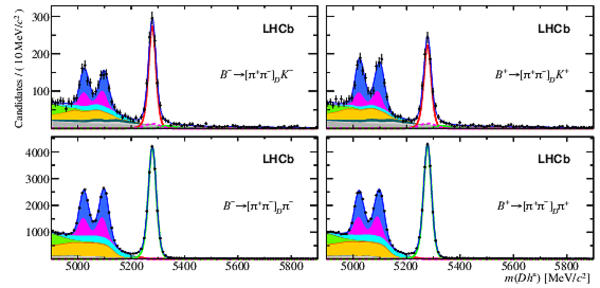
Invariant mass distributions of selected $ B ^\pm \rightarrow [ K ^\pm \pi ^\mp ]_{D}h^{\pm}$ candidates, separated by charge, with $ B ^- {\rm(} B ^+ {\rm)}$ candidates on the left (right). The top panels contain the $ B ^\pm \rightarrow D^{(*)0}K^{\pm}$ candidate samples, as defined by a PID requirement on the companion particle. The remaining candidates are placed in the bottom panels, reconstructed with a pion hypothesis for the companion. The result of the fit is shown by the thin solid black line, and each component is listed in the legend. The component referred to as `Part. reco. mis-ID' is the total contribution from all partially reconstructed and misidentified decays. |
Fig1a.eps [95 KiB] HiDef png [205 KiB] Thumbnail [84 KiB] *.C file |

|
|
Fig1b.eps [403 KiB] HiDef png [151 KiB] Thumbnail [137 KiB] *.C file |
|
|
|
Fig1c.eps [402 KiB] HiDef png [121 KiB] Thumbnail [95 KiB] *.C file |
|
|
|
Invariant mass distributions of selected $ B ^\pm \rightarrow [ K ^+ K ^- ]_{D}h^{\pm}$ candidates, separated by charge. See Fig. 1 for details of each component. |
Fig2.eps [114 KiB] HiDef png [225 KiB] Thumbnail [91 KiB] *.C file |
|
|
Invariant mass distributions of selected $ B ^\pm \rightarrow [\pi ^+ \pi ^- ]_{D}h^{\pm}$ candidates, separated by charge. See Fig. 1 for details of each component. |
Fig3.eps [115 KiB] HiDef png [226 KiB] Thumbnail [93 KiB] *.C file |

|
|
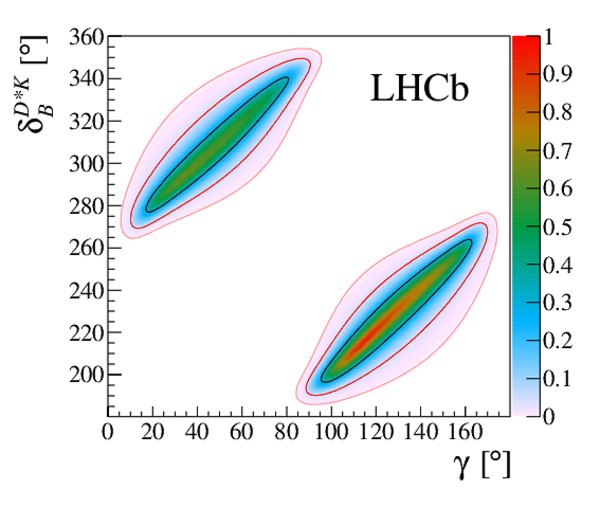
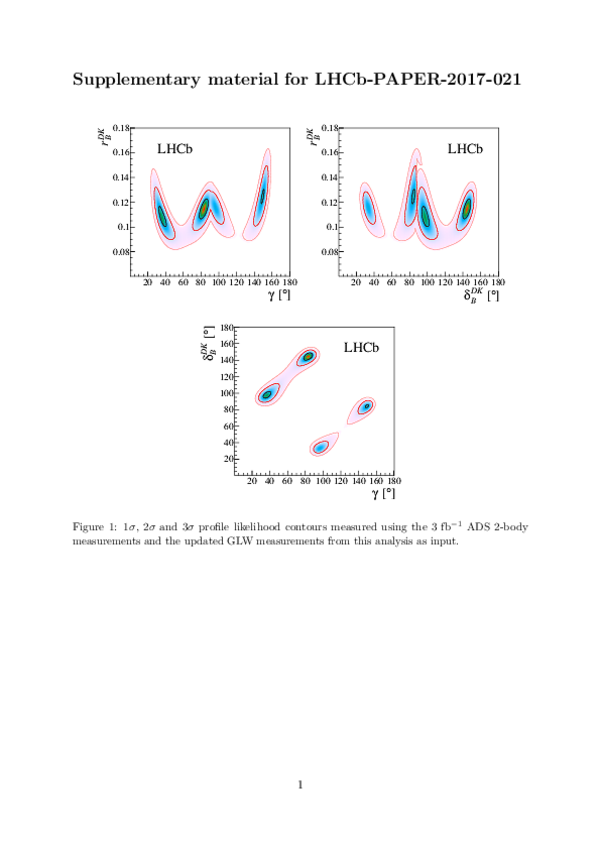
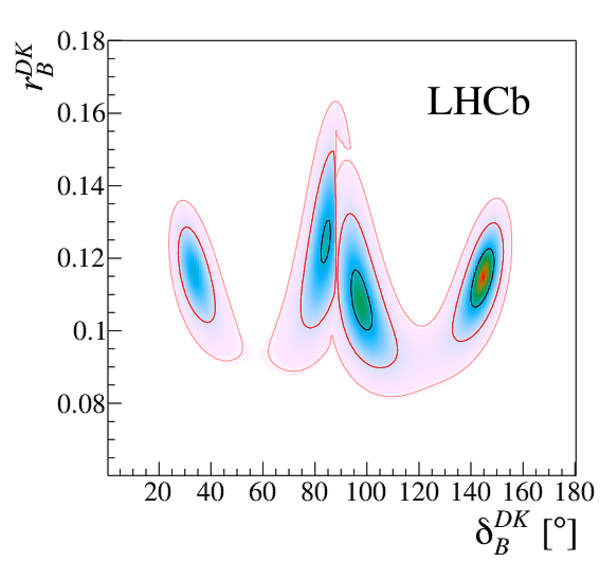
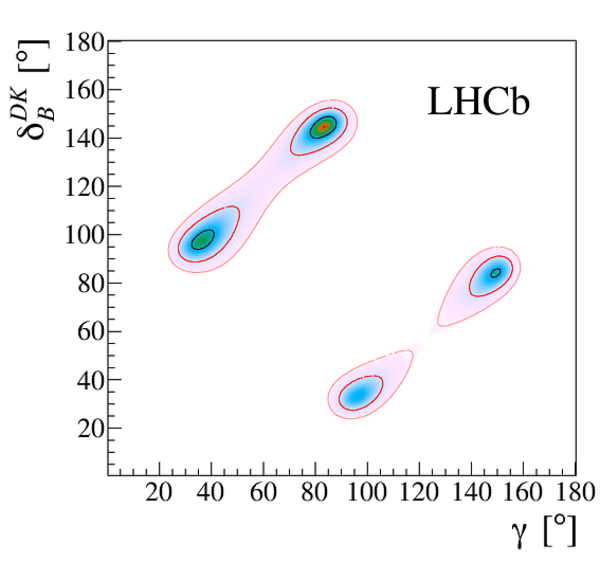
$1\sigma$, $2\sigma$ and $3\sigma$ profile likelihood contours for $r_{B}^{D^{*} K}$, $\delta_{B}^{D^{*} K}$ and $\gamma$, corresponding to 68.3%, 95.5% and 99.7% confidence level (CL), respectively. The contours are measured using $ B ^- \rightarrow ( D \pi ^0 )_{ D ^* } K ^- $ and $ B ^- \rightarrow ( D \gamma)_{ D ^* } K ^- $ decays. The colour scale represents $1-\text{CL}$. |
Fig4a.eps [913 KiB] HiDef png [1 MiB] Thumbnail [383 KiB] *.C file |

|
|
Fig4b.eps [904 KiB] HiDef png [1 MiB] Thumbnail [396 KiB] *.C file |

|
|
|
Fig4c.eps [884 KiB] HiDef png [999 KiB] Thumbnail [365 KiB] *.C file |
|
|
|
Animated gif made out of all figures. |
PAPER-2017-021.gif Thumbnail |

|
Tables and captions
|
Table_1.pdf [128 KiB] HiDef png [39 KiB] Thumbnail [13 KiB] tex code |

|
|
|
Table_2.pdf [60 KiB] HiDef png [9 KiB] Thumbnail [2 KiB] tex code |

|
|
|
Systematic uncertainties for the $ C P$ observables measured in a partially reconstructed manner, quoted as a percentage of the statistical uncertainty on the observable. |
Table_3.pdf [46 KiB] HiDef png [44 KiB] Thumbnail [18 KiB] tex code |

|
|
Systematic uncertainties for the $ C P$ observables measured in a fully reconstructed manner, quoted as a percentage of the statistical uncertainty on the observable. The Sim uncertainty on $R_{K/\pi}^{K\pi}$ is due to the limited size of the simulated samples used to determine the relative efficiency for reconstructing and selecting $ B ^- \rightarrow D \pi ^- $ and $ B ^- \rightarrow D K ^- $ decays. |
Table_4.pdf [40 KiB] HiDef png [76 KiB] Thumbnail [35 KiB] tex code |

|
|
Systematic uncertainties for the branching fraction measurements, quoted as a percentage of the statistical uncertainty on the observable. |
Table_5.pdf [54 KiB] HiDef png [72 KiB] Thumbnail [32 KiB] tex code |

|
|
Statistical correlation matrix for the $ C P$ observables measured using partially reconstructed decays. |
Table_6.pdf [40 KiB] HiDef png [72 KiB] Thumbnail [31 KiB] tex code |

|
|
Statistical correlation matrix for the $ C P$ observables measured using fully reconstructed decays. |
Table_7.pdf [32 KiB] HiDef png [70 KiB] Thumbnail [34 KiB] tex code |

|
|
Systematic uncertainty correlation matrix for the $ C P$ observables measured using partially reconstructed decays. |
Table_8.pdf [41 KiB] HiDef png [73 KiB] Thumbnail [32 KiB] tex code |

|
|
Systematic uncertainty correlation matrix for the $ C P$ observables measured using fully reconstructed decays. |
Table_9.pdf [32 KiB] HiDef png [69 KiB] Thumbnail [34 KiB] tex code |

|
Supplementary Material [file]


![HiDef png [205 KiB]](Directory_LHCb-PAPER-2017-021/hidef_Fig1a.png)
![HiDef png [151 KiB]](Directory_LHCb-PAPER-2017-021/hidef_Fig1b.png)
![HiDef png [121 KiB]](Directory_LHCb-PAPER-2017-021/hidef_Fig1c.png)
![HiDef png [225 KiB]](Directory_LHCb-PAPER-2017-021/hidef_Fig2.png)
![HiDef png [226 KiB]](Directory_LHCb-PAPER-2017-021/hidef_Fig3.png)
![HiDef png [1 MiB]](Directory_LHCb-PAPER-2017-021/hidef_Fig4a.png)
![HiDef png [1 MiB]](Directory_LHCb-PAPER-2017-021/hidef_Fig4b.png)
![HiDef png [999 KiB]](Directory_LHCb-PAPER-2017-021/hidef_Fig4c.png)
![HiDef png [39 KiB]](Directory_LHCb-PAPER-2017-021/hidef_Table_1.png)
![HiDef png [9 KiB]](Directory_LHCb-PAPER-2017-021/hidef_Table_2.png)
![HiDef png [44 KiB]](Directory_LHCb-PAPER-2017-021/hidef_Table_3.png)
![HiDef png [76 KiB]](Directory_LHCb-PAPER-2017-021/hidef_Table_4.png)
![HiDef png [72 KiB]](Directory_LHCb-PAPER-2017-021/hidef_Table_5.png)
![HiDef png [72 KiB]](Directory_LHCb-PAPER-2017-021/hidef_Table_6.png)
![HiDef png [70 KiB]](Directory_LHCb-PAPER-2017-021/hidef_Table_7.png)
![HiDef png [73 KiB]](Directory_LHCb-PAPER-2017-021/hidef_Table_8.png)
![HiDef png [69 KiB]](Directory_LHCb-PAPER-2017-021/hidef_Table_9.png)
![HiDef png [724 KiB]](Directory_LHCb-PAPER-2017-021/supplementary/hidef_Fig1a.png)
![HiDef png [762 KiB]](Directory_LHCb-PAPER-2017-021/supplementary/hidef_Fig1b.png)
![HiDef png [447 KiB]](Directory_LHCb-PAPER-2017-021/supplementary/hidef_Fig1c.png)
![HiDef png [292 KiB]](Directory_LHCb-PAPER-2017-021/supplementary/hidef_Fig2a.png)
![HiDef png [67 KiB]](Directory_LHCb-PAPER-2017-021/supplementary/hidef_Fig2b.png)
![HiDef png [332 KiB]](Directory_LHCb-PAPER-2017-021/supplementary/hidef_Fig3.png)
![HiDef png [339 KiB]](Directory_LHCb-PAPER-2017-021/supplementary/hidef_Fig4.png)
![HiDef png [243 KiB]](Directory_LHCb-PAPER-2017-021/supplementary/hidef_Fig5a.png)
![HiDef png [198 KiB]](Directory_LHCb-PAPER-2017-021/supplementary/hidef_Fig5b.png)
Created on 02 May 2024.