First observation of forward $Z \rightarrow b \bar{b}$ production in $pp$ collisions at $\sqrt{s}=8$ TeV
[to restricted-access page]Information
LHCb-PAPER-2017-024
CERN-EP-2017-211
arXiv:1709.03458 [PDF]
(Submitted on 11 Sep 2017)
Phys. Lett. B776 (2018) 430
Inspire 1622743
Tools
Abstract
The decay $Z \rightarrow b \bar{b}$ is reconstructed in $pp$ collision data, corresponding to 2 fb$^{-1}$ of integrated luminosity, collected by the LHCb experiment at a centre-of-mass energy of $\sqrt{s}=8$ TeV. The product of the $Z$ production cross-section and the $Z \rightarrow b \bar{b}$ branching fraction is measured for candidates in the fiducial region defined by two particle-level $b$-quark jets with pseudorapidities in the range $2.2 < \eta < 4.2$, with transverse momenta $p_{T}>20$ GeV and dijet invariant mass in the range $45 < m_{jj} < 165$ GeV. From a signal yield of $5462 \pm 763$ $Z \rightarrow b \bar{b}$ events, where the uncertainty is statistical, a production cross-section times branching fraction of $332 \pm 46 \pm 59$ pb is obtained, where the first uncertainty is statistical and the second systematic. The measured significance of the signal yield is 6.0 standard deviations. This measurement represents the first observation of the $Z \rightarrow b \bar{b}$ production in the forward region of $pp$ collisions.
Figures and captions
|
Distribution of the multivariate classifier output for data and for simulated $Z \rightarrow b \bar{b}$ decays, normalisted to unity. The signal region is defined by $\mathrm{uGB}>x_s$ and the control region by events with $\mathrm{uGB}<x_c$. |
Fig1.pdf [14 KiB] HiDef png [126 KiB] Thumbnail [124 KiB] *.C file |

|
|
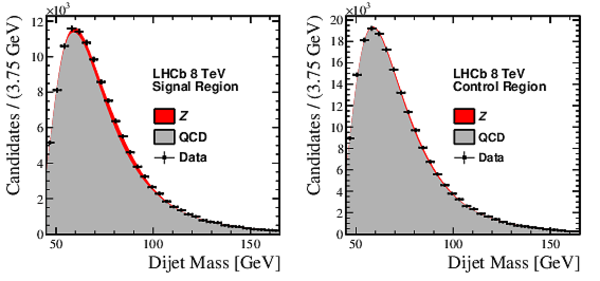
Simultaneous fit to the dijet invariant mass distribution of $Z \rightarrow b \bar{b}$ candidates in the (left) signal and (right) control regions. |
Fig2.pdf [24 KiB] HiDef png [201 KiB] Thumbnail [181 KiB] *.C file |
|
|
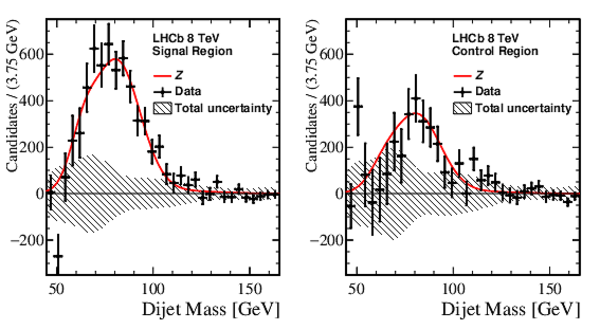
Background-subtracted distribution compared with the $Z \rightarrow b \bar{b}$ mass model in the (left) signal and (right) control regions. The one standard deviation total uncertainty band in the background-only hypothesis is also shown. This band includes statistical and systematic uncertainties. |
Fig3.pdf [101 KiB] HiDef png [280 KiB] Thumbnail [253 KiB] *.C file |
|
|
Animated gif made out of all figures. |
PAPER-2017-024.gif Thumbnail |

|
![HiDef png [126 KiB]](Directory_LHCb-PAPER-2017-024/hidef_Fig1.png)
![HiDef png [201 KiB]](Directory_LHCb-PAPER-2017-024/hidef_Fig2.png)
![HiDef png [280 KiB]](Directory_LHCb-PAPER-2017-024/hidef_Fig3.png)
Tables and captions
|
Systematic uncertainties on the cross-section, $\sigma_Z=\sigma(pp \rightarrow Z) \mathcal{B}(Z \rightarrow b \bar{b})$, and jet energy scale in percent. The total uncertainty is the sum in quadrature of all the contributions. |
Table_1.pdf [59 KiB] HiDef png [133 KiB] Thumbnail [64 KiB] tex code |

|
![HiDef png [133 KiB]](Directory_LHCb-PAPER-2017-024/hidef_Table_1.png)
Created on 27 April 2024.