Measurements of the branching fractions of $\Lambda_{c}^{+} \rightarrow p \pi^{-} \pi^{+}$, $\Lambda_{c}^{+} \rightarrow p K^{-} K^{+}$, and $\Lambda_{c}^{+} \rightarrow p \pi^{-} K^{+}$
[to restricted-access page]Information
LHCb-PAPER-2017-026
CERN-EP-2017-247
arXiv:1711.01157 [PDF]
(Submitted on 03 Nov 2017)
JHEP 03 (2018) 043
Inspire 1634432
Tools
Abstract
The ratios of the branching fractions of the decays $\Lambda_{c}^{+} \rightarrow p \pi^{-} \pi^{+}$, $\Lambda_{c}^{+} \rightarrow p K^{-} K^{+}$, and $\Lambda_{c}^{+} \rightarrow p \pi^{-} K^{+}$ with respect to the Cabibbo-favoured $\Lambda_{c}^{+} \rightarrow p K^{-} \pi^{+}$ decay are measured using proton-proton collision data collected with the LHCb experiment at a 7 TeV centre-of-mass energy and corresponding to an integrated luminosity of 1.0 fb$^{-1}$: \begin{align*} \frac{\mathcal{B}(\Lambda_{c}^{+} \rightarrow p \pi^{-} \pi^{+})}{\mathcal{B}(\Lambda_{c}^{+} \rightarrow p K^{-} \pi^{+})} & = (7.44 \pm 0.08 \pm 0.18) \%, \frac{\mathcal{B}(\Lambda_{c}^{+} \rightarrow p K^{-} K^{+})}{\mathcal{B}(\Lambda_{c}^{+} \rightarrow p K^{-} \pi^{+})} &= (1.70 \pm 0.03 \pm 0.03) \%, \frac{\mathcal{B}(\Lambda_{c}^{+} \rightarrow p \pi^{-} K^{+})}{\mathcal{B}(\Lambda_{c}^{+} \rightarrow p K^{-} \pi^{+})} & = (0.165 \pm 0.015 \pm 0.005 ) \%, \end{align*} where the uncertainties are statistical and systematic, respectively. These results are the most precise measurements of these quantities to date. When multiplied by the world-average value for $\mathcal{B}(\Lambda_{c}^{+} \rightarrow p K^{-} \pi^{+})$, the corresponding branching fractions are \begin{align*} \mathcal{B}(\Lambda_{c}^{+} \rightarrow p \pi^{-} \pi^{+}) &= (4.72 \pm 0.05 \pm 0.11 \pm 0.25) \times 10^{-3}, \mathcal{B}(\Lambda_{c}^{+} \rightarrow p K^{-} K^{+}) &= (1.08 \pm 0.02 \pm 0.02 \pm 0.06) \times 10^{-3}, \mathcal{B}(\Lambda_{c}^{+} \rightarrow p \pi^{-} K^{+}) &= (1.04 \pm 0.09 \pm 0.03 \pm 0.05) \times 10^{-4}, \end{align*} where the final uncertainty is due to $\mathcal{B}(\Lambda_{c}^{+} \rightarrow p K^{-} \pi^{+})$.
Figures and captions
|
Weak decays of $\Lambda ^+_ c $ to a proton and two mesons, without hyperon mediation. Shown are external $ W $ -emission for (a) $\Lambda ^+_ c \rightarrow p K ^- \pi ^+ $ and (b) $\Lambda ^+_ c \rightarrow p \pi ^- K ^+ $ , internal $ W $ -emission for (c) $\Lambda ^+_ c \rightarrow p K ^- \pi ^+ $ and (d) $\Lambda ^+_ c \rightarrow p \pi ^- K ^+ $ , and $ W $ -exchange for (e) $\Lambda ^+_ c \rightarrow p K ^- \pi ^+ $ . |
[Failure to get the plot] | |
|
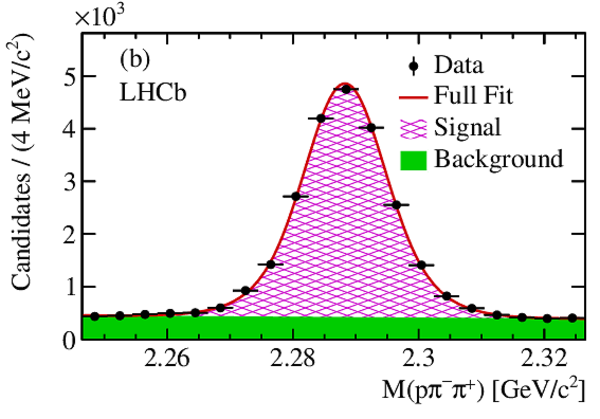
Invariant mass distributions of (a) $\Lambda ^+_ c \rightarrow p K ^- \pi ^+ $ , (b) $\Lambda ^+_ c \rightarrow p \pi ^- \pi ^+ $ , (c) $\Lambda ^+_ c \rightarrow p K ^- K ^+ $ , and (d) $\Lambda ^+_ c \rightarrow p \pi ^- K ^+ $ decays, with fit results superimposed. The hatched magenta region indicates the signal, the shaded green region indicates the background from unrelated tracks, and the solid red line indicates the full fit. |
Fig2a.pdf [17 KiB] HiDef png [460 KiB] Thumbnail [264 KiB] *.C file |

|
|
Fig2b.pdf [17 KiB] HiDef png [492 KiB] Thumbnail [271 KiB] *.C file |
|
|
|
Fig2c.pdf [17 KiB] HiDef png [375 KiB] Thumbnail [236 KiB] *.C file |

|
|
|
Fig2d.pdf [16 KiB] HiDef png [343 KiB] Thumbnail [218 KiB] *.C file |

|
|
|
Invariant mass distributions for (a) $\Lambda ^+_ c \rightarrow p K ^- \pi ^+ $ , (c) $\Lambda ^+_ c \rightarrow p \pi ^- \pi ^+ $ , (e) $\Lambda ^+_ c \rightarrow p K ^- K ^+ $ in the prompt analysis, with fit results superimposed. The $\ln \left(\chi^2 _{\mathrm{IP} } \right)$ distributions for (b) $\Lambda ^+_ c \rightarrow p K ^- \pi ^+ $ , (d) $\Lambda ^+_ c \rightarrow p \pi ^- \pi ^+ $ , (f) $\Lambda ^+_ c \rightarrow p K ^- K ^+ $ , with the fit results superimposed, showing the differentiation of prompt and secondary $\Lambda ^+_ c $ . |
Fig3a.pdf [17 KiB] HiDef png [446 KiB] Thumbnail [253 KiB] *.C file |

|
|
Fig3b.pdf [17 KiB] HiDef png [244 KiB] Thumbnail [176 KiB] *.C file |

|
|
|
Fig3c.pdf [16 KiB] HiDef png [215 KiB] Thumbnail [157 KiB] *.C file |

|
|
|
Fig3d.pdf [19 KiB] HiDef png [220 KiB] Thumbnail [162 KiB] *.C file |

|
|
|
Fig3e.pdf [16 KiB] HiDef png [283 KiB] Thumbnail [195 KiB] *.C file |

|
|
|
Fig3f.pdf [16 KiB] HiDef png [230 KiB] Thumbnail [178 KiB] *.C file |

|
|
|
Animated gif made out of all figures. |
PAPER-2017-026.gif Thumbnail |

|
![HiDef png [460 KiB]](Directory_LHCb-PAPER-2017-026/hidef_Fig2a.png)
![HiDef png [492 KiB]](Directory_LHCb-PAPER-2017-026/hidef_Fig2b.png)
![HiDef png [375 KiB]](Directory_LHCb-PAPER-2017-026/hidef_Fig2c.png)
![HiDef png [343 KiB]](Directory_LHCb-PAPER-2017-026/hidef_Fig2d.png)
![HiDef png [446 KiB]](Directory_LHCb-PAPER-2017-026/hidef_Fig3a.png)
![HiDef png [244 KiB]](Directory_LHCb-PAPER-2017-026/hidef_Fig3b.png)
![HiDef png [215 KiB]](Directory_LHCb-PAPER-2017-026/hidef_Fig3c.png)
![HiDef png [220 KiB]](Directory_LHCb-PAPER-2017-026/hidef_Fig3d.png)
![HiDef png [283 KiB]](Directory_LHCb-PAPER-2017-026/hidef_Fig3e.png)
![HiDef png [230 KiB]](Directory_LHCb-PAPER-2017-026/hidef_Fig3f.png)
Tables and captions
|
Selection efficiency ratios in the prompt and SL measurements, with their associated systematic uncertainties. $\epsilon_{\mathrm{CF}} / \epsilon_{\mathrm{CS}} $ denotes the ratio of the Cabibbo-favoured selection efficiency over that of the Cabibbo-suppressed mode. |
Table_1.pdf [67 KiB] HiDef png [69 KiB] Thumbnail [35 KiB] tex code |

|
|
Signal yields in both the SL and prompt measurements. |
Table_2.pdf [65 KiB] HiDef png [83 KiB] Thumbnail [43 KiB] tex code |

|
|
Relative systematic uncertainties in each ratio of branching fractions, for the SL analysis. |
Table_3.pdf [69 KiB] HiDef png [40 KiB] Thumbnail [17 KiB] tex code |

|
|
Relative systematic uncertainties in each ratio of branching fractions, for the prompt analysis. |
Table_4.pdf [68 KiB] HiDef png [48 KiB] Thumbnail [22 KiB] tex code |

|
![HiDef png [69 KiB]](Directory_LHCb-PAPER-2017-026/hidef_Table_1.png)
![HiDef png [83 KiB]](Directory_LHCb-PAPER-2017-026/hidef_Table_2.png)
![HiDef png [40 KiB]](Directory_LHCb-PAPER-2017-026/hidef_Table_3.png)
![HiDef png [48 KiB]](Directory_LHCb-PAPER-2017-026/hidef_Table_4.png)
Created on 27 April 2024.