Measurement of $CP$ observables in $B^{\pm} \rightarrow D K^{*\pm}$ decays using two- and four-body $D$ final states
[to restricted-access page]Information
LHCb-PAPER-2017-030
CERN-EP-2017-208
arXiv:1709.05855 [PDF]
(Submitted on 18 Sep 2017)
JHEP 11 (2017) 156
Inspire 1624171
Tools
Abstract
Measurements of $CP$ observables in $B^{\pm} \rightarrow D K^{*\pm}$ decays are presented, where $D$ denotes a superposition of $D^0$ and $\overline{D^0}$ meson states. Decays of the $D$ meson to $K^{-}\pi^{+}$, $K^{-}K^{+}$, $\pi^{-}\pi^{+}$, $K^{-}\pi^{+}\pi^{-}\pi^{+}$ and $\pi^{-}\pi^{+}\pi^{-}\pi^{+}$ are used and the $K^{*\pm}$ meson is reconstructed in the $K^{0}_{\mathrm{S}}\pi^{\pm}$ final state. This analysis uses a data sample of $pp$ collisions collected with the LHCb experiment, corresponding to integrated luminosities of 1 $\mathrm{fb}^{-1}$, 2 $\mathrm{fb}^{-1}$ and 1.8 $\mathrm{fb}^{-1}$ at centre-of-mass energies $\sqrt{s} = $ 7 TeV, 8 TeV and 13 TeV, respectively. The sensitivity of the results to the CKM angle $\gamma$ is discussed.
Figures and captions
|
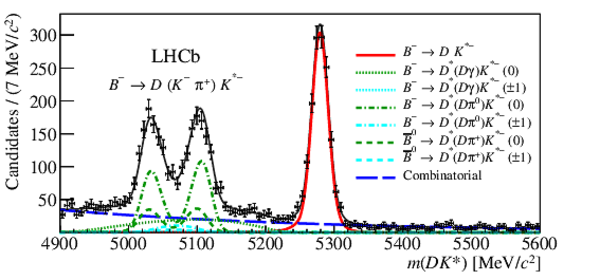
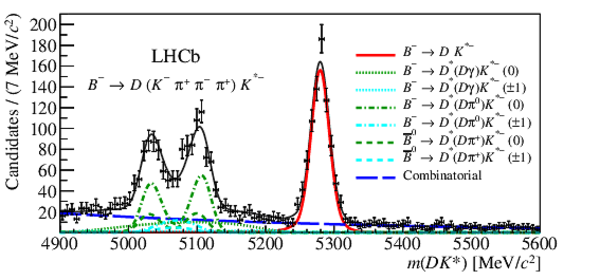
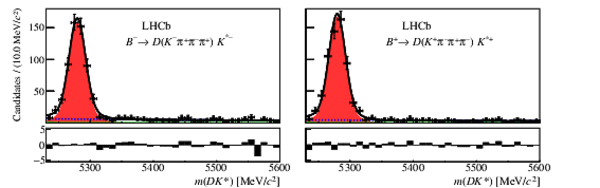
Invariant mass distribution with the fit result superimposed for the favoured $ B ^- \rightarrow D ( K ^- \pi ^+ ) K ^{*-} $ decay mode (top), and $ B ^- \rightarrow D ( K ^- \pi ^+ \pi ^- \pi ^+ ) K ^{*-} $ decay mode (bottom), using Run 1 and Run 2 data combined. The labels 0 and $\pm$1 correspond to the helicity state of the $ D ^*$ meson. |
massFi[..].pdf [34 KiB] HiDef png [316 KiB] Thumbnail [214 KiB] *.C file |
|
|
massFi[..].pdf [35 KiB] HiDef png [319 KiB] Thumbnail [225 KiB] *.C file |
|
|
|
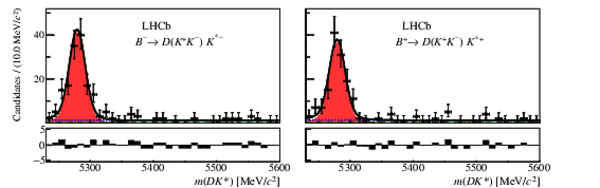
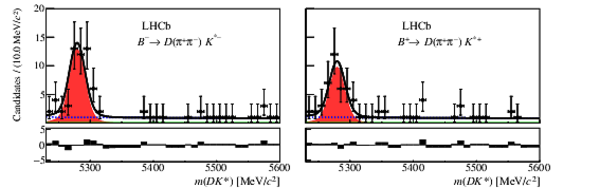
Result of fits to data for the two-body decay modes with Run 1, Run 2, long and downstream categories summed for presentation. The signal is represented by the red shaded area, the combinatorial background by the dotted blue line and the partially reconstructed background by the solid green line. In the $ D ^0 \rightarrow K ^+ K ^- $ fits the $\Lambda ^0_ b \rightarrow \Lambda ^+_ c K ^{*-} $ background is represented by the dashed purple line. The total fit is given by the black line. The residuals, shown below each plot, are defined as the difference between the data and the fit value in each bin, normalised by the uncertainty. |
canvas[..].pdf [24 KiB] HiDef png [136 KiB] Thumbnail [96 KiB] *.C file |

|
|
canvas[..].pdf [24 KiB] HiDef png [151 KiB] Thumbnail [105 KiB] *.C file |
|
|
|
canvas[..].pdf [22 KiB] HiDef png [142 KiB] Thumbnail [108 KiB] *.C file |
|
|
|
canvas[..].pdf [22 KiB] HiDef png [132 KiB] Thumbnail [112 KiB] *.C file |

|
|
|
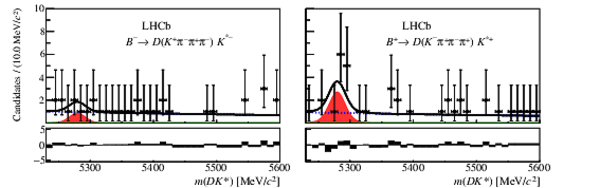
Result of fits to data for the four-body decay modes with Run 1, Run 2, long and downstream categories summed for presentation. The signal is represented by the red shaded area, the combinatorial background by the dotted blue line and the partially reconstructed background by the solid green line. The total fit is given by the black line. The residuals are shown below each plot.\vspace{75pt} |
canvas[..].pdf [25 KiB] HiDef png [143 KiB] Thumbnail [102 KiB] *.C file |
|
|
canvas[..].pdf [24 KiB] HiDef png [154 KiB] Thumbnail [120 KiB] *.C file |

|
|
|
canvas[..].pdf [22 KiB] HiDef png [137 KiB] Thumbnail [114 KiB] *.C file |
|
|
|
Contour plots showing 2D scans of physics parameters $\gamma$ versus $r_B$ (left) and $\gamma$ versus $\delta_B$ (right). The dashed lines represent the $\Delta \chi^2 = 2.30,\ 6.18,\ 11.8$ contours, corresponding to 68.3%, 95.5%, 99.7% confidence levels (CL), respectively. The colour scale represents $1-\text{CL}$. |
rBu_dk[..].pdf [42 KiB] HiDef png [616 KiB] Thumbnail [416 KiB] *.C file |

|
|
deltaB[..].pdf [43 KiB] HiDef png [646 KiB] Thumbnail [441 KiB] *.C file |

|
|
|
Animated gif made out of all figures. |
PAPER-2017-030.gif Thumbnail |

|
![HiDef png [316 KiB]](Directory_LHCb-PAPER-2017-030/hidef_massFitDD_allyears_KPi.png)
![HiDef png [319 KiB]](Directory_LHCb-PAPER-2017-030/hidef_massFitDD_allyears_KPiPiPi.png)
![HiDef png [136 KiB]](Directory_LHCb-PAPER-2017-030/hidef_canvas_d2kpi.png)
![HiDef png [151 KiB]](Directory_LHCb-PAPER-2017-030/hidef_canvas_d2kk.png)
![HiDef png [142 KiB]](Directory_LHCb-PAPER-2017-030/hidef_canvas_d2pipi.png)
![HiDef png [132 KiB]](Directory_LHCb-PAPER-2017-030/hidef_canvas_d2pik.png)
![HiDef png [143 KiB]](Directory_LHCb-PAPER-2017-030/hidef_canvas_d2kpipipi.png)
![HiDef png [154 KiB]](Directory_LHCb-PAPER-2017-030/hidef_canvas_d2pipipipi.png)
![HiDef png [137 KiB]](Directory_LHCb-PAPER-2017-030/hidef_canvas_d2pikpipi.png)
![HiDef png [616 KiB]](Directory_LHCb-PAPER-2017-030/hidef_rBu_dkstar_gamma_2Dscan_nomixing.png)
![HiDef png [646 KiB]](Directory_LHCb-PAPER-2017-030/hidef_deltaBu_dkstar_gamma_2Dscan_nomixing.png)
Tables and captions
|
Fitted yields in each of the $ B $ decay modes. The uncertainties are statistical only. |
Table_1.pdf [44 KiB] HiDef png [92 KiB] Thumbnail [49 KiB] tex code |

|
|
Summary of systematic uncertainties. Uncertainties are not shown if they are more than two orders of magnitude smaller than the statistical uncertainty. |
Table_2.pdf [55 KiB] HiDef png [86 KiB] Thumbnail [33 KiB] tex code |

|
|
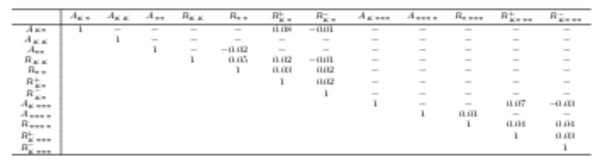
Correlation matrix of the statistical uncertainties for the twelve physics observables from the simultaneous fit to data. Only half of the symmetric matrix is shown. |
Table_3.pdf [46 KiB] HiDef png [27 KiB] Thumbnail [30 KiB] tex code |
|
|
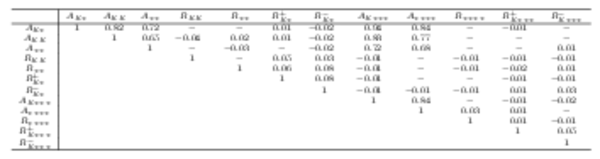
Correlation matrix of the systematic uncertainties for the twelve physics observables from the simultaneous fit to data. Only half of the symmetric matrix is shown. |
Table_4.pdf [47 KiB] HiDef png [81 KiB] Thumbnail [44 KiB] tex code |
|
![HiDef png [92 KiB]](Directory_LHCb-PAPER-2017-030/hidef_Table_1.png)
![HiDef png [86 KiB]](Directory_LHCb-PAPER-2017-030/hidef_Table_2.png)
![HiDef png [27 KiB]](Directory_LHCb-PAPER-2017-030/hidef_Table_3.png)
![HiDef png [81 KiB]](Directory_LHCb-PAPER-2017-030/hidef_Table_4.png)
Created on 02 May 2024.