Measurement of branching fractions of charmless four-body $\Lambda_b^0$ and $\Xi_b^0$ decays
[to restricted-access page]Information
LHCb-PAPER-2017-034
CERN-EP-2017-278
arXiv:1711.05490 [PDF]
(Submitted on 15 Nov 2017)
JHEP 02 (2018) 098
Inspire 1636196
Tools
Abstract
A search for charmless four-body decays of $\Lambda_{b}^{0}$ and $\Xi_{b}^{0}$ baryons with a proton and three charged mesons (either kaons or pions) in the final state is performed. The data sample used was recorded in 2011 and 2012 with the LHCb experiment and corresponds to an integrated luminosity of 3 fb$^{-1}$. Six decay modes are observed, among which $\Lambda_{b}^{0} \to pK^{-}\pi^{+}\pi^{-}$, $\Lambda_{b}^{0} \to pK^{-}K^{+}K^{-}$, $\Xi_{b}^{0} \to pK^{-}\pi^{+}\pi^{-}$ and $\Xi_{b}^{0} \to pK^{-} \pi^{+}K^{-}$ are established for the first time. Their branching fractions (including the ratio of hadronisation fractions in the case of the $\Xi_{b}^{0}$ baryon) are determined relative to the $\Lambda_{b}^{0} \to \Lambda_{c}^{+}\pi^{-}$ decay.
Figures and captions
|
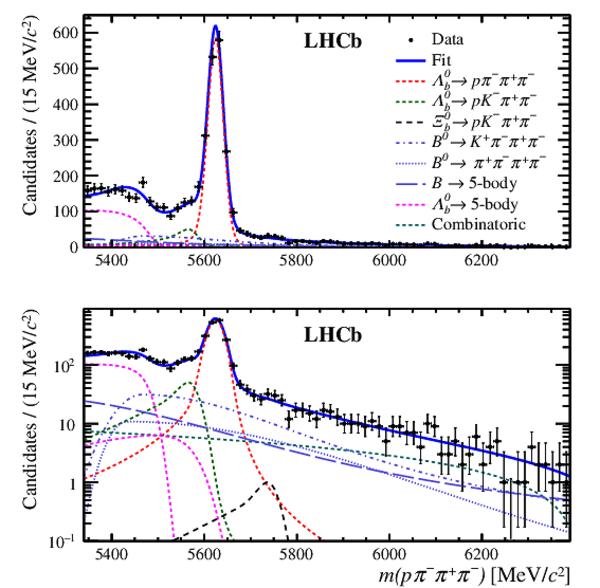
Results of the fit to the $ p \pi ^-\pi ^+\pi ^-$ candidate mass spectrum with (top) linear and (bottom) logarithmic scales. The different components employed in the fit are indicated in the legend. The $\Lambda ^0_ b \rightarrow $ 5-body legend describes two components, the radiative partially reconstructed background $\Lambda ^0_ b \rightarrow p \pi ^-\eta ^{\prime} $ and the partially reconstructed background $\Lambda ^0_ b \rightarrow p \pi ^-\pi ^+\pi ^-\pi ^0$ where a $\pi^0$ is not reconstructed. The latter has a lower-mass endpoint. |
Lb2ppi[..].pdf [49 KiB] HiDef png [526 KiB] Thumbnail [384 KiB] *.C file |
|
|
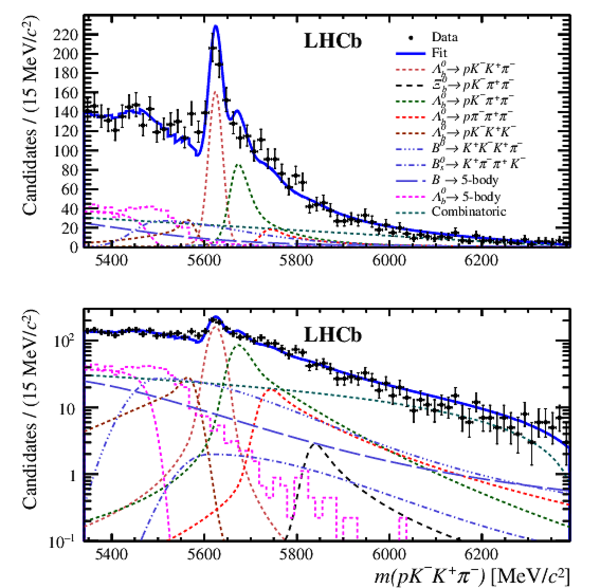
Results of the fit to the $ p K ^-\pi ^+\pi ^-$ candidate mass spectrum with (top) linear and (bottom) logarithmic scales. The different components employed in the fit are indicated in the legend. The $\Lambda ^0_ b \rightarrow $ 5-body legend describes two components, the radiative partially reconstructed background $\Lambda ^0_ b \rightarrow p K ^-\eta ^{\prime} $ and the partially reconstructed background $\Lambda ^0_ b \rightarrow p K ^-\pi ^+\pi ^-\pi ^0$ where a $\pi^0$ is not reconstructed. The latter has a lower-mass endpoint. |
Lb2pKp[..].pdf [51 KiB] HiDef png [583 KiB] Thumbnail [418 KiB] *.C file |

|
|
Results of the fit to the $ p K ^- K ^+\pi ^-$ candidate mass spectrum with (top) linear and (bottom) logarithmic scales. The different components employed in the fit are indicated in the legend. The $\Lambda ^0_ b \rightarrow $ 5-body legend describes two components where a $\pi^0$ is not reconstructed, the partially reconstructed background $\Lambda ^0_ b \rightarrow p K ^-\pi ^+\pi ^-\pi ^0$ where a pion is misidentified as a kaon and the partially reconstructed background $\Lambda ^0_ b \rightarrow p K ^- K ^+\pi ^-\pi ^0$ . |
Lb2pKK[..].pdf [59 KiB] HiDef png [682 KiB] Thumbnail [479 KiB] *.C file |
|
|
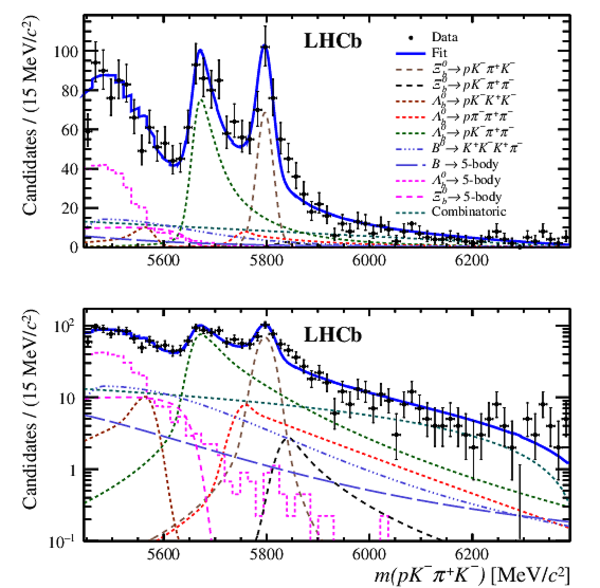
Results of the fit to the $ p K ^-\pi ^+ K ^-$ candidate mass spectrum with (top) linear and (bottom) logarithmic scales. The different components employed in the fit are indicated in the legend. |
Xib02p[..].pdf [53 KiB] HiDef png [644 KiB] Thumbnail [453 KiB] *.C file |
|
|
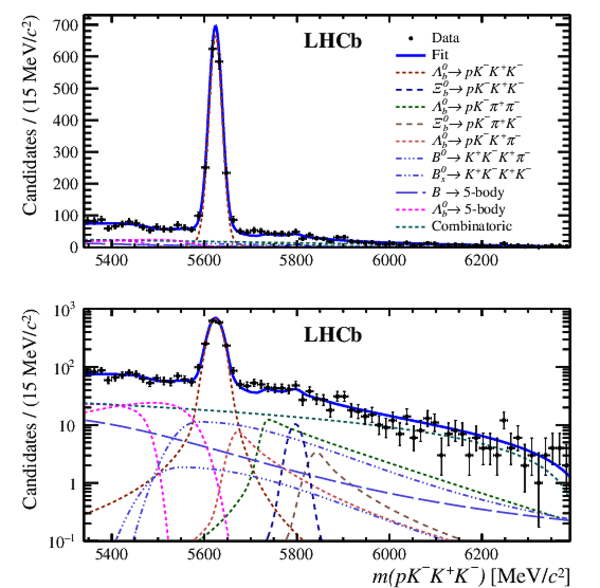
Results of the fit to the $ p K ^- K ^+ K ^-$ candidate mass spectrum with (top) linear and (bottom) logarithmic scales. The different components employed in the fit are indicated in the legend. The $\Lambda ^0_ b \rightarrow $ 5-body legend includes two decays, partially reconstructed $\Lambda ^0_ b \rightarrow p K ^- K ^+ K ^-\gamma $ and $\Lambda ^0_ b \rightarrow p K ^- K ^+ K ^-\pi ^0$ , where the $\gamma $ and $\pi^0$ are not reconstructed. |
Lb2pKK[..].pdf [52 KiB] HiDef png [586 KiB] Thumbnail [412 KiB] *.C file |
|
|
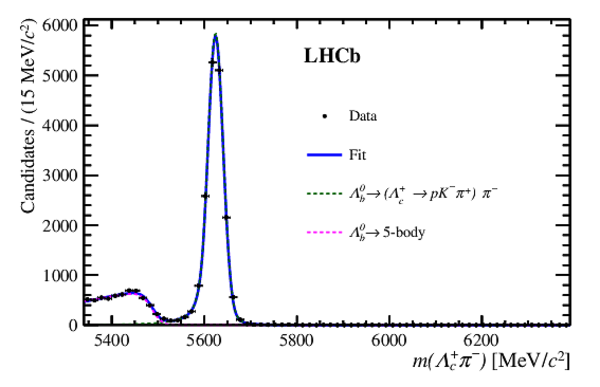
Results of the fit to the $\Lambda ^+_ c \pi^-$ candidate mass spectrum on linear scale. The different components employed in the fit are indicated in the legend. |
Lb2pKp[..].pdf [20 KiB] HiDef png [190 KiB] Thumbnail [145 KiB] *.C file |
|
|
Animated gif made out of all figures. |
PAPER-2017-034.gif Thumbnail |

|
![HiDef png [526 KiB]](Directory_LHCb-PAPER-2017-034/hidef_Lb2ppipipi_MagAll_Spectrum_fitResults.png)
![HiDef png [583 KiB]](Directory_LHCb-PAPER-2017-034/hidef_Lb2pKpipi_MagAll_Spectrum_fitResults.png)
![HiDef png [682 KiB]](Directory_LHCb-PAPER-2017-034/hidef_Lb2pKKpi_MagAll_Spectrum_fitResults.png)
![HiDef png [644 KiB]](Directory_LHCb-PAPER-2017-034/hidef_Xib02pKpiK_MagAll_Spectrum_fitResults.png)
![HiDef png [586 KiB]](Directory_LHCb-PAPER-2017-034/hidef_Lb2pKKK_MagAll_Spectrum_fitResults.png)
![HiDef png [190 KiB]](Directory_LHCb-PAPER-2017-034/hidef_Lb2pKpipi_Lc2pKpi_MagAll_Spectrum_fitResults_linear.png)
Tables and captions
|
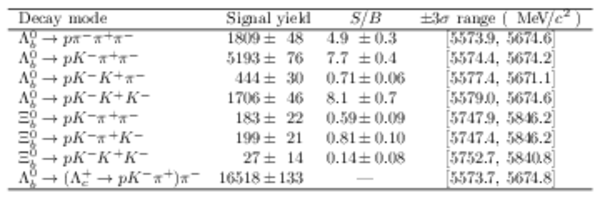
Signal yields for each decay mode, determined by summing the fitted yields in each year of data taking. The signal ($S$) to background ($B$, adding all sources) ratios in an invariant mass window, covering $\pm$ 3 times the measured signal widths, are provided. The corresponding invariant mass ranges are reported in the fourth column. |
Table_1.pdf [68 KiB] HiDef png [178 KiB] Thumbnail [92 KiB] tex code |
|
|
Ratios of the normalisation decay mode efficiencies, relative to the signal decay mode as used in Eq. 4, for (first row) 2011 and (second row) 2012. The last column shows the efficiency of the veto of charm and charmonium backgrounds (applied to the signal mode only), as discussed in the text. Since the $\Xi ^0_ b \rightarrow p K ^- K ^+ K ^-$ decay mode is not observed, the veto efficiency is determined with the simulated data sample. The difference between the simulation value and the average veto efficiency measured on other $\Xi ^0_ b $ modes is reported in the table as the uncertainty. |
Table_2.pdf [68 KiB] HiDef png [157 KiB] Thumbnail [74 KiB] tex code |

|
|
Yields and efficiencies of each signal decay with the statistical uncertainty, and systematic uncertainties related to the fit model and the efficiency determination, for the 2011 data samples. |
Table_3.pdf [90 KiB] HiDef png [63 KiB] Thumbnail [28 KiB] tex code |

|
|
Yields and efficiencies of each signal decay with the statistical uncertainty, and systematic uncertainties related to the fit model and the efficiency determination, for the 2012 data samples. |
Table_4.pdf [90 KiB] HiDef png [63 KiB] Thumbnail [29 KiB] tex code |

|
|
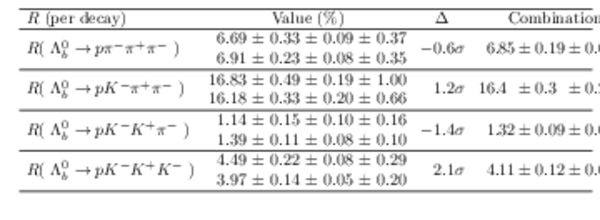
Measurements of the $R$ ratio from the (first row) 2011 and the (second row) 2012 data samples for $\Lambda ^0_ b $ decay modes expressed in percent as well as their combination. The three uncertainties are statistical, systematic related to the fit model and systematic related to the efficiency, respectively. The consistency of the two determinations for each year, denoted $\Delta$, is quantified as the ratio of the signed difference of the central values over the quadratic sum of the related uncertainties. |
Table_5.pdf [68 KiB] HiDef png [151 KiB] Thumbnail [73 KiB] tex code |
|
|
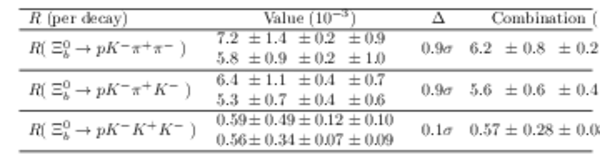
Measurements of the $R$ ratio from the (first row) 2011 and the (second row) 2012 data samples for $\Xi ^0_ b $ decay modes expressed in per mil as well as their combination. The three uncertainties are statistical, systematic related to the fit model and systematic related to the efficiency, respectively. The consistency of the two determinations for each year, denoted $\Delta$, is quantified as the ratio of the signed difference of the central values over the quadratic sum of the related uncertainties. |
Table_6.pdf [67 KiB] HiDef png [116 KiB] Thumbnail [53 KiB] tex code |
|
![HiDef png [178 KiB]](Directory_LHCb-PAPER-2017-034/hidef_Table_1.png)
![HiDef png [157 KiB]](Directory_LHCb-PAPER-2017-034/hidef_Table_2.png)
![HiDef png [63 KiB]](Directory_LHCb-PAPER-2017-034/hidef_Table_3.png)
![HiDef png [63 KiB]](Directory_LHCb-PAPER-2017-034/hidef_Table_4.png)
![HiDef png [151 KiB]](Directory_LHCb-PAPER-2017-034/hidef_Table_5.png)
![HiDef png [116 KiB]](Directory_LHCb-PAPER-2017-034/hidef_Table_6.png)
Created on 27 April 2024.