Measurement of the $B^{\pm}$ production cross-section in pp collisions at $\sqrt{s} =$ 7 and 13 TeV
[to restricted-access page]Information
LHCb-PAPER-2017-037
CERN-EP-2017-254
arXiv:1710.04921 [PDF]
(Submitted on 13 Oct 2017)
JHEP 12 (2017) 026
Inspire 1630633
Tools
Abstract
The production of $B^{\pm}$ mesons is studied in $pp$ collisions at centre-of-mass energies of 7 and 13 TeV, using $B^{\pm}\rightarrow J/\psi K^{\pm}$ decays and data samples corresponding to 1.0 fb$^{-1}$ and 0.3 fb$^{-1}$, respectively. The production cross-sections summed over both charges and integrated over the transverse momentum range $0<p_{\text{T}}< 40$ GeV/$c$ and the rapidity range $2.0<y<4.5$ are measured to be $\sigma(pp \rightarrow B^{\pm} X, \sqrt{s} = \text{7 TeV}) = 43.0 \pm 0.2 \pm 2.5 \pm 1.7\mu b,$ $\sigma(pp \rightarrow B^{\pm} X, \sqrt{s} = \text{13 TeV}) = 86.6 \pm 0.5 \pm 5.4 \pm 3.4\mu b,$ where the first uncertainties are statistical, the second are systematic, and the third are due to the limited knowledge of the $B^{\pm}\rightarrow J/\psi K^{\pm}$ branching fraction. The ratio of the cross-section at 13 TeV to that at 7 TeV is determined to be $2.02\pm0.02\text{(stat)}\pm0.12\text{(syst)}$. Differential cross-sections are also reported as functions of $p_{\text{T}}$ and $y$. All results are in agreement with theoretical calculations based on the state-of-art fixed next-to-leading order quantum chromodynamics.
Figures and captions
|
Invariant mass distributions of $ B ^\pm$ candidates in the range ${3.5< p_{\mathrm{ T}} <4.0 {\mathrm{ Ge V /}c} }$ and ${2.5<y<3.0}$ using (left) $7\mathrm{ Te V} $ and (right) $13\mathrm{ Te V} $ data. The black points are the number of selected candidates in each bin, the blue curve represents the fit result, the red-dotted line represents the $ B ^\pm \rightarrow { J \mskip -3mu/\mskip -2mu\psi \mskip 2mu} K ^\pm $ signal, and the green- and brown-dashed lines are contributions from the combinatorial and the Cabibbo-suppressed backgrounds. The Cabibbo-suppressed background contribution $ B ^\pm \rightarrow { J \mskip -3mu/\mskip -2mu\psi \mskip 2mu} \pi ^\pm $ is only just visible at masses above the signal peak. |
Fig1a.pdf [83 KiB] HiDef png [289 KiB] Thumbnail [290 KiB] *.C file |

|
|
Fig1b.pdf [82 KiB] HiDef png [276 KiB] Thumbnail [280 KiB] *.C file |

|
|
|
Measured $ B ^\pm$ double-differential production cross-sections at (top) $7\mathrm{ Te V} $ and (bottom) $13\mathrm{ Te V} $ as a function of $p_{\mathrm{ T}}$ and $y$. The black points represent the measured values, and the cyan bands are the FONLL predictions [28]. Each set of measurements and predictions in a given rapidity bin is offset by a multiplicative factor $10^{-m}$, where the offset factor is shown after the rapidity range. The error bars include both the statistical and systematic uncertainties. |
Fig2a.pdf [66 KiB] HiDef png [211 KiB] Thumbnail [227 KiB] *.C file |

|
|
Fig2b.pdf [69 KiB] HiDef png [210 KiB] Thumbnail [228 KiB] *.C file |

|
|
|
Measured $ B ^\pm$ differential cross-section at $7\mathrm{ Te V} $ as a function of (left) $p_{\mathrm{ T}}$ or (right) $y$. The black points represent the measured values, the blue-dashed line and cyan band represent the central values and uncertainties of the FONLL prediction [28]. The error bars include both the statistical and systematic uncertainties. |
Fig3a.pdf [65 KiB] HiDef png [171 KiB] Thumbnail [170 KiB] *.C file |

|
|
Fig3b.pdf [61 KiB] HiDef png [189 KiB] Thumbnail [201 KiB] *.C file |
|
|
|
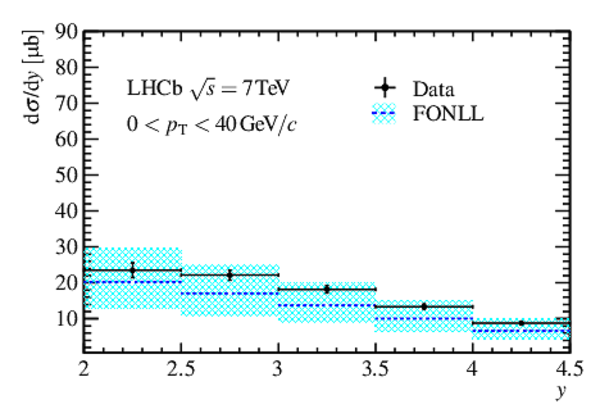
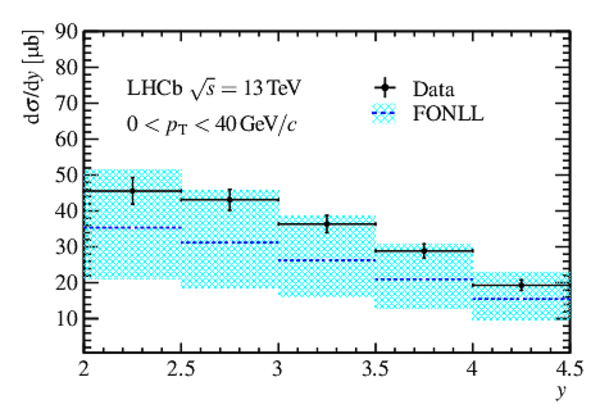
Measured $ B ^\pm$ differential cross-section at $13\mathrm{ Te V} $ as a function of (left) $p_{\mathrm{ T}}$ or (right) $y$. The black points represent the measured values, the blue-dashed line and cyan band represent the central values and uncertainties of the FONLL prediction [28]. The error bars include both the statistical and systematic uncertainties. |
Fig4a.pdf [65 KiB] HiDef png [176 KiB] Thumbnail [174 KiB] *.C file |

|
|
Fig4b.pdf [61 KiB] HiDef png [228 KiB] Thumbnail [243 KiB] *.C file |
|
|
|
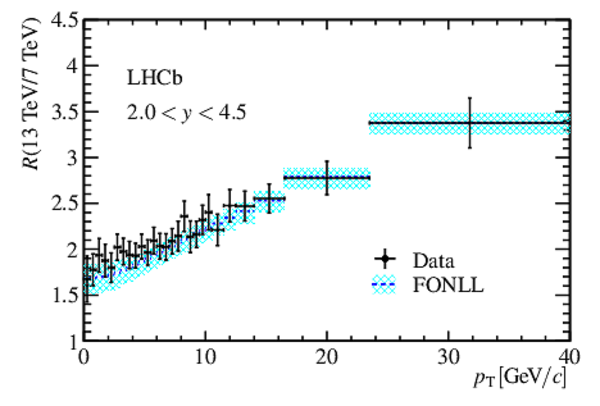
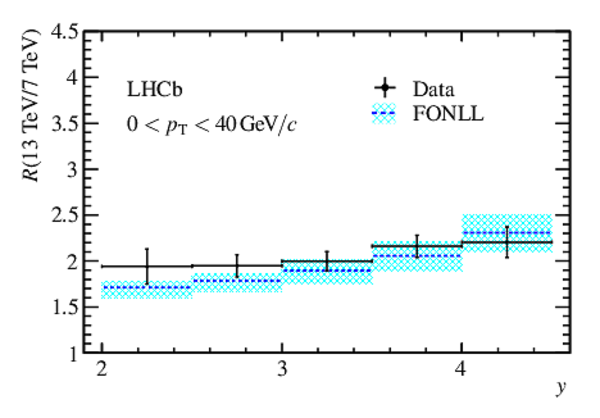
Ratio of the $ B ^\pm$ cross-section at $13\mathrm{ Te V} $ to that at $7\mathrm{ Te V} $ as a function of (left) $p_{\mathrm{ T}}$ or (right) $y$. The black points represent the measured values, the blue-dashed line and cyan band represent the central values and uncertainties of the FONLL prediction [28]. |
Fig5a.pdf [53 KiB] HiDef png [181 KiB] Thumbnail [181 KiB] *.C file |
|
|
Fig5b.pdf [41 KiB] HiDef png [145 KiB] Thumbnail [154 KiB] *.C file |
|
|
|
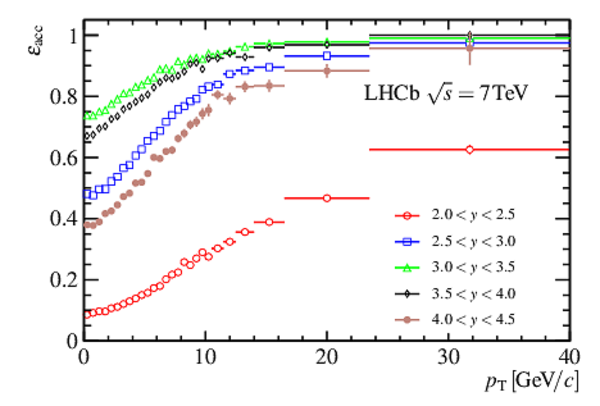
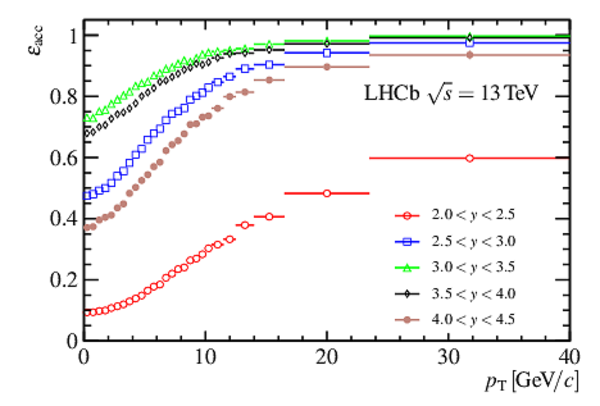
Measured acceptance efficiency of $ B ^\pm$ events at (left) $7\mathrm{ Te V} $ and (right) $13\mathrm{ Te V} $ as a function of $p_{\mathrm{ T}}$ in different $y$ regions. |
Fig6a.pdf [61 KiB] HiDef png [195 KiB] Thumbnail [173 KiB] *.C file |
|
|
Fig6b.pdf [61 KiB] HiDef png [192 KiB] Thumbnail [172 KiB] *.C file |
|
|
|
Animated gif made out of all figures. |
PAPER-2017-037.gif Thumbnail |

|
![HiDef png [289 KiB]](Directory_LHCb-PAPER-2017-037/hidef_Fig1a.png)
![HiDef png [276 KiB]](Directory_LHCb-PAPER-2017-037/hidef_Fig1b.png)
![HiDef png [211 KiB]](Directory_LHCb-PAPER-2017-037/hidef_Fig2a.png)
![HiDef png [210 KiB]](Directory_LHCb-PAPER-2017-037/hidef_Fig2b.png)
![HiDef png [171 KiB]](Directory_LHCb-PAPER-2017-037/hidef_Fig3a.png)
![HiDef png [189 KiB]](Directory_LHCb-PAPER-2017-037/hidef_Fig3b.png)
![HiDef png [176 KiB]](Directory_LHCb-PAPER-2017-037/hidef_Fig4a.png)
![HiDef png [228 KiB]](Directory_LHCb-PAPER-2017-037/hidef_Fig4b.png)
![HiDef png [181 KiB]](Directory_LHCb-PAPER-2017-037/hidef_Fig5a.png)
![HiDef png [145 KiB]](Directory_LHCb-PAPER-2017-037/hidef_Fig5b.png)
![HiDef png [195 KiB]](Directory_LHCb-PAPER-2017-037/hidef_Fig6a.png)
![HiDef png [192 KiB]](Directory_LHCb-PAPER-2017-037/hidef_Fig6b.png)
Tables and captions
|
Summary of relative systematic uncertainties on the integrated production cross-sections at {$\sqrt{s}=$ 7} and $13\mathrm{ Te V} $, and the ratio of the cross-sections $R(13\mathrm{ Te V} /7\mathrm{ Te V} )$. |
Table_1.pdf [41 KiB] HiDef png [92 KiB] Thumbnail [45 KiB] tex code |

|
|
Measured $\varepsilon_{\text{tot}}$ of $ B ^\pm$ events at $7\mathrm{ Te V} $, in the bins of $ B ^\pm$ $p_{\mathrm{ T}}$ and $y$. The efficiencies and uncertainties are in percent. |
Table_2.pdf [50 KiB] HiDef png [209 KiB] Thumbnail [100 KiB] tex code |

|
|
Measured $\varepsilon_{\text{tot}}$ of $ B ^\pm$ events at $13\mathrm{ Te V} $, in the bins of $ B ^\pm$ $p_{\mathrm{ T}}$ and $y$. The efficiencies and uncertainties are in percent. |
Table_3.pdf [50 KiB] HiDef png [201 KiB] Thumbnail [97 KiB] tex code |

|
|
Measured $ B ^\pm$ double-differential cross-section (in units of $\mathrm{ nb}$ ) at $7\mathrm{ Te V} $, as a function of $p_{\mathrm{ T}}$ and $y$, in the rapidity regions of $2.0<y<2.5$, $2.5<y<3.0$, and $3.0<y<3.5$. |
Table_4.pdf [50 KiB] HiDef png [311 KiB] Thumbnail [153 KiB] tex code |

|
|
Measured $ B ^\pm$ double-differential cross-section (in units of $\mathrm{ nb}$ ) at $7\mathrm{ Te V} $, as a function of $p_{\mathrm{ T}}$ and $y$, in the rapidity regions of $3.5<y<4.0$ and $4.0<y<4.5$. |
Table_5.pdf [50 KiB] HiDef png [311 KiB] Thumbnail [167 KiB] tex code |

|
|
Measured $ B ^\pm$ double-differential cross-section (in units of $\mathrm{ nb}$ ) at $13\mathrm{ Te V} $, as a function of $p_{\mathrm{ T}}$ and $y$, in the rapidity regions of $2.0<y<2.5$, $2.5<y<3.0$, and $3.0<y<3.5$. |
Table_6.pdf [50 KiB] HiDef png [307 KiB] Thumbnail [154 KiB] tex code |

|
|
Measured $ B ^\pm$ double-differential cross-section (in units of $\mathrm{ nb}$ ) at $13\mathrm{ Te V} $, as a function of $p_{\mathrm{ T}}$ and $y$, in the rapidity regions of $3.5<y<4.0$ and $4.0<y<4.5$. |
Table_7.pdf [50 KiB] HiDef png [336 KiB] Thumbnail [166 KiB] tex code |

|
|
Measured $ B ^\pm$ differential cross-sections (in units of $\mathrm{ nb} $) at $7\mathrm{ Te V} $ and $13\mathrm{ Te V} $ as functions of $p_{\mathrm{ T}}$ in the range $2.0<y<4.5$. The cross-section ratio between $13\mathrm{ Te V} $ and $7\mathrm{ Te V} $ is also presented. |
Table_8.pdf [50 KiB] HiDef png [322 KiB] Thumbnail [157 KiB] tex code |

|
|
Measured $ B ^\pm$ differential cross-sections (in units of $ {\mathrm{ \upmu b}} $) at $7\mathrm{ Te V} $ and $13\mathrm{ Te V} $ as functions of $y$ in the $p_{\mathrm{ T}}$ range $0< p_{\mathrm{ T}} <40 {\mathrm{ Ge V /}c} $. The cross-section ratio between $13\mathrm{ Te V} $ and $7\mathrm{ Te V} $ is also presented. |
Table_9.pdf [42 KiB] HiDef png [21 KiB] Thumbnail [32 KiB] tex code |

|
![HiDef png [92 KiB]](Directory_LHCb-PAPER-2017-037/hidef_Table_1.png)
![HiDef png [209 KiB]](Directory_LHCb-PAPER-2017-037/hidef_Table_2.png)
![HiDef png [201 KiB]](Directory_LHCb-PAPER-2017-037/hidef_Table_3.png)
![HiDef png [311 KiB]](Directory_LHCb-PAPER-2017-037/hidef_Table_4.png)
![HiDef png [311 KiB]](Directory_LHCb-PAPER-2017-037/hidef_Table_5.png)
![HiDef png [307 KiB]](Directory_LHCb-PAPER-2017-037/hidef_Table_6.png)
![HiDef png [336 KiB]](Directory_LHCb-PAPER-2017-037/hidef_Table_7.png)
![HiDef png [322 KiB]](Directory_LHCb-PAPER-2017-037/hidef_Table_8.png)
![HiDef png [21 KiB]](Directory_LHCb-PAPER-2017-037/hidef_Table_9.png)
Created on 26 April 2024.