Information
LHCb-PAPER-2017-039
CERN-EP-2017-325
arXiv:1712.07938 [PDF]
(Submitted on 21 Dec 2017)
Phys. Rev. D 97, 091101
Inspire 1644610
Tools
Abstract
A search for the flavor-changing neutral-current decay $\Lambda_{c}^{+} \to p\mu^+\mu^-$ is reported using a data set corresponding to an integrated luminosity of $3.0\rm fb^{-1}$ collected by the LHCb collaboration. No significant signal is observed outside of the dimuon mass regions around the $\phi$ and $\omega$ resonances and an upper limit is placed on the branching fraction of $\mathcal{B} (\Lambda_{c}^{+} \to p\mu^+\mu^-) < 7.7 (9.6)\times 10^{-8} {\rm at} 90\% (95\%)$ confidence level. A significant signal is observed in the $\omega$ dimuon mass region for the first time.
Figures and captions
|
Mass distribution of $\Lambda ^+_ c \rightarrow p \mu ^+\mu ^- $ candidates in the $\phi$ region after the first BDT requirement. The solid line shows the result of the fit described in the text, while the dashed line indicates the background component. |
Lc2pPh[..].pdf [19 KiB] HiDef png [161 KiB] Thumbnail [151 KiB] |

|
|
The efficiency weights for $\Lambda ^+_ c \rightarrow p \mu ^+\mu ^- $ as a function of the dimuon invariant mass squared $m^{2}(\mu ^+\mu ^- )$ and by the invariant mass of the proton and the negatively charged muon squared $m^{2}( p \mu^-)$. The weights are normalized to the average efficiency. |
dalitz[..].pdf [14 KiB] HiDef png [83 KiB] Thumbnail [51 KiB] |

|
|
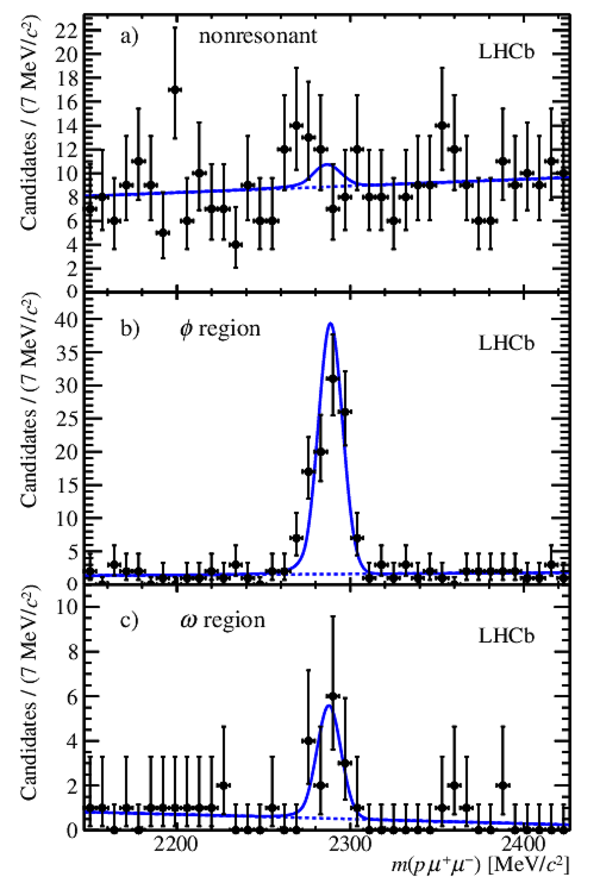
Mass distribution for selected $ p $ $\mu ^+\mu ^-$ candidates in the three regions of the dimuon invariant mass: a) nonresonant region, b) $\phi$ region, c) $\omega$ region. The solid lines show the results of the fit as described in the text. The dashed lines indicate the background component. |
pmumu_[..].pdf [33 KiB] HiDef png [425 KiB] Thumbnail [453 KiB] |
|
|
Invariant mass distribution $m({\mu ^+\mu ^- })$ for $\Lambda ^+_ c \rightarrow p \mu ^+\mu ^- $ candidates with mass $\pm 25 {\mathrm{ Me V /}c^2} $ around the $\Lambda ^+_ c $ mass. The solid line shows the result of the fit, while the dashed line indicates the background component. |
Lc_mum[..].pdf [18 KiB] HiDef png [166 KiB] Thumbnail [141 KiB] |

|
|
The CL$_{\rm s}$ value as a function of the $ {\cal B}(\Lambda ^+_ c \rightarrow p \mu ^+\mu ^- ) $ branching fraction. The median expected value of an ensemble (assuming no signal component) is shown by the dashed line, with the $\pm 1\sigma$ and $\pm 2\sigma$ regions shaded. The observed distribution is shown by the solid line. |
Lc2pmu[..].pdf [17 KiB] HiDef png [178 KiB] Thumbnail [139 KiB] |

|
|
Animated gif made out of all figures. |
PAPER-2017-039.gif Thumbnail |

|
![HiDef png [161 KiB]](Directory_LHCb-PAPER-2017-039/hidef_Lc2pPhi_presel.png)
![HiDef png [83 KiB]](Directory_LHCb-PAPER-2017-039/hidef_dalitz_weights.png)
![HiDef png [425 KiB]](Directory_LHCb-PAPER-2017-039/hidef_pmumu_masses.png)
![HiDef png [166 KiB]](Directory_LHCb-PAPER-2017-039/hidef_Lc_mumu_mass_fit_sel.png)
![HiDef png [178 KiB]](Directory_LHCb-PAPER-2017-039/hidef_Lc2pmumu_bf90.png)
Tables and captions
|
Systematic uncertainties on the efficiency ratio used in the determination of the branching fraction in the nonresonant and $\omega$ regions. |
Table_1.pdf [67 KiB] HiDef png [44 KiB] Thumbnail [21 KiB] tex code |

|
![HiDef png [44 KiB]](Directory_LHCb-PAPER-2017-039/hidef_Table_1.png)
Created on 27 April 2024.