Information
LHCb-PAPER-2017-042
CERN-EP-2017-306
arXiv:1712.04094 [PDF]
(Submitted on 12 Dec 2017)
JHEP 01 (2018) 138
Inspire 1642726
Tools
Abstract
A search is performed in the invariant mass spectrum of the $B_c^{+}\pi^{+}\pi^{-}$ system for the excited $B_c^{+}$ states $B_c(2^{1}S_{0})^+$ and $B_c(2^{3}S_{1})^+$ using a data sample of $pp$ collisions collected by the LHCb experiment at the centre-of-mass energy of $\sqrt{s} = 8 {\mathrm{TeV}}$, corresponding to an integrated luminosity of $2 {\mathrm{fb^{-1}}}$. No evidence is seen for either state. Upper limits on the ratios of the production cross-sections of the $B_c(2^{1}S_{0})^+$ and $B_c(2^{3}S_{1})^+$ states times the branching fractions of ${B_c(2^{1}S_{0})^+} \to {B_c^{+}\pi^{+}\pi^{-}}$ and ${B_c(2^{3}S_{1})^+} \to {B_c^{*+}\pi^{+}\pi^{-}}$ over the production cross-section of the $B_c^{+}$ state are given as a function of their masses. They are found to be between 0.02 and 0.14 at $95\%$ confidence level for $B_c(2^{1}S_{0})^+$ and $B_c(2^{3}S_{1})^+$ in the mass ranges $[6830, 6890] {\mathrm{MeV}}/c^{2}$ and $[6795,6890] {\mathrm{MeV}}/c^{2}$, respectively.
Figures and captions
|
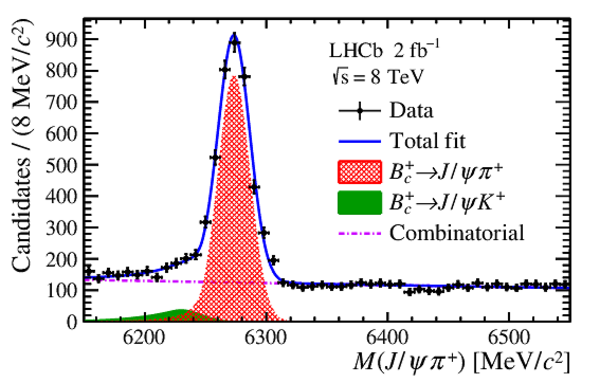
Invariant mass distribution of the selected $ B _ c ^+ \rightarrow { J \mskip -3mu/\mskip -2mu\psi \mskip 2mu} \pi ^+ $ candidates. The points with error bars represent the data. The blue solid line is the fit to data. The red cross-hatched area shows the signal. The green shaded area represents the $ B _ c ^+ \rightarrow { J \mskip -3mu/\mskip -2mu\psi \mskip 2mu} K^{+}$ background. The violet dash-dotted line is the combinatorial background. |
Fig1.pdf [30 KiB] HiDef png [421 KiB] Thumbnail [271 KiB] |
|
|
Mass distributions of the selected $ B _ c ^+ \pi ^+ \pi ^- $ candidates in the range $[6795,6890] {\mathrm{ Me V /}c^2} $ for the four MLP categories. |
Fig2a.pdf [15 KiB] HiDef png [105 KiB] Thumbnail [63 KiB] |

|
|
Fig2b.pdf [16 KiB] HiDef png [113 KiB] Thumbnail [67 KiB] |

|
|
|
Fig2c.pdf [15 KiB] HiDef png [104 KiB] Thumbnail [61 KiB] |

|
|
|
Fig2d.pdf [15 KiB] HiDef png [102 KiB] Thumbnail [58 KiB] |

|
|
|
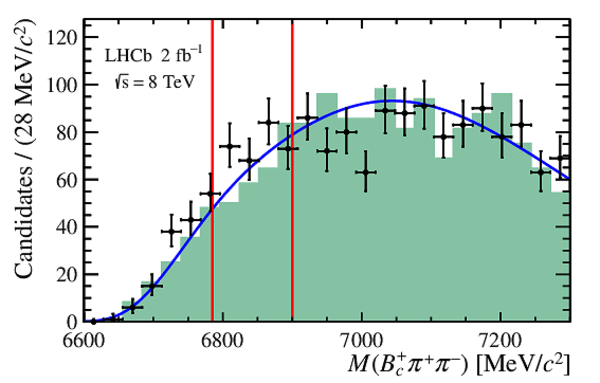
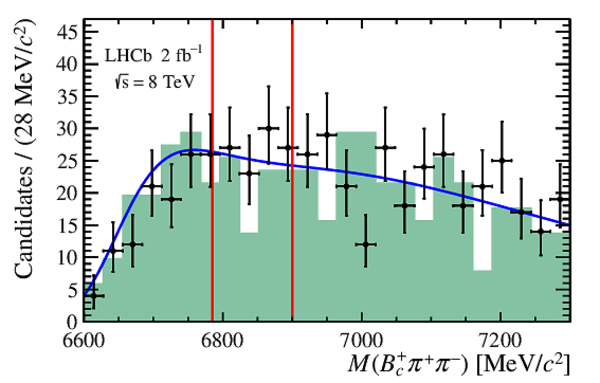
The $ M( B _ c ^+ \pi ^+ \pi ^- )$ distributions in the same-sign (darkgreen shaded areas) and data (points with error bars) samples in the range $[6600,7300] {\mathrm{ Me V /}c^2} $ with the background model (blue solid line) overlaid, for the four MLP categories. The areas between the two vertical red lines are the signal regions. |
Fig3a.pdf [17 KiB] HiDef png [201 KiB] Thumbnail [174 KiB] |

|
|
Fig3b.pdf [17 KiB] HiDef png [199 KiB] Thumbnail [171 KiB] |
|
|
|
Fig3c.pdf [17 KiB] HiDef png [204 KiB] Thumbnail [178 KiB] |

|
|
|
Fig3d.pdf [17 KiB] HiDef png [207 KiB] Thumbnail [183 KiB] |
|
|
|
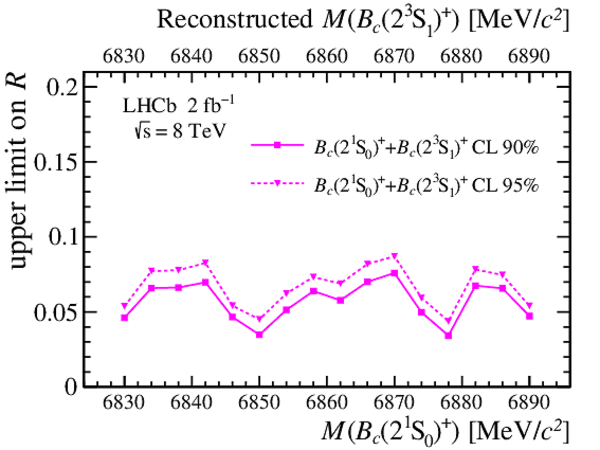
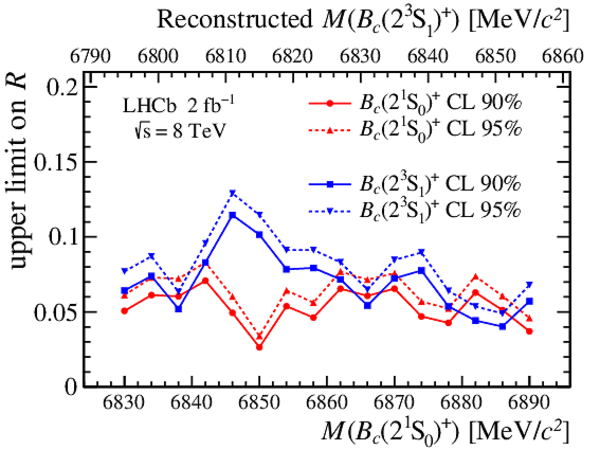
The upper limits on the ratio $\mathcal{R}( B _ c ^{(*)}(2S)^+ )$ at $95\%$ and $90\%$ confidence levels under different mass splitting $\Delta M$ hypotheses. |
Fig4a.pdf [15 KiB] HiDef png [248 KiB] Thumbnail [231 KiB] |
|
|
Fig4b.pdf [16 KiB] HiDef png [328 KiB] Thumbnail [285 KiB] |

|
|
|
Fig4c.pdf [16 KiB] HiDef png [329 KiB] Thumbnail [285 KiB] |

|
|
|
Fig4d.pdf [16 KiB] HiDef png [332 KiB] Thumbnail [287 KiB] |
|
|
|
Animated gif made out of all figures. |
PAPER-2017-042.gif Thumbnail |

|
![HiDef png [421 KiB]](Directory_LHCb-PAPER-2017-042/hidef_Fig1.png)
![HiDef png [105 KiB]](Directory_LHCb-PAPER-2017-042/hidef_Fig2a.png)
![HiDef png [113 KiB]](Directory_LHCb-PAPER-2017-042/hidef_Fig2b.png)
![HiDef png [104 KiB]](Directory_LHCb-PAPER-2017-042/hidef_Fig2c.png)
![HiDef png [102 KiB]](Directory_LHCb-PAPER-2017-042/hidef_Fig2d.png)
![HiDef png [201 KiB]](Directory_LHCb-PAPER-2017-042/hidef_Fig3a.png)
![HiDef png [199 KiB]](Directory_LHCb-PAPER-2017-042/hidef_Fig3b.png)
![HiDef png [204 KiB]](Directory_LHCb-PAPER-2017-042/hidef_Fig3c.png)
![HiDef png [207 KiB]](Directory_LHCb-PAPER-2017-042/hidef_Fig3d.png)
![HiDef png [248 KiB]](Directory_LHCb-PAPER-2017-042/hidef_Fig4a.png)
![HiDef png [328 KiB]](Directory_LHCb-PAPER-2017-042/hidef_Fig4b.png)
![HiDef png [329 KiB]](Directory_LHCb-PAPER-2017-042/hidef_Fig4c.png)
![HiDef png [332 KiB]](Directory_LHCb-PAPER-2017-042/hidef_Fig4d.png)
Tables and captions
|
Efficiencies for the $ B _ c ^{(*)}(2S)^+ $ states in the regions $ p_{\mathrm{ T}} \in [0,20] {\mathrm{ Ge V /}c} $ and $y \in [2.0,4.5]$ for each MLP category. The efficiencies obtained before applying the MLP classifier are $0.0091 \pm 0.0002$ and $0.0086 \pm 0.0001$ for $ B _ c (2S)^+ $ and $ B _ c ^{*}(2S)^+ $, respectively. The uncertainties are statistical only, and are due to the limited size of the simulated sample. |
Table_1.pdf [66 KiB] HiDef png [42 KiB] Thumbnail [19 KiB] tex code |

|
|
Summary of the systematic uncertainties entering the upper limit calculation for the four MLP categories. |
Table_2.pdf [90 KiB] HiDef png [67 KiB] Thumbnail [30 KiB] tex code |

|
|
Comparison of the $\mathcal{R}$ value between the LHCb upper limits at 95% CL and the ATLAS measurement [18], where $0 < \varepsilon_{7,8} \leq 1$ are the relative efficiencies of reconstructing the $ B _ c ^{(*)}(2S)^+ $ candidates with respect to the $ B _ c ^+ $ signals for the 7 and $8 {\mathrm{ Te V} }$ data, respectively. |
Table_3.pdf [51 KiB] HiDef png [33 KiB] Thumbnail [16 KiB] tex code |

|
![HiDef png [42 KiB]](Directory_LHCb-PAPER-2017-042/hidef_Table_1.png)
![HiDef png [67 KiB]](Directory_LHCb-PAPER-2017-042/hidef_Table_2.png)
![HiDef png [33 KiB]](Directory_LHCb-PAPER-2017-042/hidef_Table_3.png)
Supplementary Material [file]
| Supplementary material full pdf |
Supple[..].pdf [160 KiB] |
|
|
This ZIP file contains supplemetary material for the publication LHCb-PAPER-2017-042. The files are: Supplementary.pdf : An overview of the extra figure and contents *.pdf, *.png, *.eps, *.C : The figure in variuous formats |
Fig1.pdf [16 KiB] HiDef png [195 KiB] Thumbnail [170 KiB] *C file |
|
![HiDef png [195 KiB]](Directory_LHCb-PAPER-2017-042/supplementary/hidef_Fig1.png)
Created on 26 April 2024.