A measurement of the $CP$ asymmetry difference in $\varLambda_{c}^{+} \to pK^{-}K^{+}$ and $p\pi^{-}\pi^{+}$ decays
[to restricted-access page]Information
LHCb-PAPER-2017-044
CERN-EP-2017-316
arXiv:1712.07051 [PDF]
ancillary files
(Submitted on 19 Dec 2017)
JHEP 03 (2018) 182
Inspire 1644103
Tools
Abstract
The difference between the $CP$ asymmetries in the decays $\varLambda_{c}^{+} \to pK^{-}K^{+}$ and $\varLambda_{c}^{+} \to p\pi^{-}\pi^{+}$ is presented. Proton-proton collision data taken at centre-of-mass energies of $7$ and $8 \mathrm{TeV}$ collected by the LHCb detector in 2011 and 2012 are used, corresponding to an integrated luminosity of $3 \mathrm{fb}^{-1}$. The $\varLambda_{c}^{+}$ candidates are reconstructed as part of the $\varLambda_{b}^{0} \to \varLambda_{c}^{+}\mu^{-}X$ decay chain. In order to maximize the cancellation of production and detection asymmetries in the difference, the final-state kinematic distributions of the two samples are aligned by applying phase-space-dependent weights to the $\varLambda_{c}^{+} \to p\pi^{-}\pi^{+}$ sample. This alters the definition of the integrated $CP$ asymmetry to $A_{CP}^{\text{wgt}}(p\pi^{-}\pi^{+})$. Both samples are corrected for reconstruction and selection efficiencies across the five-dimensional $\varLambda_{c}^{+}$ decay phase space. The difference in $CP$ asymmetries is found to be \begin{align*} \Delta{A^{\text{wgt}}_{CP}} &= A_{CP}(pK^{-}K^{+}) - A_{CP}^{\text{wgt}}(p\pi^{-}\pi^{+})\\ &= (0.30 \pm 0.91 \pm 0.61) \%, \end{align*} where the first uncertainty is statistical and the second is systematic.
Figures and captions
|
The $ p h^{-} h^{+} $ invariant mass spectra from the fully selected $\Lambda _{ c }^{+} \rightarrow p K ^- K ^+ $ (left) and $\Lambda _{ c }^{+} \rightarrow p\pi ^- \pi ^+ $ (right) datasets summed over all data-taking conditions. The results of the fit to each dataset are shown for illustration. The widths of the signal distributions differ due to the different $Q$-value between the two decays, where the larger value for the $\Lambda _{ c }^{+} \rightarrow p\pi ^- \pi ^+ $ mode results in a broader shape. |
Fig1-left.pdf [28 KiB] HiDef png [414 KiB] Thumbnail [343 KiB] *.C file |

|
|
Fig1-right.pdf [28 KiB] HiDef png [387 KiB] Thumbnail [318 KiB] *.C file |

|
|
|
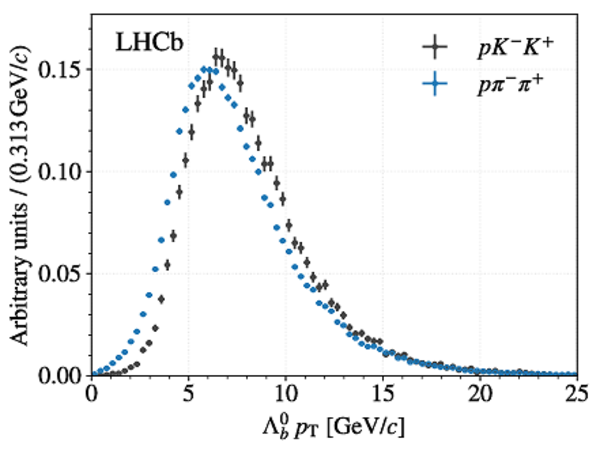
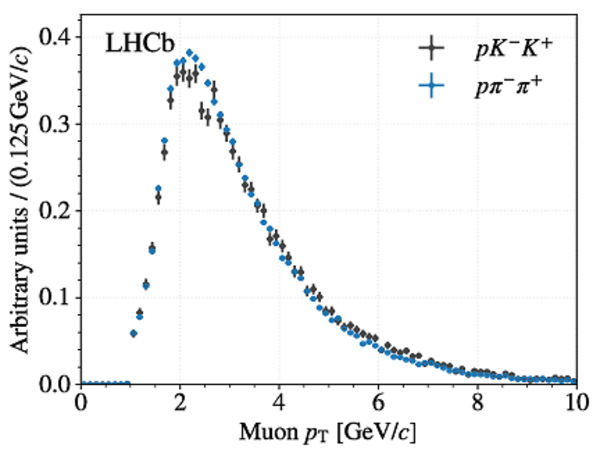
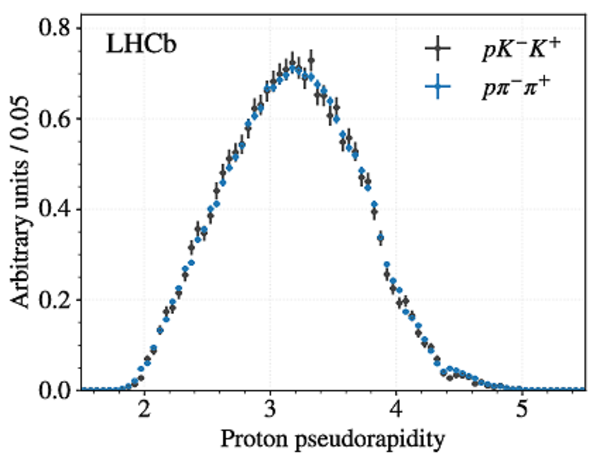
Background-subtracted distributions of the $\Lambda ^0_ b $ candidate transverse momentum (top row), the muon candidate transverse momentum (middle row), and the proton candidate pseudorapidity (bottom row) both before (left column) and after (right column) weighting the $ p\pi ^- \pi ^+ $ sample (blue points) to match the $ p K ^- K ^+ $ sample (black points). The data are summed across all data-taking conditions. |
Fig2-t[..].pdf [25 KiB] HiDef png [283 KiB] Thumbnail [240 KiB] *.C file |
|
|
Fig2-t[..].pdf [25 KiB] HiDef png [281 KiB] Thumbnail [229 KiB] *.C file |

|
|
|
Fig2-m[..].pdf [26 KiB] HiDef png [291 KiB] Thumbnail [247 KiB] *.C file |
|
|
|
Fig2-m[..].pdf [26 KiB] HiDef png [289 KiB] Thumbnail [243 KiB] *.C file |

|
|
|
Fig2-b[..].pdf [24 KiB] HiDef png [277 KiB] Thumbnail [235 KiB] *.C file |

|
|
|
Fig2-b[..].pdf [24 KiB] HiDef png [274 KiB] Thumbnail [225 KiB] *.C file |
|
|
|
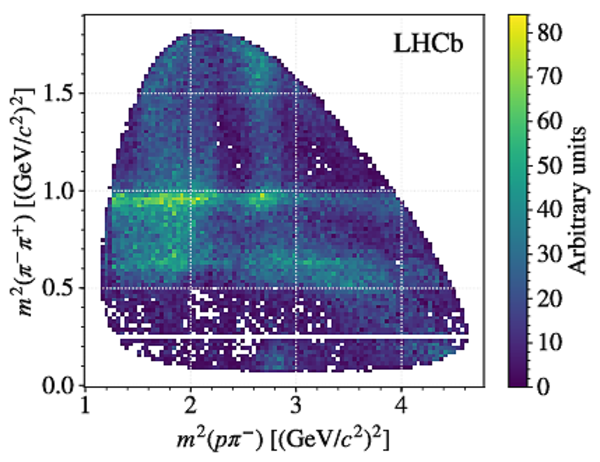
Background-subtracted and efficiency-corrected $\Lambda _{ c }^{+} \rightarrow p K ^- K ^+ $ (left) and $\Lambda _{ c }^{+} \rightarrow p\pi ^- \pi ^+ $ (right) data in the $ m^2 ( p h^{-} )$ -- $ m^2 ( h^{-} h^{+} )$ plane, integrated across all data-taking subsamples. The $ p K ^- K ^+ $ data feature a prominent $\phi \rightarrow K ^- K ^+ $ component, whilst the $ p\pi ^- \pi ^+ $ data exhibit $\rho(770)/\omega(782) \rightarrow \pi ^- \pi ^+ $ and $ f_{0}(980) \rightarrow \pi ^- \pi ^+ $ components. |
Fig3-left.pdf [35 KiB] HiDef png [736 KiB] Thumbnail [581 KiB] *.C file |

|
|
Fig3-right.pdf [44 KiB] HiDef png [980 KiB] Thumbnail [637 KiB] *.C file |
|
|
|
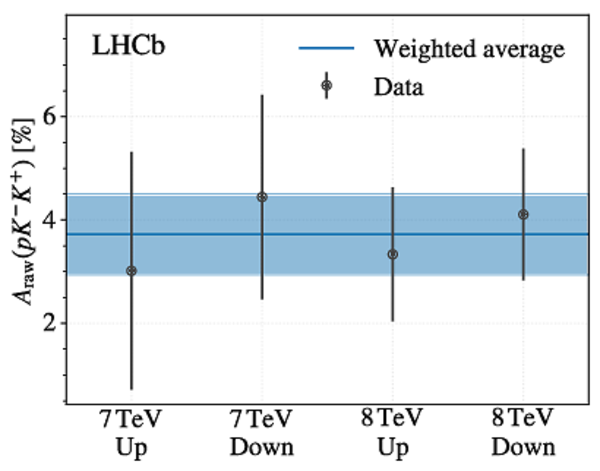
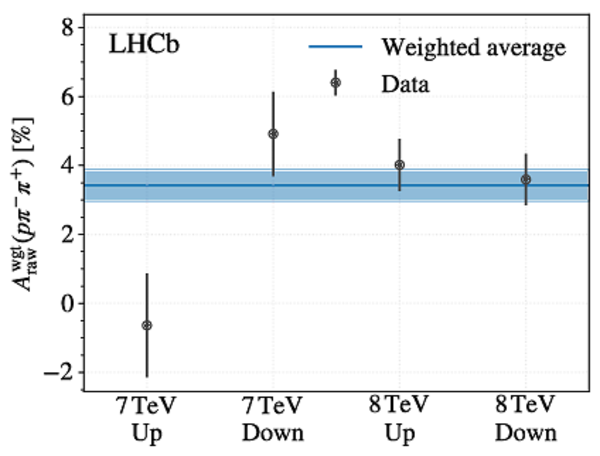
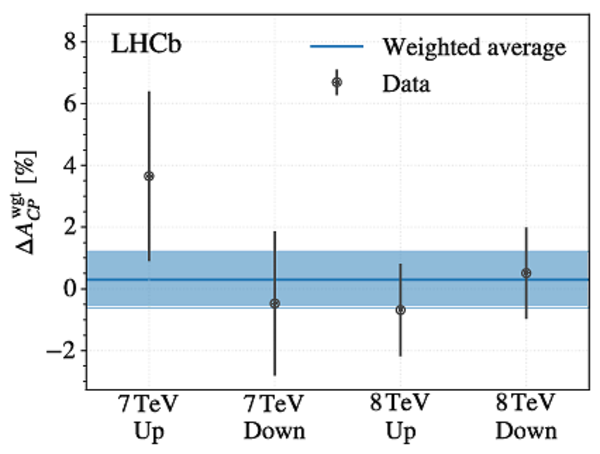
Values of and statistical uncertainties on the asymmetries $ A_{\text{raw}} ( p K ^- K ^+ )$ (top left), $ A_{\text{raw}}^{\text{wgt}} ( p\pi ^- \pi ^+ )$ (top right), and $\Delta A_{ C P }^{\text{wgt}} $ (bottom centre), for the four data subsamples (two centre-of-mass energies, 7 and \SI{8}{\TeV}, and two polarities of the dipole magnet, up and down). For each asymmetry, the average of the four data points, as described in the text, is also shown, where the band indicates the uncertainty. |
Fig4-t[..].pdf [20 KiB] HiDef png [182 KiB] Thumbnail [193 KiB] *.C file |
|
|
Fig4-t[..].pdf [20 KiB] HiDef png [200 KiB] Thumbnail [177 KiB] *.C file |
|
|
|
Fig4-b[..].pdf [20 KiB] HiDef png [209 KiB] Thumbnail [208 KiB] *.C file |
|
|
|
Animated gif made out of all figures. |
PAPER-2017-044.gif Thumbnail |

|
![HiDef png [414 KiB]](Directory_LHCb-PAPER-2017-044/hidef_Fig1-left.png)
![HiDef png [387 KiB]](Directory_LHCb-PAPER-2017-044/hidef_Fig1-right.png)
![HiDef png [283 KiB]](Directory_LHCb-PAPER-2017-044/hidef_Fig2-top_left.png)
![HiDef png [281 KiB]](Directory_LHCb-PAPER-2017-044/hidef_Fig2-top_right.png)
![HiDef png [291 KiB]](Directory_LHCb-PAPER-2017-044/hidef_Fig2-middle_left.png)
![HiDef png [289 KiB]](Directory_LHCb-PAPER-2017-044/hidef_Fig2-middle_right.png)
![HiDef png [277 KiB]](Directory_LHCb-PAPER-2017-044/hidef_Fig2-bottom_left.png)
![HiDef png [274 KiB]](Directory_LHCb-PAPER-2017-044/hidef_Fig2-bottom_right.png)
![HiDef png [736 KiB]](Directory_LHCb-PAPER-2017-044/hidef_Fig3-left.png)
![HiDef png [980 KiB]](Directory_LHCb-PAPER-2017-044/hidef_Fig3-right.png)
![HiDef png [182 KiB]](Directory_LHCb-PAPER-2017-044/hidef_Fig4-top_left.png)
![HiDef png [200 KiB]](Directory_LHCb-PAPER-2017-044/hidef_Fig4-top_right.png)
![HiDef png [209 KiB]](Directory_LHCb-PAPER-2017-044/hidef_Fig4-bottom.png)
Tables and captions
|
Signal yields measured in the fit for each of the four subsets of the $ p K ^- K ^+ $ and $ p\pi ^- \pi ^+ $ data (two centre-of-mass energies, 7 and \SI{8}{\TeV}, and two polarities of the dipole magnet, up and down). The corresponding integrated luminosity of each subset is also given. |
Table_1.pdf [60 KiB] HiDef png [54 KiB] Thumbnail [24 KiB] tex code |

|
|
Systematic uncertainties on $\Delta A_{ C P }^{\text{wgt}} $ and their magnitudes. The dash indicates that the uncertainty is assessed to be negligible. |
Table_2.pdf [52 KiB] HiDef png [34 KiB] Thumbnail [14 KiB] tex code |

|
![HiDef png [54 KiB]](Directory_LHCb-PAPER-2017-044/hidef_Table_1.png)
![HiDef png [34 KiB]](Directory_LHCb-PAPER-2017-044/hidef_Table_2.png)
Created on 27 April 2024.