Updated determination of $D^0$-$\overline{D}{}^0$ mixing and CP violation parameters with $D^0\to K^+\pi^-$ decays
[to restricted-access page]Information
LHCb-PAPER-2017-046
CERN-EP-2017-304
arXiv:1712.03220 [PDF]
(Submitted on 08 Dec 2017)
Phys. Rev. D97 (2018) 031101
Inspire 1642234
Tools
Abstract
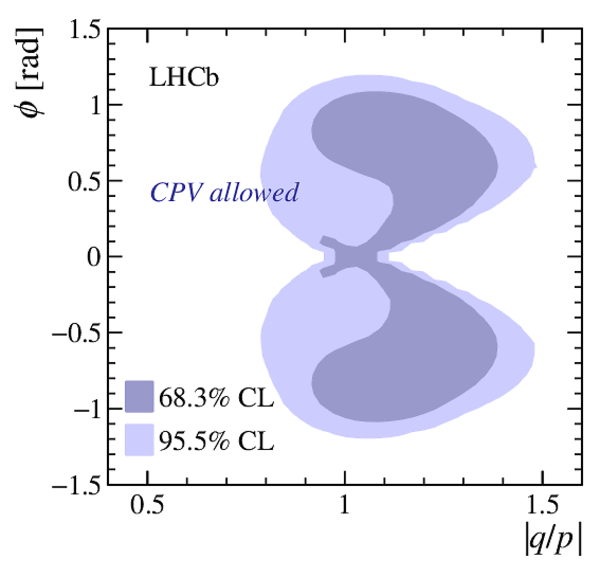
We report measurements of charm-mixing parameters based on the decay-time-dependent ratio of $D^0\to K^+\pi^-$ to $D^0\to K^-\pi^+$ rates. The analysis uses a data sample of proton-proton collisions corresponding to an integrated luminosity of $5.0$ fb$^{-1}$ recorded by the LHCb experiment from 2011 through 2016. Assuming charge-parity (CP) symmetry, the mixing parameters are determined to be $x'^2=(3.9 \pm 2.7) \times10^{-5}$, $y'=(5.28 \pm 0.52) \times 10^{-3}$, and $R_D=(3.454 \pm 0.031)\times10^{-3}$. Without this assumption, the measurement is performed separately for $D^0$ and $\overline{D}{}^0$ mesons, yielding a direct CP-violating asymmetry $A_D =(-0.1\pm9.1)\times10^{-3}$, and magnitude of the ratio of mixing parameters $1.00< |q/p| <1.35$ at the $68.3\%$ confidence level. All results include statistical and systematic uncertainties and improve significantly upon previous single-measurement determinations. No evidence for CP violation in charm mixing is observed.
Figures and captions
|
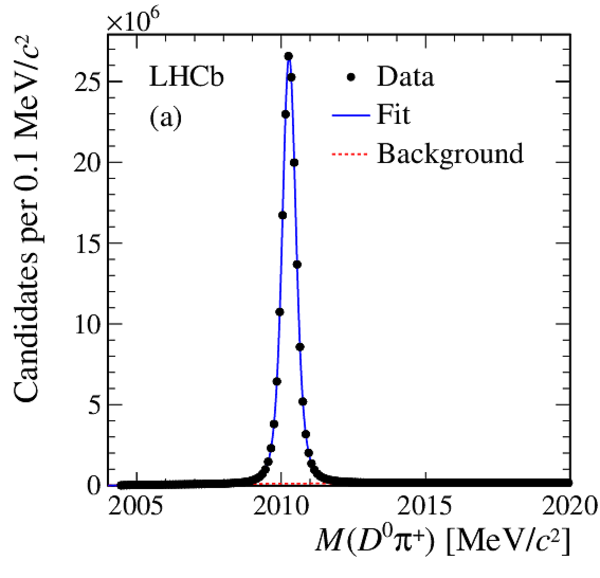
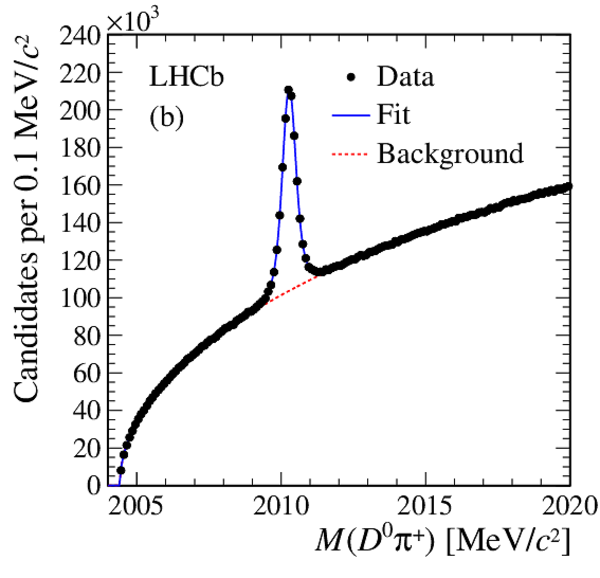
Distribution of $ M( D ^0 \pi_{\rm s} ^+)$ for selected (a) right-sign $ D ^0 \rightarrow K^-\pi^+$ and (b) wrong-sign $ D ^0 \rightarrow K^+\pi^-$ candidates. |
Fig1a.pdf [31 KiB] HiDef png [201 KiB] Thumbnail [165 KiB] *.C file |
|
|
Fig1b.pdf [32 KiB] HiDef png [222 KiB] Thumbnail [213 KiB] *.C file |
|
|
|
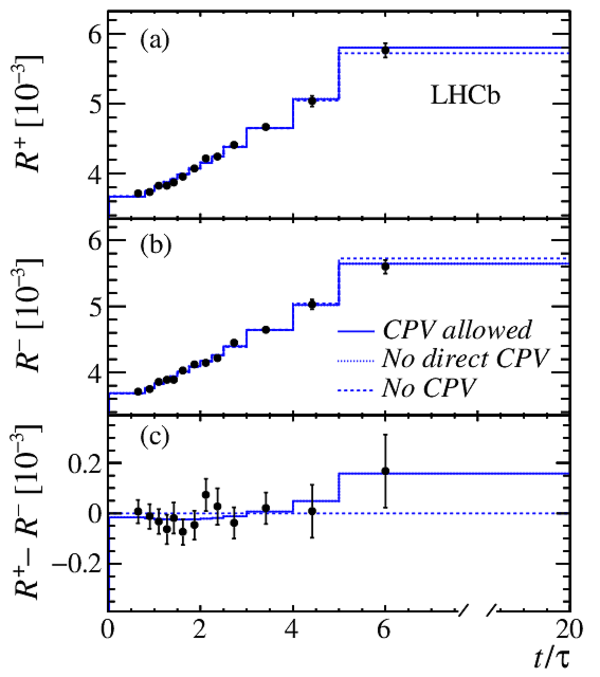
Efficiency-corrected ratios of WS-to-RS yields for (a) $ D ^{*+}$ decays, (b) $ D ^{*-}$ decays, and (c) their differences as functions of decay time in units of $ D ^0$ lifetime. Projections of fits allowing for (dashed line) no $ C P$ violation, (dotted line) no direct $ C P$ violation, and (solid line) direct and indirect $ C P$ violation are overlaid. The last two curves overlap. The abscissa of each data point corresponds to the average decay time over the bin. The error bars indicate the statistical uncertainties. |
Fig2.pdf [14 KiB] HiDef png [245 KiB] Thumbnail [225 KiB] *.C file |
|
|
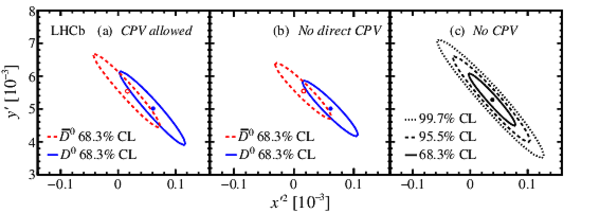
Two-dimensional confidence regions in the $(x'^2,y')$ plane obtained (a) without any restriction on $ C P$ violation, (b) assuming no direct $ C P$ violation, and (c) assuming $ C P$ conservation. The dashed (solid) curves in (a) and (b) indicate the contours of the mixing parameters associated with $\overline{ D }{} {}^0$ ( $ D ^0$ ) decays. The best-fit value for $\overline{ D }{} {}^0$ ( $ D ^0$ ) decays is shown with an open (filled) point. The solid, dashed, and dotted curves in (c) indicate the contours of $ C P$ -averaged mixing parameters at 68.3%, 95.5%, and 99.7% confidence levels (CL), respectively, and the point indicates the best-fit value. |
Fig3.pdf [18 KiB] HiDef png [159 KiB] Thumbnail [134 KiB] *.C file |
|
|
Animated gif made out of all figures. |
PAPER-2017-046.gif Thumbnail |

|
Tables and captions
|
Results of fits for different $ C P$ -violation hypotheses. The first contribution to the uncertainties is statistical and the second systematic. Correlations include both statistical and systematic contributions. |
Table_1.pdf [68 KiB] HiDef png [135 KiB] Thumbnail [61 KiB] tex code |

|
Supplementary Material [file]


![HiDef png [201 KiB]](Directory_LHCb-PAPER-2017-046/hidef_Fig1a.png)
![HiDef png [222 KiB]](Directory_LHCb-PAPER-2017-046/hidef_Fig1b.png)
![HiDef png [245 KiB]](Directory_LHCb-PAPER-2017-046/hidef_Fig2.png)
![HiDef png [159 KiB]](Directory_LHCb-PAPER-2017-046/hidef_Fig3.png)
![HiDef png [135 KiB]](Directory_LHCb-PAPER-2017-046/hidef_Table_1.png)
![HiDef png [233 KiB]](Directory_LHCb-PAPER-2017-046/supplementary/hidef_Fig10.png)
![HiDef png [245 KiB]](Directory_LHCb-PAPER-2017-046/supplementary/hidef_Fig4.png)
![HiDef png [261 KiB]](Directory_LHCb-PAPER-2017-046/supplementary/hidef_Fig5.png)
![HiDef png [122 KiB]](Directory_LHCb-PAPER-2017-046/supplementary/hidef_Fig6_11.png)
![HiDef png [119 KiB]](Directory_LHCb-PAPER-2017-046/supplementary/hidef_Fig6_12.png)
![HiDef png [121 KiB]](Directory_LHCb-PAPER-2017-046/supplementary/hidef_Fig6_15.png)
![HiDef png [120 KiB]](Directory_LHCb-PAPER-2017-046/supplementary/hidef_Fig6_16.png)
![HiDef png [149 KiB]](Directory_LHCb-PAPER-2017-046/supplementary/hidef_Fig7_11.png)
![HiDef png [149 KiB]](Directory_LHCb-PAPER-2017-046/supplementary/hidef_Fig7_12.png)
![HiDef png [152 KiB]](Directory_LHCb-PAPER-2017-046/supplementary/hidef_Fig7_15.png)
![HiDef png [146 KiB]](Directory_LHCb-PAPER-2017-046/supplementary/hidef_Fig7_16.png)
![HiDef png [83 KiB]](Directory_LHCb-PAPER-2017-046/supplementary/hidef_Fig8.png)
![HiDef png [204 KiB]](Directory_LHCb-PAPER-2017-046/supplementary/hidef_Fig9a.png)
![HiDef png [279 KiB]](Directory_LHCb-PAPER-2017-046/supplementary/hidef_Fig9b.png)
![HiDef png [254 KiB]](Directory_LHCb-PAPER-2017-046/supplementary/hidef_LHCb-PAPER-2017-046-supplementary.png)
Created on 27 April 2024.