First measurement of the $CP$-violating phase $\phi_s^{d\overline{d}}$ in $B_s^0\to(K^+\pi^-)(K^-\pi^+)$ decays
[to restricted-access page]Information
LHCb-PAPER-2017-048
CERN-EP-2017-320
arXiv:1712.08683 [PDF]
(Submitted on 22 Dec 2017)
JHEP 03 (2018) 140
Inspire 1644897
Tools
Abstract
A flavour-tagged decay-time-dependent amplitude analysis of $B_s^0\to(K^+\pi^-)(K^-\pi^+)$ decays is presented in the $K^{\pm}\pi^{\mp}$ mass range from 750 to 1600 MeV$/c^2$. The analysis uses $pp$ collision data collected with the LHCb detector at centre-of-mass energies of $7$ and $8$ TeV, corresponding to an integrated luminosity of $3.0$ fb$^{-1}$. Several quasi-two-body decay modes are considered, corresponding to $K^{\pm}\pi^{\mp}$ combinations with spin 0, 1 and 2, which are dominated by the $K_0^*(800)^0$ and $K_0^*(1430)^0$, the $K^*(892)^0$ and the $K_2^*(1430)^0$ resonances, respectively. The longitudinal polarisation fraction for the $B_s^0\to K^*(892)^0\overline{K}^*(892)^0$ decay is measured as $f_L=0.208 \pm 0.032 \pm 0.046$, where the first uncertainty is statistical and the second is systematic. The first measurement of the mixing-induced $CP$-violating phase, $\phi_s^{d\overline{d}}$, in $b\to d\overline{d}s$ transitions is performed, yielding a value of $\phi_s^{d\overline{d}}=-0.10$ $\pm$ $0.13$ (stat) $\pm$ $0.14$ (syst) rad.
Figures and captions
|
Leading-order SM Feynman diagram of the $ { B ^0_ s \rightarrow K ^{*0} \overline{ K }{} {}^{*0} }$ decay. |
Fig1.pdf [9 KiB] HiDef png [198 KiB] Thumbnail [101 KiB] *.C file |

|
|
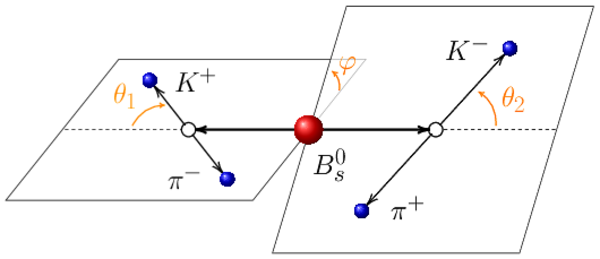
Graphical definition of the angles in the helicity basis. Taking the example of a $ B ^0_ s \rightarrow Q_1 Q_2$ decay (this analysis uses $ B ^0_ s \rightarrow SS$, $ B ^0_ s \rightarrow SV$, $ B ^0_ s \rightarrow VS$, $ B ^0_ s \rightarrow VV$, $ B ^0_ s \rightarrow ST$, $ B ^0_ s \rightarrow TS$, $ B ^0_ s \rightarrow VT$, $ B ^0_ s \rightarrow TV$ and $ B ^0_ s \rightarrow TT$), with each final-state quasi-two-body meson decaying to pseudoscalars ($Q_1 \rightarrow K^+\pi^-$ and $Q_2 \rightarrow K^-\pi^+$), $\theta_1$ ($\theta_2$) is defined as the angle between the directions of motion of $K^+$ ($K^-$) in the $Q_1$ ($Q_2$) rest frame and $Q_1$ ($Q_2$) in the $ B ^0_ s $ rest frame, and $\varphi$ as the angle between the plane defined by $K^+\pi^-$ and the plane defined by $K^-\pi^+$ in the $ B ^0_ s $ rest frame. |
Fig2.pdf [27 KiB] HiDef png [133 KiB] Thumbnail [82 KiB] *.C file |
|
|
Four-body invariant mass distribution on a (left) linear and (right) logarithmic scale superimposed with the mass fit model. |
Fig3a.pdf [30 KiB] HiDef png [312 KiB] Thumbnail [266 KiB] *.C file |

|
|
Fig3b.pdf [28 KiB] HiDef png [291 KiB] Thumbnail [221 KiB] *.C file |

|
|
|
Distribution of the two $(K\pi)$ pair invariant masses, with the signal weights applied, after all of the selection requirements. |
Fig4.pdf [34 KiB] HiDef png [415 KiB] Thumbnail [276 KiB] *.C file |

|
|
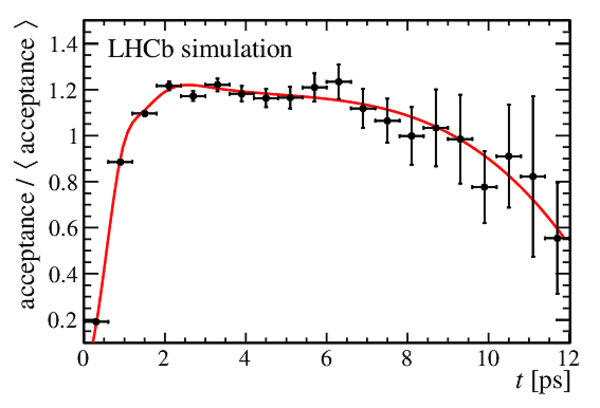
Kinematic acceptance and decay-time distributions evaluated with simulated vector-vector $ { B ^0_ s \rightarrow K ^{*0} \overline{ K }{} {}^{*0} }$ and pure phase-space $ { B ^0_ s \rightarrow ( K ^+ \pi ^- )( K ^- \pi ^+ )}$ candidates scaled by the mean acceptance. In the bottom right plot the decay-time acceptance obtained from the simulated sample is shown as the black points and the parametric form of the acceptance obtained with cubic splines is shown as the red curve. In the other three plots the black points show the acceptance distribution for the masses and angles. The two $\cos\theta$ variables and the two $m(K\pi)$ masses have been averaged for the purpose of illustration. In the fit, the kinematic acceptance enters via the normalisation weights. |
Fig5a.pdf [16 KiB] HiDef png [119 KiB] Thumbnail [76 KiB] *.C file |

|
|
Fig5b.pdf [15 KiB] HiDef png [85 KiB] Thumbnail [53 KiB] *.C file |

|
|
|
Fig5c.pdf [15 KiB] HiDef png [91 KiB] Thumbnail [61 KiB] *.C file |

|
|
|
Fig5d.pdf [16 KiB] HiDef png [145 KiB] Thumbnail [139 KiB] *.C file |
|
|
|
Per-event decay-time resolution, $\sigma_t$, versus the estimated per-event decay-time uncertainty, $\delta_t$, obtained from simulated samples containing both vector-vector resonant $ { B ^0_ s \rightarrow K ^{*0} \overline{ K }{} {}^{*0} }$ and phase-space $ { B ^0_ s \rightarrow K ^+ \pi ^- K ^- \pi ^+ }$ events. |
Fig6.pdf [15 KiB] HiDef png [111 KiB] Thumbnail [105 KiB] *.C file |

|
|
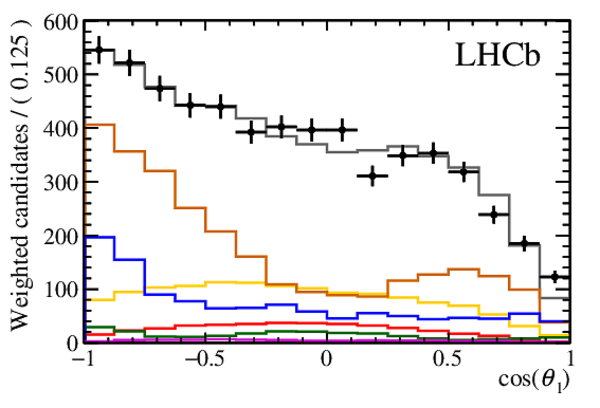
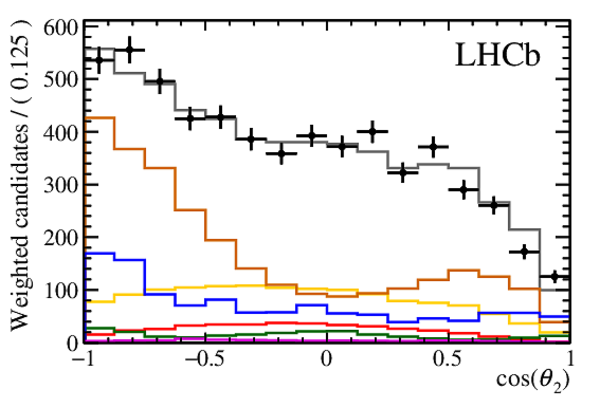
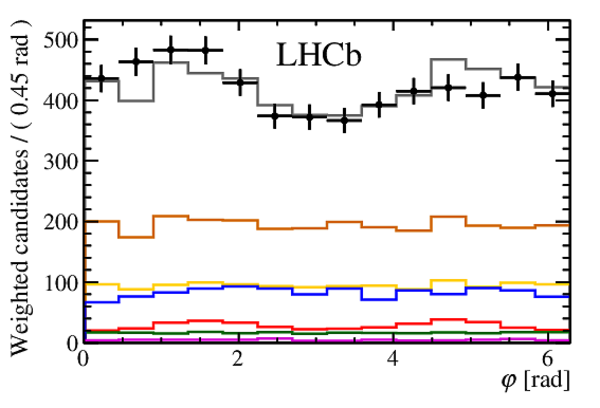
One-dimensional projections of the decay-time-dependent, flavour-tagged fit to (black points) the sPlot weighted data for (top row) the two $(K\pi)$ invariant masses, (middle row) the two $(K\pi)$ decay plane angles, (bottom left) the angle between the two $(K,\pi)$ decay planes and (bottom right) the decay-time. The solid gray line represents the total fit model along with the $ C P$ -averaged components for each contributing decay. |
Fig7a.pdf [16 KiB] HiDef png [194 KiB] Thumbnail [189 KiB] *.C file |

|
|
Fig7b.pdf [16 KiB] HiDef png [169 KiB] Thumbnail [166 KiB] *.C file |

|
|
|
Fig7c.pdf [15 KiB] HiDef png [143 KiB] Thumbnail [144 KiB] *.C file |
|
|
|
Fig7d.pdf [15 KiB] HiDef png [145 KiB] Thumbnail [147 KiB] *.C file |
|
|
|
Fig7e.pdf [15 KiB] HiDef png [128 KiB] Thumbnail [127 KiB] *.C file |
|
|
|
Fig7f.pdf [15 KiB] HiDef png [125 KiB] Thumbnail [122 KiB] *.C file |

|
|
|
Line-shapes of the (left) modulus and (right) phase of the scalar $K\pi$ mass-dependent amplitude. The nominal model is shown with a solid blue line and the model-independent parameterisation, used in systematic studies, is shown with a dashed red line. |
Fig8a.pdf [26 KiB] HiDef png [156 KiB] Thumbnail [141 KiB] *.C file |

|
|
Fig8b.pdf [26 KiB] HiDef png [137 KiB] Thumbnail [119 KiB] *.C file |

|
|
|
Animated gif made out of all figures. |
PAPER-2017-048.gif Thumbnail |

|
![HiDef png [198 KiB]](Directory_LHCb-PAPER-2017-048/hidef_Fig1.png)
![HiDef png [133 KiB]](Directory_LHCb-PAPER-2017-048/hidef_Fig2.png)
![HiDef png [312 KiB]](Directory_LHCb-PAPER-2017-048/hidef_Fig3a.png)
![HiDef png [291 KiB]](Directory_LHCb-PAPER-2017-048/hidef_Fig3b.png)
![HiDef png [415 KiB]](Directory_LHCb-PAPER-2017-048/hidef_Fig4.png)
![HiDef png [119 KiB]](Directory_LHCb-PAPER-2017-048/hidef_Fig5a.png)
![HiDef png [85 KiB]](Directory_LHCb-PAPER-2017-048/hidef_Fig5b.png)
![HiDef png [91 KiB]](Directory_LHCb-PAPER-2017-048/hidef_Fig5c.png)
![HiDef png [145 KiB]](Directory_LHCb-PAPER-2017-048/hidef_Fig5d.png)
![HiDef png [111 KiB]](Directory_LHCb-PAPER-2017-048/hidef_Fig6.png)
![HiDef png [194 KiB]](Directory_LHCb-PAPER-2017-048/hidef_Fig7a.png)
![HiDef png [169 KiB]](Directory_LHCb-PAPER-2017-048/hidef_Fig7b.png)
![HiDef png [143 KiB]](Directory_LHCb-PAPER-2017-048/hidef_Fig7c.png)
![HiDef png [145 KiB]](Directory_LHCb-PAPER-2017-048/hidef_Fig7d.png)
![HiDef png [128 KiB]](Directory_LHCb-PAPER-2017-048/hidef_Fig7e.png)
![HiDef png [125 KiB]](Directory_LHCb-PAPER-2017-048/hidef_Fig7f.png)
![HiDef png [156 KiB]](Directory_LHCb-PAPER-2017-048/hidef_Fig8a.png)
![HiDef png [137 KiB]](Directory_LHCb-PAPER-2017-048/hidef_Fig8b.png)
Tables and captions
|
Quasi-two-body decay channels and corresponding polarisation amplitudes contributing to the $ { B ^0_ s \rightarrow ( K ^+ \pi ^- )( K ^- \pi ^+ )}$ final state in the $K\pi$ mass window from 750 to 1600 $ {\mathrm{ Me V /}c^2}$ . The different contributions are identified by the spin $j_1$ ($j_2$) of the $K^+\pi^-$ ($K^-\pi^+$) pair and the helicity $h$. In cases where more than one amplitude contributes, the polarisations are defined as being longitudinal, parallel, or perpendicular, which are then denoted by $0$, $\parallel$ and $\perp$ respectively, following the definitions given in Ref. \cite{PDG2016}. The subscripts 1 and 2 in the parallel and perpendicular helicities of the tensor-tensor component denote different spin states leading to a parallel or a perpendicular configuration, as discussed in Appendix ???. |
Table_1.pdf [54 KiB] HiDef png [73 KiB] Thumbnail [30 KiB] tex code |

|
|
Yields of the signal decay and the various background components considered in the four-body invariant mass fit. The uncertainties are statistical only. The signal region is defined as $\pm 60$ $ {\mathrm{ Me V /}c^2}$ from the known $ B ^0_ s $ meson mass \cite{PDG2016}. |
Table_2.pdf [54 KiB] HiDef png [102 KiB] Thumbnail [50 KiB] tex code |

|
|
The flavour-tagging performance of the SS and OS tagging algorithms, as well as the combination of both, for the signal data sample used in the analysis. The quoted uncertainty includes both statistical and systematic contributions. |
Table_3.pdf [37 KiB] HiDef png [45 KiB] Thumbnail [23 KiB] tex code |

|
|
Summary of the systematic uncertainties on the two $ C P$ parameters, the $ C P$ -averaged fractions and the strong phase differences (in radians) for each of the components listed in Table ???. |
Table_4.pdf [65 KiB] HiDef png [47 KiB] Thumbnail [15 KiB] tex code |

|
|
Results of the decay-time-dependent amplitude fit to data. The first uncertainty is statistical and the second uncertainty is systematic. |
Table_5.pdf [63 KiB] HiDef png [232 KiB] Thumbnail [119 KiB] tex code |

|
|
Functions containing the angular dependence of the amplitudes, as introduced in Eq. (???). For a discussion on some of the angular terms see Ref. \cite{Bhattacharya:2013sga}. |
Table_6.pdf [63 KiB] HiDef png [197 KiB] Thumbnail [98 KiB] tex code |

|
|
Parameters used in the nominal model for the scalar $K\pi$ mass-dependent amplitude. The correlations among them are found to be small, the largest ones been of the order of $50\%$. |
Table_7.pdf [34 KiB] HiDef png [80 KiB] Thumbnail [34 KiB] tex code |

|
|
Coefficients used in the model-independent parameterisation of the scalar $K\pi$ mass-dependent amplitude. |
Table_8.pdf [36 KiB] HiDef png [53 KiB] Thumbnail [25 KiB] tex code |

|
![HiDef png [73 KiB]](Directory_LHCb-PAPER-2017-048/hidef_Table_1.png)
![HiDef png [102 KiB]](Directory_LHCb-PAPER-2017-048/hidef_Table_2.png)
![HiDef png [45 KiB]](Directory_LHCb-PAPER-2017-048/hidef_Table_3.png)
![HiDef png [47 KiB]](Directory_LHCb-PAPER-2017-048/hidef_Table_4.png)
![HiDef png [232 KiB]](Directory_LHCb-PAPER-2017-048/hidef_Table_5.png)
![HiDef png [197 KiB]](Directory_LHCb-PAPER-2017-048/hidef_Table_6.png)
![HiDef png [80 KiB]](Directory_LHCb-PAPER-2017-048/hidef_Table_7.png)
![HiDef png [53 KiB]](Directory_LHCb-PAPER-2017-048/hidef_Table_8.png)
Supplementary Material [file]
| Supplementary material full pdf |
supple[..].pdf [141 KiB] |
|
|
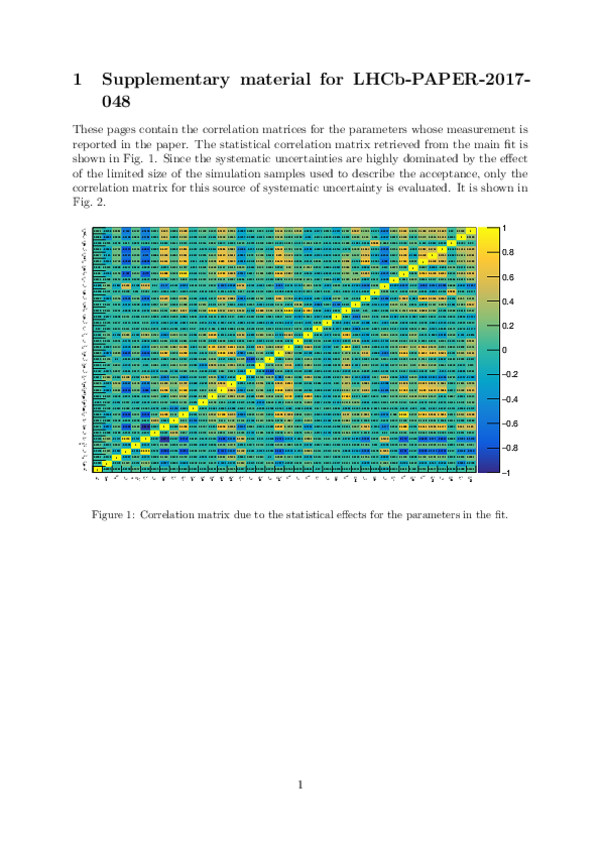
This ZIP file contains supplementary material for the publication LHCb-PAPER-2017-048. The files are: supplementary.pdf : A description of the extra material, consisting on correlation matrices. *.pdf, *.eps, *.C : The correlation matrices in various formats. |
Fig1-S.pdf [52 KiB] HiDef png [2 MiB] Thumbnail [965 KiB] *C file |

|
|
Fig2-S.pdf [52 KiB] HiDef png [2 MiB] Thumbnail [969 KiB] *C file |

|
![HiDef png [2 MiB]](Directory_LHCb-PAPER-2017-048/supplementary/hidef_Fig1-S.png)
![HiDef png [2 MiB]](Directory_LHCb-PAPER-2017-048/supplementary/hidef_Fig2-S.png)
Created on 27 April 2024.