Search for CP violation using triple product asymmetries in $\Lambda^{0}_{b}\to pK^{-}\pi^{+}\pi^{-}$, $\Lambda^{0}_{b}\to pK^{-}K^{+}K^{-}$ and $\Xi^{0}_{b}\to pK^{-}K^{-}\pi^{+}$ decays
[to restricted-access page]Information
LHCb-PAPER-2018-001
CERN-EP-2018-081
arXiv:1805.03941 [PDF]
(Submitted on 10 May 2018)
JHEP 08 (2018) 039
Inspire 1672471
Tools
Abstract
A search for $C$P and $P$ violation using triple-product asymmetries is performed with $\Lambda^{0}_{b}\to pK^{-}\pi^{+}\pi^{-}$, $\Lambda^{0}_{b}\to pK^{-}K^{+}K^{-}$ and $\Xi^{0}_{b}\to pK^{-}K^{-}\pi^{+}$ decays. The data sample corresponds to integrated luminosities of 1.0fb$^{-1}$ and 2.0fb$^{-1}$, recorded with the LHCb detector at centre-of-mass energies of 7TeV and 8TeV, respectively. The $CP$- and $P$-violating asymmetries are measured both integrating over all phase space and in specific phase-space regions. No significant deviation from $CP$ or $P$ symmetry is found. The first observation of $\Lambda^{0}_{b}\to pK^{-}\chi_{c0}(1P)(\to\pi^{+}\pi^{-}, K^{+}K^{-})$ decay is also reported.
Figures and captions
|
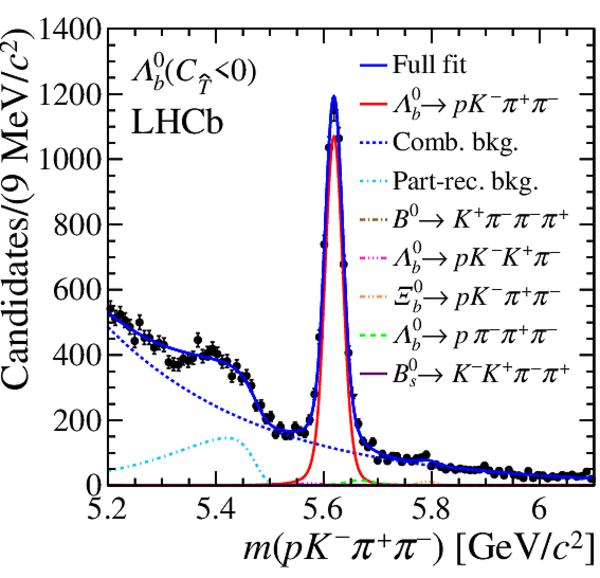
Distributions of the $p K ^- \pi ^+ \pi ^- $ invariant mass in the four samples defined by the $\Lambda ^0_ b $ ( $\overline{\Lambda} {}^0_ b $ ) flavour and the sign of $ C_{\widehat{T}}$ ( $\overline{ C}_{\widehat{T}}$ ). The results of the fit are overlaid as described in the legend. The contribution of the cross-feeds to the fit results is barely visible but is found to be nonnegligible. |
Fig1a.pdf [30 KiB] HiDef png [402 KiB] Thumbnail [334 KiB] *.C file |

|
|
Fig1b.pdf [30 KiB] HiDef png [407 KiB] Thumbnail [336 KiB] *.C file |
|
|
|
Fig1c.pdf [30 KiB] HiDef png [397 KiB] Thumbnail [333 KiB] *.C file |

|
|
|
Fig1d.pdf [30 KiB] HiDef png [399 KiB] Thumbnail [333 KiB] *.C file |

|
|
|
Distributions of the $p K ^- K ^+ K ^- $ invariant mass in the four samples defined by the $\Lambda ^0_ b $ ( $\overline{\Lambda} {}^0_ b $ ) flavour and the sign of $ C_{\widehat{T}}$ ( $\overline{ C}_{\widehat{T}}$ ). The results of the fit are overlaid as described in the legend. The contribution of the cross-feeds to the fit results is barely just visible but is found to be nonnegligible. |
Fig2a.pdf [29 KiB] HiDef png [369 KiB] Thumbnail [317 KiB] *.C file |

|
|
Fig2b.pdf [29 KiB] HiDef png [366 KiB] Thumbnail [318 KiB] *.C file |

|
|
|
Fig2c.pdf [29 KiB] HiDef png [365 KiB] Thumbnail [316 KiB] *.C file |

|
|
|
Fig2d.pdf [29 KiB] HiDef png [372 KiB] Thumbnail [319 KiB] *.C file |

|
|
|
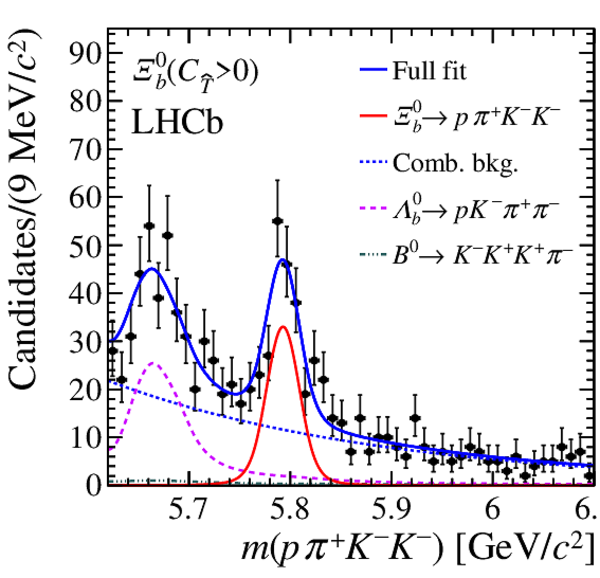
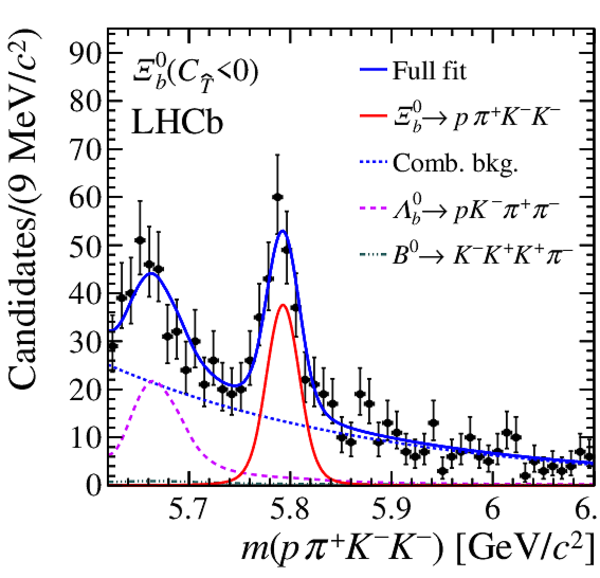
Distributions of the $p K ^- K ^- \pi ^+ $ invariant mass in the four samples defined by the $\Xi ^0_ b $ ( $\overline \Xi {}_ b ^0$ ) flavour and the sign of $ C_{\widehat{T}}$ ( $\overline{ C}_{\widehat{T}}$ ). The results of the fit are overlaid as described in the legend. The contribution of the $ B ^0 \rightarrow K ^- K ^+ K ^+ \pi ^- $ cross-feed to the fit results is barely visible but is found to be nonnegligible. |
Fig3a.pdf [24 KiB] HiDef png [364 KiB] Thumbnail [323 KiB] *.C file |
|
|
Fig3b.pdf [24 KiB] HiDef png [368 KiB] Thumbnail [326 KiB] *.C file |
|
|
|
Fig3c.pdf [24 KiB] HiDef png [368 KiB] Thumbnail [325 KiB] *.C file |

|
|
|
Fig3d.pdf [24 KiB] HiDef png [364 KiB] Thumbnail [323 KiB] *.C file |

|
|
|
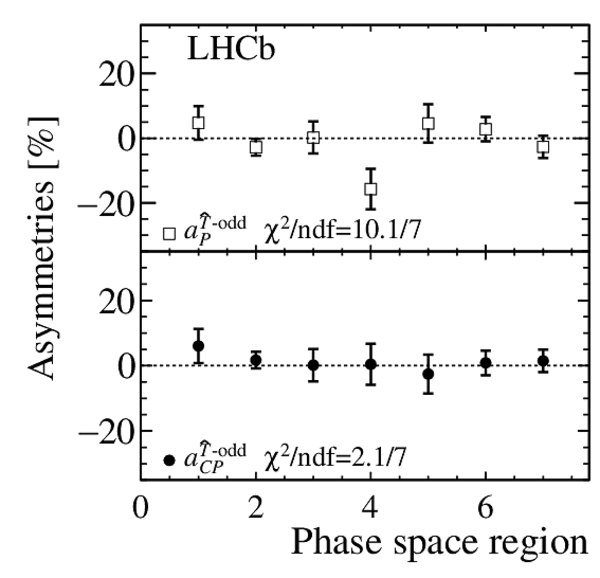
The asymmetries using binning schemes (left) A and (right) B for the $\Lambda ^0_ b \rightarrow p K ^- \pi ^+ \pi ^- $ decay. For $ a_P^{\widehat{T}\text{-odd}}$ ( $ a_ C P ^{\widehat{T}\text{-odd}}$ ), the values of the $\chi^2$ /ndf for the $P$-symmetry ( $ C P$ -symmetry) hypothesis, represented by a dashed line, are quoted. |
Fig4a.pdf [15 KiB] HiDef png [150 KiB] Thumbnail [89 KiB] *.C file |

|
|
Fig4b.pdf [15 KiB] HiDef png [135 KiB] Thumbnail [82 KiB] *.C file |

|
|
|
The asymmetries using binning schemes (left) C and (right) D for $\Lambda ^0_ b \rightarrow p K ^- K ^+ K ^- $ decay. For $ a_P^{\widehat{T}\text{-odd}}$ ( $ a_ C P ^{\widehat{T}\text{-odd}}$ ), the values of the $\chi^2$ /ndf for the $P$-symmetry ( $ C P$ -symmetry) hypothesis, represented by a dashed line, are quoted. |
Fig5a.pdf [14 KiB] HiDef png [138 KiB] Thumbnail [82 KiB] *.C file |
|
|
Fig5b.pdf [15 KiB] HiDef png [134 KiB] Thumbnail [81 KiB] *.C file |

|
|
|
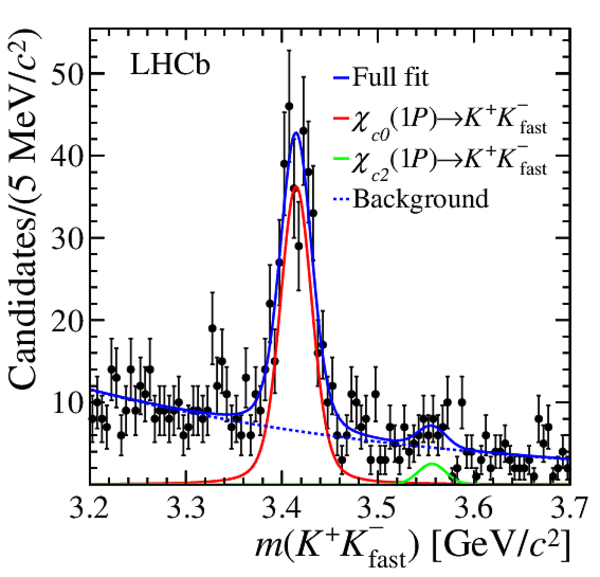
The left (right) plot shows the distribution of the $\pi^+\pi^-$ ($K^{+}K^{-}_{\textrm{fast}}$) reconstructed invariant mass for $\Lambda ^0_ b $ candidates selected within $\pm2\sigma$ of the $\Lambda ^0_ b $ mass peak. The results of the fit for different signal and background components are overlaid as described in the legend. |
Fig6a.pdf [26 KiB] HiDef png [348 KiB] Thumbnail [308 KiB] *.C file |

|
|
Fig6b.pdf [26 KiB] HiDef png [361 KiB] Thumbnail [316 KiB] *.C file |
|
|
|
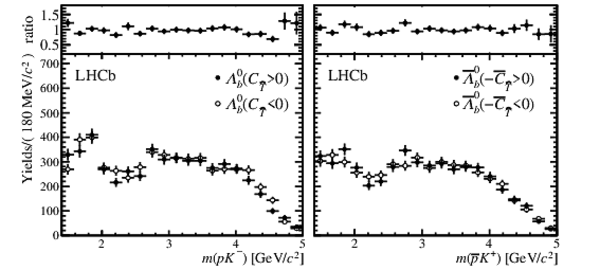
Background-subtracted distributions of $\Lambda ^0_ b $ ( $\overline{\Lambda} {}^0_ b $ ) candidates in different regions of phase space of the $\Lambda ^0_ b \rightarrow p K ^- \pi ^+ \pi ^- $ decay for different values of $ C_{\widehat{T}}$ ( $\overline{ C}_{\widehat{T}}$ ). The background subtraction is performed using the $sPlot$ technique [27]. |
Fig7a.pdf [26 KiB] HiDef png [138 KiB] Thumbnail [75 KiB] *.C file |

|
|
Fig7b.pdf [25 KiB] HiDef png [137 KiB] Thumbnail [75 KiB] *.C file |
|
|
|
Fig7c.pdf [24 KiB] HiDef png [127 KiB] Thumbnail [71 KiB] *.C file |

|
|
|
Fig7d.pdf [25 KiB] HiDef png [125 KiB] Thumbnail [70 KiB] *.C file |

|
|
|
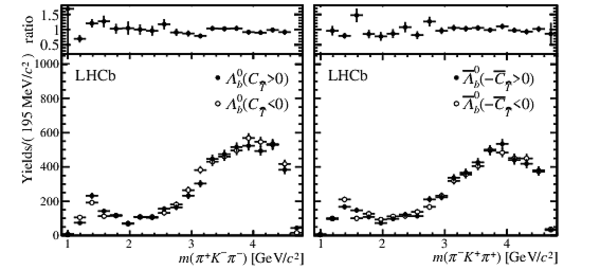
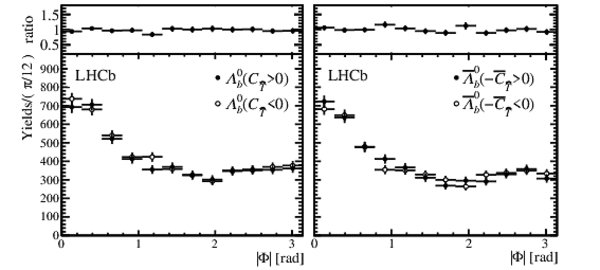
Background-subtracted distributions of $\Lambda ^0_ b $ ( $\overline{\Lambda} {}^0_ b $ ) candidates in different regions of phase space of the $\Lambda ^0_ b \rightarrow p K ^- \pi ^+ \pi ^- $ decay for different values of $ C_{\widehat{T}}$ ( $\overline{ C}_{\widehat{T}}$ ). The background subtraction is performed using the $sPlot$ technique [27]. |
Fig8a.pdf [25 KiB] HiDef png [125 KiB] Thumbnail [69 KiB] *.C file |

|
|
Fig8b.pdf [26 KiB] HiDef png [141 KiB] Thumbnail [76 KiB] *.C file |

|
|
|
Fig8c.pdf [25 KiB] HiDef png [127 KiB] Thumbnail [70 KiB] *.C file |
|
|
|
Fig8d.pdf [22 KiB] HiDef png [115 KiB] Thumbnail [65 KiB] *.C file |
|
|
|
Background-subtracted distributions of $\Lambda ^0_ b $ ( $\overline{\Lambda} {}^0_ b $ ) candidates in different regions of phase space of the $\Lambda ^0_ b \rightarrow p K ^- K ^+ K ^- $ decay for different values of $ C_{\widehat{T}}$ ( $\overline{ C}_{\widehat{T}}$ ). The background subtraction is performed using the $sPlot$ technique [27]. |
Fig9a.pdf [25 KiB] HiDef png [133 KiB] Thumbnail [74 KiB] *.C file |

|
|
Fig9b.pdf [25 KiB] HiDef png [136 KiB] Thumbnail [76 KiB] *.C file |

|
|
|
Fig9c.pdf [25 KiB] HiDef png [135 KiB] Thumbnail [74 KiB] *.C file |
|
|
|
Fig9d.pdf [26 KiB] HiDef png [142 KiB] Thumbnail [78 KiB] *.C file |

|
|
|
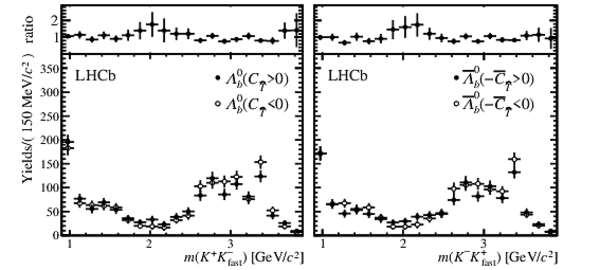
Background-subtracted distributions of $\Lambda ^0_ b $ ( $\overline{\Lambda} {}^0_ b $ ) candidates in different regions of phase space of the $\Lambda ^0_ b \rightarrow p K ^- K ^+ K ^- $ decay for different values of $ C_{\widehat{T}}$ ( $\overline{ C}_{\widehat{T}}$ ). The background subtraction is performed using the $sPlot$ technique [27]. |
Fig10a.pdf [23 KiB] HiDef png [125 KiB] Thumbnail [72 KiB] *.C file |

|
|
Fig10b.pdf [25 KiB] HiDef png [134 KiB] Thumbnail [73 KiB] *.C file |

|
|
|
Fig10c.pdf [25 KiB] HiDef png [133 KiB] Thumbnail [74 KiB] *.C file |

|
|
|
Fig10d.pdf [21 KiB] HiDef png [112 KiB] Thumbnail [64 KiB] *.C file |

|
|
|
Animated gif made out of all figures. |
PAPER-2018-001.gif Thumbnail |

|
![HiDef png [402 KiB]](Directory_LHCb-PAPER-2018-001/hidef_Fig1a.png)
![HiDef png [407 KiB]](Directory_LHCb-PAPER-2018-001/hidef_Fig1b.png)
![HiDef png [397 KiB]](Directory_LHCb-PAPER-2018-001/hidef_Fig1c.png)
![HiDef png [399 KiB]](Directory_LHCb-PAPER-2018-001/hidef_Fig1d.png)
![HiDef png [369 KiB]](Directory_LHCb-PAPER-2018-001/hidef_Fig2a.png)
![HiDef png [366 KiB]](Directory_LHCb-PAPER-2018-001/hidef_Fig2b.png)
![HiDef png [365 KiB]](Directory_LHCb-PAPER-2018-001/hidef_Fig2c.png)
![HiDef png [372 KiB]](Directory_LHCb-PAPER-2018-001/hidef_Fig2d.png)
![HiDef png [364 KiB]](Directory_LHCb-PAPER-2018-001/hidef_Fig3a.png)
![HiDef png [368 KiB]](Directory_LHCb-PAPER-2018-001/hidef_Fig3b.png)
![HiDef png [368 KiB]](Directory_LHCb-PAPER-2018-001/hidef_Fig3c.png)
![HiDef png [364 KiB]](Directory_LHCb-PAPER-2018-001/hidef_Fig3d.png)
![HiDef png [150 KiB]](Directory_LHCb-PAPER-2018-001/hidef_Fig4a.png)
![HiDef png [135 KiB]](Directory_LHCb-PAPER-2018-001/hidef_Fig4b.png)
![HiDef png [138 KiB]](Directory_LHCb-PAPER-2018-001/hidef_Fig5a.png)
![HiDef png [134 KiB]](Directory_LHCb-PAPER-2018-001/hidef_Fig5b.png)
![HiDef png [348 KiB]](Directory_LHCb-PAPER-2018-001/hidef_Fig6a.png)
![HiDef png [361 KiB]](Directory_LHCb-PAPER-2018-001/hidef_Fig6b.png)
![HiDef png [138 KiB]](Directory_LHCb-PAPER-2018-001/hidef_Fig7a.png)
![HiDef png [137 KiB]](Directory_LHCb-PAPER-2018-001/hidef_Fig7b.png)
![HiDef png [127 KiB]](Directory_LHCb-PAPER-2018-001/hidef_Fig7c.png)
![HiDef png [125 KiB]](Directory_LHCb-PAPER-2018-001/hidef_Fig7d.png)
![HiDef png [125 KiB]](Directory_LHCb-PAPER-2018-001/hidef_Fig8a.png)
![HiDef png [141 KiB]](Directory_LHCb-PAPER-2018-001/hidef_Fig8b.png)
![HiDef png [127 KiB]](Directory_LHCb-PAPER-2018-001/hidef_Fig8c.png)
![HiDef png [115 KiB]](Directory_LHCb-PAPER-2018-001/hidef_Fig8d.png)
![HiDef png [133 KiB]](Directory_LHCb-PAPER-2018-001/hidef_Fig9a.png)
![HiDef png [136 KiB]](Directory_LHCb-PAPER-2018-001/hidef_Fig9b.png)
![HiDef png [135 KiB]](Directory_LHCb-PAPER-2018-001/hidef_Fig9c.png)
![HiDef png [142 KiB]](Directory_LHCb-PAPER-2018-001/hidef_Fig9d.png)
![HiDef png [125 KiB]](Directory_LHCb-PAPER-2018-001/hidef_Fig10a.png)
![HiDef png [134 KiB]](Directory_LHCb-PAPER-2018-001/hidef_Fig10b.png)
![HiDef png [133 KiB]](Directory_LHCb-PAPER-2018-001/hidef_Fig10c.png)
![HiDef png [112 KiB]](Directory_LHCb-PAPER-2018-001/hidef_Fig10d.png)
Tables and captions
|
Selection window for control samples used to assess systematic uncertainties and for selection criteria optimization. |
Table_1.pdf [65 KiB] HiDef png [32 KiB] Thumbnail [14 KiB] tex code |

|
|
Measurements of the $ C P$ - and $P$-violating observables $ a_ C P ^{\widehat{T}\text{-odd}}$ and $ a_P^{\widehat{T}\text{-odd}}$ , together with their statistical and systematic uncertainties. |
Table_2.pdf [74 KiB] HiDef png [26 KiB] Thumbnail [11 KiB] tex code |

|
|
Sources of systematic uncertainty and their relative contributions to the total uncertainty. Where present, the value in brackets shows the systematic uncertainty assigned to the measurement in specific phase-space regions. |
Table_3.pdf [74 KiB] HiDef png [32 KiB] Thumbnail [14 KiB] tex code |

|
|
Definition of the 14 regions that form scheme A for the $\Lambda ^0_ b \rightarrow p K ^- \pi ^+ \pi ^- $ decay. Bins $1-4$ focus on the region dominated by the $\Delta(1232)^{++}\rightarrow p\pi ^+ $ resonance. The other 10 bins are defined to study regions where $p K ^- $ resonances are present on either side of the $f_0(980)\rightarrow \pi ^+ \pi ^- $ or $\overline{ K }{} {}^{*}(892)^{0} \rightarrow K ^- \pi ^+ $ resonances. Further splitting depending on $|\Phi|$ is performed to reduce potential dilution of asymmetries, as suggested in Ref. [14]. Masses are in units of $ {\mathrm{ Ge V /}c^2}$ . |
Table_4.pdf [66 KiB] HiDef png [103 KiB] Thumbnail [46 KiB] tex code |

|
|
Measurements of $ a_P^{\widehat{T}\text{-odd}}$ and $ a_ C P ^{\widehat{T}\text{-odd}}$ in specific phase-space regions for the $\Lambda ^0_ b \rightarrow p K ^- \pi ^+ \pi ^- $ decay. Each value is obtained through an independent fit to the candidates in the corresponding region of the phase space. Scheme A is defined in Table 4 and divides the phase space according to dominant resonant contributions, while scheme B consists of twelve non-overlapping bins of width $\pi/12$ in $|\Phi|$. |
Table_5.pdf [68 KiB] HiDef png [166 KiB] Thumbnail [85 KiB] tex code |

|
|
Definition of the seven regions that form scheme C for the $\Lambda ^0_ b \rightarrow p K ^- K ^+ K ^- $ decay. The scheme is defined to study regions where $ p K_{\rm slow}^-$ resonances are present ($1-3$) on either side of the $\Phi\rightarrow K ^+ K ^- $ resonances. Masses are in units of $ {\mathrm{ Ge V /}c^2}$ . |
Table_6.pdf [68 KiB] HiDef png [71 KiB] Thumbnail [31 KiB] tex code |

|
|
Measurements of $ a_P^{\widehat{T}\text{-odd}}$ and $ a_ C P ^{\widehat{T}\text{-odd}}$ in specific phase-space regions for the $\Lambda ^0_ b \rightarrow p K ^- K ^+ K ^- $ decay. Each value is obtained through an independent fit to the candidates in the corresponding region of the phase space. Scheme C is defined in Table 6 and divides the phase space according to dominant resonant contributions, while scheme D consists of ten non-overlapping bins of width $\pi/10$ in $|\Phi|$. |
Table_7.pdf [67 KiB] HiDef png [113 KiB] Thumbnail [57 KiB] tex code |

|
![HiDef png [32 KiB]](Directory_LHCb-PAPER-2018-001/hidef_Table_1.png)
![HiDef png [26 KiB]](Directory_LHCb-PAPER-2018-001/hidef_Table_2.png)
![HiDef png [32 KiB]](Directory_LHCb-PAPER-2018-001/hidef_Table_3.png)
![HiDef png [103 KiB]](Directory_LHCb-PAPER-2018-001/hidef_Table_4.png)
![HiDef png [166 KiB]](Directory_LHCb-PAPER-2018-001/hidef_Table_5.png)
![HiDef png [71 KiB]](Directory_LHCb-PAPER-2018-001/hidef_Table_6.png)
![HiDef png [113 KiB]](Directory_LHCb-PAPER-2018-001/hidef_Table_7.png)
Created on 27 April 2024.