Measurement of the inelastic $pp$ cross-section at a centre-of-mass energy of 13 TeV
[to restricted-access page]Information
LHCb-PAPER-2018-003
CERN-EP-2018-044
arXiv:1803.10974 [PDF]
(Submitted on 29 Mar 2018)
JHEP 06 (2018) 100
Inspire 1665223
Tools
Abstract
The cross-section for inelastic proton-proton collisions at a centre-of-mass energy of 13 TeV is measured with the LHCb detector. The fiducial cross-section for inelastic interactions producing at least one prompt long-lived charged particle with momentum $p>2$ GeV/$c$ in the pseudorapidity range $2<\eta<5$ is determined to be $\sigma_{\rm acc}= 62.2 \pm 0.2 \pm 2.5$ mb. The first uncertainty is the intrinsic systematic uncertainty of the measurement, the second is due to the uncertainty on the integrated luminosity. The statistical uncertainty is negligible. Extrapolation to full phase space yields the total inelastic proton-proton cross-section $\sigma_{\rm inel}= 75.4 \pm 3.0 \pm 4.5$ mb, where the first uncertainty is experimental and the second due to the extrapolation. An updated value of the inelastic cross-section at a centre-of-mass energy of 7 TeV is also reported.
Figures and captions
|
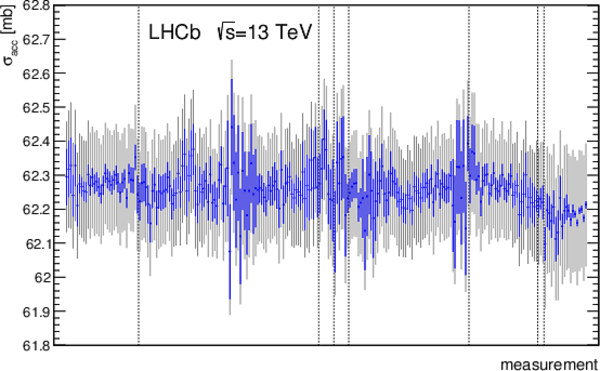
Overall fiducial cross-section (vertical line), compared to the averages of the individual results in different LHC fills. The error bars indicate the statistical uncertainties. The grey band indicates the systematic uncertainty on the overall average due to the unfolding parameter $\alpha$. The $\chi^2$-values for the averages inside a fill are calculated with only the statistical uncertainties and the number of degrees of freedom ($\rm ndf$) is one less than the number of individual results contributing to the average. Systematic uncertainties inferred from the observed spread between the fills are discussed in the text. |
Fig1.pdf [8 KiB] HiDef png [216 KiB] Thumbnail [207 KiB] *.C file |

|
|
Posterior densities of (left) the cross-section fractions $f_X$ for non-diffractive (ND) double-diffractive (DD) and single-diffractive (SD=SDA+SDB) contributions, and (right) of the extrapolation factor $F_{\rm T}$. |
Fig2.pdf [10 KiB] HiDef png [123 KiB] Thumbnail [84 KiB] *.C file |

|
|
Measurement of the total inelastic proton-proton cross-section at the LHC at centre-of-mass energies of 2.76, 7, 8 and 13 TeV. Results are shown from the ALICE [8], ATLAS [10,11,12,9] and TOTEM [16,17,18,19,20,21] collaborations. For better visibility, measurements at the same energy are drawn at slightly displaced locations. The error bars show the total uncertainties, with positive and negative uncertainties of the respective results independently added in quadrature. The line shows the result from a power-law fit. |
Fig3.pdf [7 KiB] HiDef png [66 KiB] Thumbnail [51 KiB] *.C file |

|
|
Animated gif made out of all figures. |
PAPER-2018-003.gif Thumbnail |

|
![HiDef png [216 KiB]](Directory_LHCb-PAPER-2018-003/hidef_Fig1.png)
![HiDef png [123 KiB]](Directory_LHCb-PAPER-2018-003/hidef_Fig2.png)
![HiDef png [66 KiB]](Directory_LHCb-PAPER-2018-003/hidef_Fig3.png)
Tables and captions
|
Summary of systematic uncertainties on the fiducial cross-section. For the contribution from the unfolding parameter $\alpha$ a breakdown into the individual components is given. |
Table_1.pdf [25 KiB] HiDef png [73 KiB] Thumbnail [33 KiB] tex code |

|
|
Properties of Pythia {} 8.230 proton-proton tunes. Mean values and standard deviations are given for the fractions $f_X$ of the inelastic cross-section, the fractions $v_X$ of interactions inside the acceptance and, for those interactions, the average numbers of long-lived prompt charged particles $n_{{\rm ch},X}$ inside the acceptance. |
Table_2.pdf [39 KiB] HiDef png [62 KiB] Thumbnail [26 KiB] tex code |

|
![HiDef png [73 KiB]](Directory_LHCb-PAPER-2018-003/hidef_Table_1.png)
![HiDef png [62 KiB]](Directory_LHCb-PAPER-2018-003/hidef_Table_2.png)
Supplementary Material [file]
| Supplementary material full pdf |
supple[..].pdf [954 KiB] |
|
|
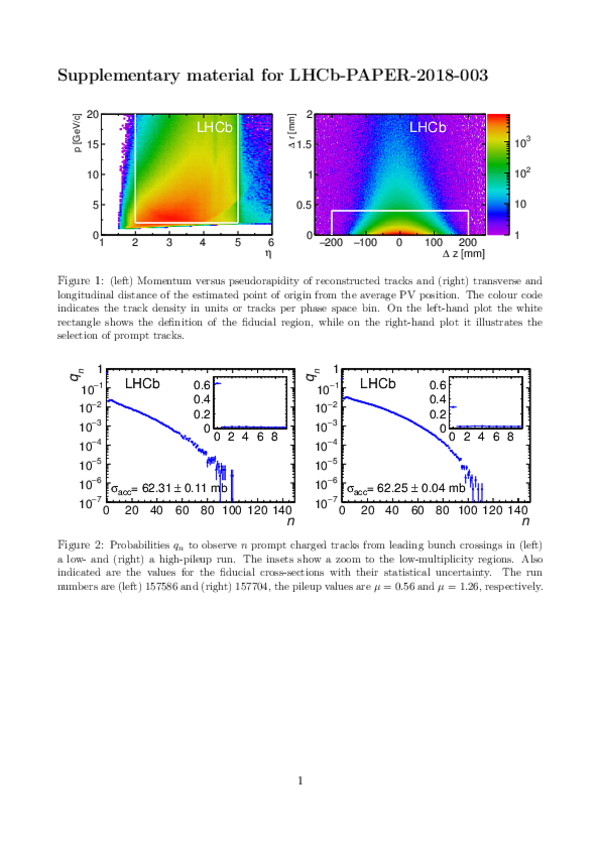
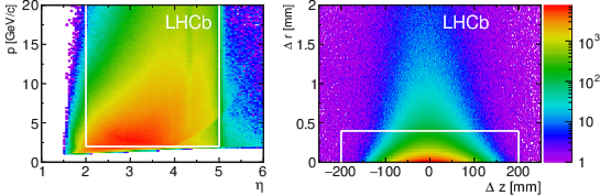
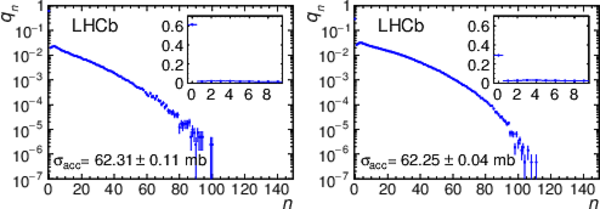
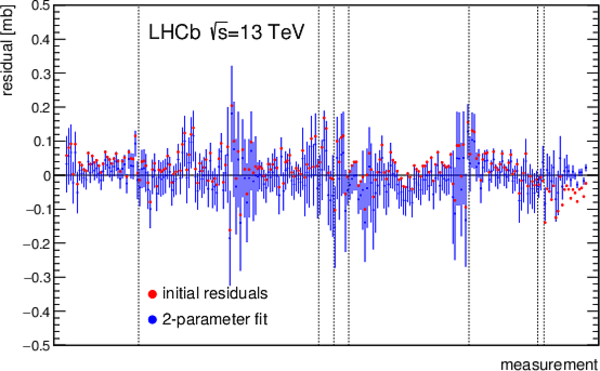
The supplementary material for LHCb-PAPER-2018-003 contains five plots that illustrate the analysis. Figure 1 shows the phase space coverage as function of p and eta with the region chosen to measure the fiducial cross-section, and the estimates points of origin of the long tracks used for the analysis with the region that was chosen to select prompt tracks. Figure 2 gives two examples for measured multiplicity distributions with the resulting fiducial cross-section. Figure 3 shows all 243 independent cross-section measurements in chronological order, together with their statistical and systematic unertainties. Figure 4 shows the differences between all individual measurements and the overall average. Red dots show the intial differences, the blue points with error bars are the residuals after fitting those differences by a linear combination of the average vertical position and spread of the luminous region. The error bars are the statistical uncertainties of the individual measurements. Figure 5 is the same as Figure 4, but allowing also for a systematic shift proportional to the background level estimated from the data. Here mainly the measurements from the first fill are effected, where the background level was about an order of magnitude larger than for the other early measurement fills. |
SupplFig1.pdf [761 KiB] HiDef png [1 MiB] Thumbnail [393 KiB] *C file |
|
|
SupplFig2.pdf [22 KiB] HiDef png [182 KiB] Thumbnail [148 KiB] *C file |
|
|
|
SupplFig3.pdf [28 KiB] HiDef png [309 KiB] Thumbnail [280 KiB] *C file |
|
|
|
SupplFig4.pdf [35 KiB] HiDef png [320 KiB] Thumbnail [238 KiB] *C file |
|
|
|
SupplFig5.pdf [35 KiB] HiDef png [320 KiB] Thumbnail [238 KiB] *C file |

|
![HiDef png [1 MiB]](Directory_LHCb-PAPER-2018-003/supplementary/hidef_SupplFig1.png)
![HiDef png [182 KiB]](Directory_LHCb-PAPER-2018-003/supplementary/hidef_SupplFig2.png)
![HiDef png [309 KiB]](Directory_LHCb-PAPER-2018-003/supplementary/hidef_SupplFig3.png)
![HiDef png [320 KiB]](Directory_LHCb-PAPER-2018-003/supplementary/hidef_SupplFig4.png)
![HiDef png [320 KiB]](Directory_LHCb-PAPER-2018-003/supplementary/hidef_SupplFig5.png)
Created on 27 April 2024.