Observation of the decay $\Lambda_b^0 \to \Lambda_c^+ p \overline{p} \pi^-$
[to restricted-access page]Information
LHCb-PAPER-2018-005
CERN-EP-2018-051
arXiv:1804.09617 [PDF]
(Submitted on 25 Apr 2018)
Phys. Lett. B784 (2018) 101
Inspire 1670022
Tools
Abstract
The decay $\Lambda_b^0 \to \Lambda_c^+ p \overline{p} \pi^-$ is observed using $pp$ collision data collected with the LHCb detector at centre-of-mass energies of $\sqrt{s}=$ 7 and 8 TeV, corresponding to an integrated luminosity of 3 $fb^{-1}$. The ratio of branching fractions between $\Lambda_b^0 \to \Lambda_c^+ p \overline{p} \pi^-$ and $\Lambda_b^0 \to \Lambda_c^+ \pi^-$ decays is measured to be \begin{equation*} \frac{\mathcal{B}(\Lambda_b^0 \to \Lambda_c^+ p \overline{p}\pi^-)}{\mathcal{B}(\Lambda_b^0 \to \Lambda_c^+ \pi^-)} = 0.0540 \pm 0.0023 \pm 0.0032. \end{equation*} Two resonant structures are observed in the $ \Lambda_c^+ \pi^-$ mass spectrum of the ${\Lambda_b^0 \to \Lambda_c^+ p\overline{p} \pi^-}$ decays, corresponding to the $\Sigma_c(2455)^0$ and $\Sigma_c^{*}(2520)^0$ states. The ratios of branching fractions with respect to the decay $\Lambda_b^0 \to \Lambda_c^+ p \overline{p} \pi^-$ are \begin{align*} \frac{\mathcal{B}(\Lambda_b^0 \to \Sigma_c^0 p\overline{p})\times\mathcal{B}(\Sigma_c^0\to \Lambda_c^+ \pi^-)}{\mathcal{B}(\Lambda_b^0 \to \Lambda_c^+ p \overline{p}\pi^-)} = 0.089\pm0.015\pm0.006, \frac{\mathcal{B}(\Lambda_b^0 \to \Sigma_c^{*0} p\overline{p})\times\mathcal{B}(\Sigma_c^{*0}\to \Lambda_c^+ \pi^-)}{\mathcal{B}(\Lambda_b^0 \to \Lambda_c^+ p \overline{p}\pi^-)} = 0.119\pm0.020\pm0.014. \end{align*} In all of the above results, the first uncertainty is statistical and the second is systematic. The phase space is also examined for the presence of dibaryon resonances. No evidence for such resonances is found.
Figures and captions
|
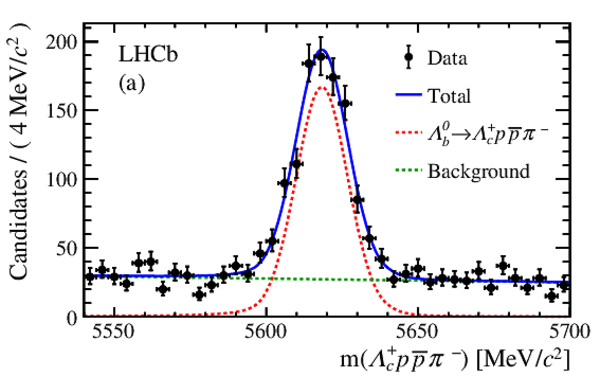
Invariant mass distributions of the (a) $\Lambda ^0_ b \rightarrow \Lambda ^+_ c p \overline p \pi ^- $ and (b) $\Lambda ^0_ b \rightarrow \Lambda ^+_ c \pi ^- $ candidates. Fit results are overlaid as a solid blue line. For (a), the red dotted line represents the signal component and the green dotted line the background due to random combinations. For (b), the red dotted line is the signal component, the green dotted line is the random combination background, the purple dashed line is the contribution from $\Lambda ^0_ b \rightarrow \Lambda ^+_ c \rho ^- $ and the brown dashed-dotted line represents the contribution from $\Lambda ^0_ b \rightarrow \Lambda ^+_ c K ^- $. |
Fig1a.pdf [19 KiB] HiDef png [232 KiB] Thumbnail [189 KiB] *.C file |
|
|
Fig1b.pdf [37 KiB] HiDef png [209 KiB] Thumbnail [168 KiB] *.C file |

|
|
|
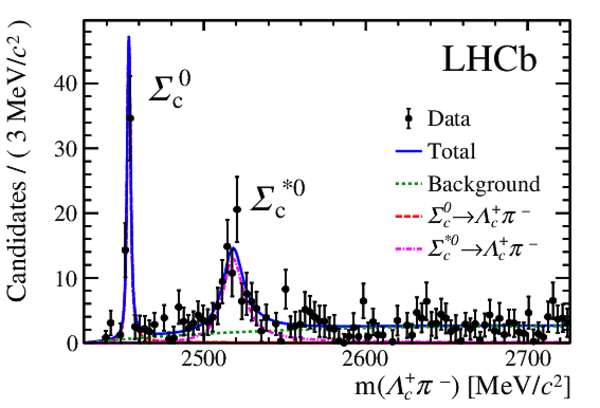
Invariant mass of the $\Lambda ^+_ c $ $\pi ^-$ system from the decay ${\Lambda ^0_ b \rightarrow \Lambda ^+_ c p \overline p \pi ^- }$. The $\Sigma_c^0$ and $\Sigma_c^{*0}$ resonances are indicated. The fit to the data is shown as a blue continuous line, with the background component shown as a green dotted line, the $\Sigma_c^{0}$ shape shown as a dashed red line, and the $\Sigma_c^{*0}$ shape shown as a dash-dotted magenta line. |
Fig2.pdf [36 KiB] HiDef png [266 KiB] Thumbnail [224 KiB] *.C file |
|
|
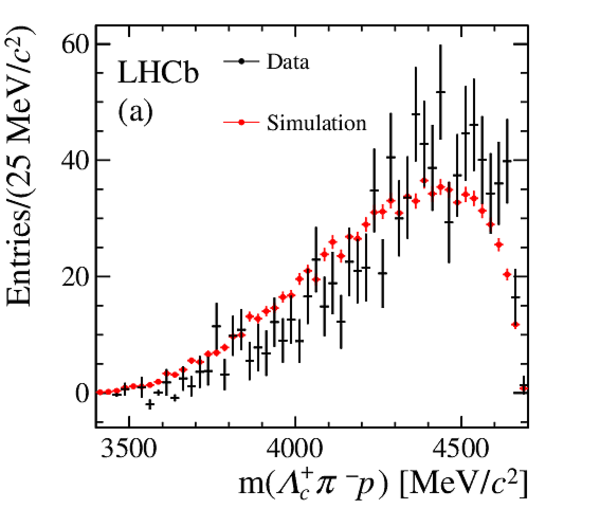
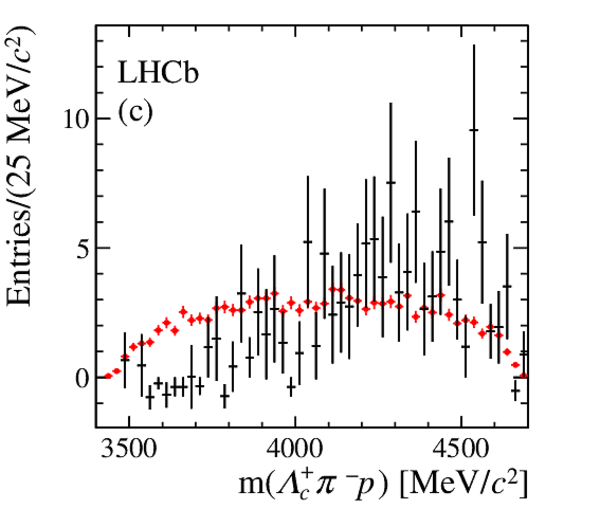
Background-subtracted mass spectrum of the $\Lambda ^+_ c \pi ^- p $ system from the decay ${\Lambda ^0_ b \rightarrow \Lambda ^+_ c p \overline p \pi ^- }$ in (a) the full $\Lambda ^+_ c \pi ^- $ mass spectrum, (b) the signal region of the $\Sigma_c^0$ resonance, and (c) the signal region of the $\Sigma_c^{*0}$ resonance. In all figures, the black points are data and the red points are simulated events where the $\Lambda ^0_ b $ baryon decays to the $\Lambda ^+_ c $ $ p $ $\overline p $ $\pi ^-$ final state (a) based on a uniform-phase-space model, (b) through the $\Sigma_c^0$ resonance and (c) through the $\Sigma_c^{*0}$ resonance. No evident peaking shapes are visible. |
Fig3a.pdf [19 KiB] HiDef png [183 KiB] Thumbnail [162 KiB] *.C file |
|
|
Fig3b.pdf [18 KiB] HiDef png [174 KiB] Thumbnail [141 KiB] *.C file |

|
|
|
Fig3c.pdf [19 KiB] HiDef png [172 KiB] Thumbnail [147 KiB] *.C file |
|
|
|
Animated gif made out of all figures. |
PAPER-2018-005.gif Thumbnail |

|
![HiDef png [232 KiB]](Directory_LHCb-PAPER-2018-005/hidef_Fig1a.png)
![HiDef png [209 KiB]](Directory_LHCb-PAPER-2018-005/hidef_Fig1b.png)
![HiDef png [266 KiB]](Directory_LHCb-PAPER-2018-005/hidef_Fig2.png)
![HiDef png [183 KiB]](Directory_LHCb-PAPER-2018-005/hidef_Fig3a.png)
![HiDef png [174 KiB]](Directory_LHCb-PAPER-2018-005/hidef_Fig3b.png)
![HiDef png [172 KiB]](Directory_LHCb-PAPER-2018-005/hidef_Fig3c.png)
Tables and captions
|
Summary of systematic uncertainties and correction factors to the ratio of branching fractions measurement. All uncertainties are given as a percentage of the ratio of branching fractions. |
Table_1.pdf [64 KiB] HiDef png [78 KiB] Thumbnail [33 KiB] tex code |

|
![HiDef png [78 KiB]](Directory_LHCb-PAPER-2018-005/hidef_Table_1.png)
Created on 26 April 2024.