Measurement of $C P$ asymmetries in two-body $B_{(s)}^{0}$-meson decays to charged pions and kaons
[to restricted-access page]Information
LHCb-PAPER-2018-006
CERN-EP-2018-086
arXiv:1805.06759 [PDF]
(Submitted on 17 May 2018)
Phys. Rev. D98 (2018) 032004
Inspire 1673686
Tools
Abstract
The time-dependent $C P$ asymmetries in $B^0\to\pi^+\pi^-$ and $B_s^0\to K^+ K^-$ decays are measured using a data sample of $pp$ collisions corresponding to an integrated luminosity of 3.0 fb$^{-1}$, collected with the LHCb detector at centre-of-mass energies of 7 and 8 TeV. The same data sample is used to measure the time-integrated $C P$ asymmetries in $B^0\to K^+\pi^-$ and $B_s^0\to\pi^+ K^-$ decays. The results are $C_{\pi^+\pi^-} = -0.34 \pm 0.06 \pm 0.01$, $S_{\pi^+\pi^-} = -0.63 \pm 0.05 \pm 0.01$, $C_{K^+ K^-} = 0.20 \pm 0.06 \pm 0.02$, $S_{K^+ K^-} = 0.18 \pm 0.06 \pm 0.02$, $C_{K^+ K^-}^{\Delta\Gamma} = -0.79 \pm 0.07 \pm 0.10$, $A_{C P}^{B^0} = -0.084 \pm 0.004 \pm 0.003$, and $A_{C P}^{B_s^0} = 0.213 \pm 0.015 \pm 0.007$, where the first uncertainties are statistical and the second systematic. Evidence for $C P$ violation is found in the $B_s^0\to K^+ K^-$ decay for the first time.
Figures and captions
|
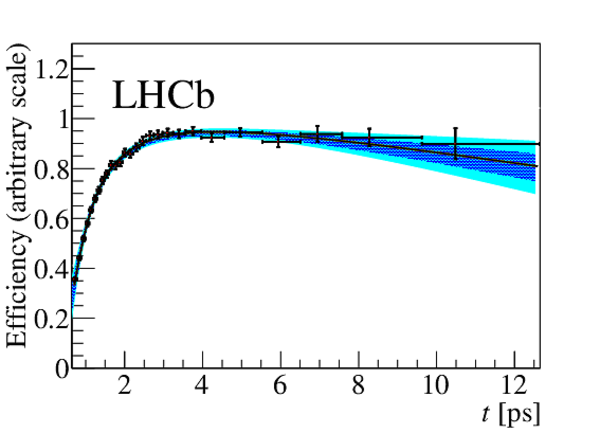
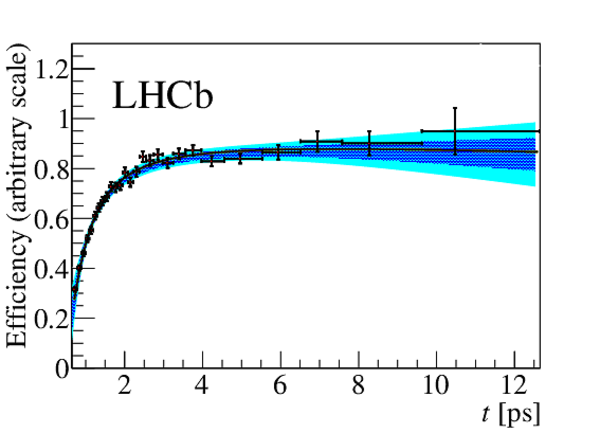
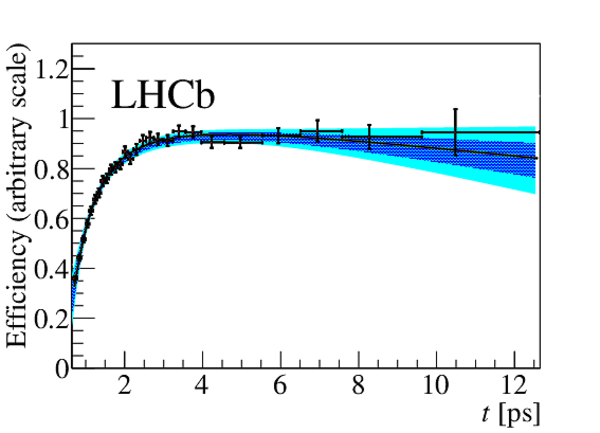
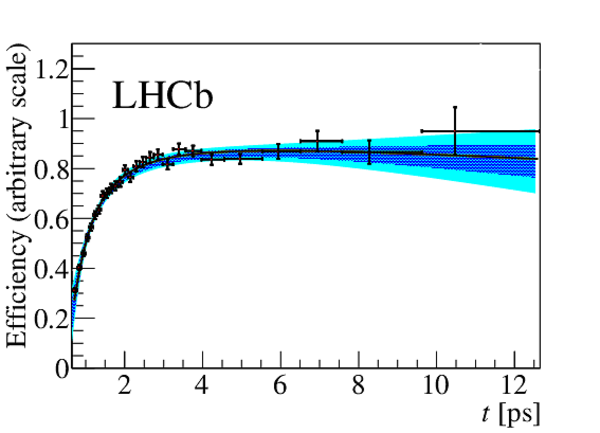
Efficiencies as a function of decay time for (top left) $ B ^0 \rightarrow K ^+ \pi ^- $ , (top right) $ B ^0_ s \rightarrow \pi ^+ K ^- $ , (bottom left) $ B ^0 \rightarrow \pi ^+ \pi ^- $ and (bottom right) $ B ^0_ s \rightarrow K ^+ K ^- $ decays. The black line is the result of the best fit of Eq. 13 to the histograms, obtained as described in the text. The dark and bright areas correspond to the 68% and 95% confidence intervals, respectively. |
Fig1a.pdf [19 KiB] HiDef png [195 KiB] Thumbnail [125 KiB] |
|
|
Fig1b.pdf [19 KiB] HiDef png [207 KiB] Thumbnail [129 KiB] |
|
|
|
Fig1c.pdf [19 KiB] HiDef png [212 KiB] Thumbnail [131 KiB] |
|
|
|
Fig1d.pdf [19 KiB] HiDef png [207 KiB] Thumbnail [129 KiB] |
|
|
|
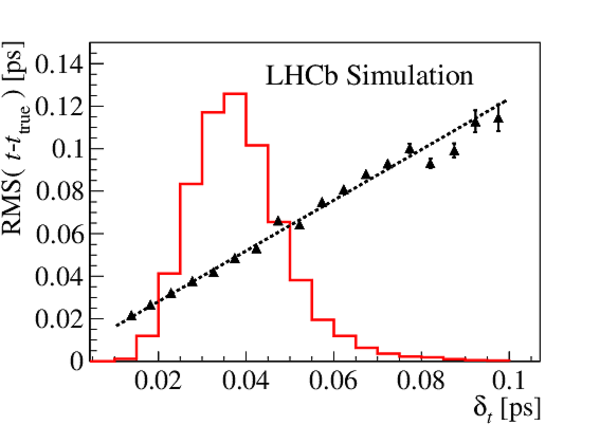
The triangles represent the standard deviation of the difference between the reconstructed ($t$) and true decay ($t_{\rm true}$) time versus $\delta_t$ for simulated (left) $ B ^0_ s \rightarrow \pi ^+ K ^- $ and (right) $ B ^0_ s \rightarrow D ^-_ s \pi ^+ $ decays. The dotted lines are the results of linear-function fits. The histograms represent the corresponding $\delta_t$ distributions with arbitrary normalisations. |
Fig2a.pdf [14 KiB] HiDef png [132 KiB] Thumbnail [127 KiB] |

|
|
Fig2b.pdf [14 KiB] HiDef png [133 KiB] Thumbnail [128 KiB] |
|
|
|
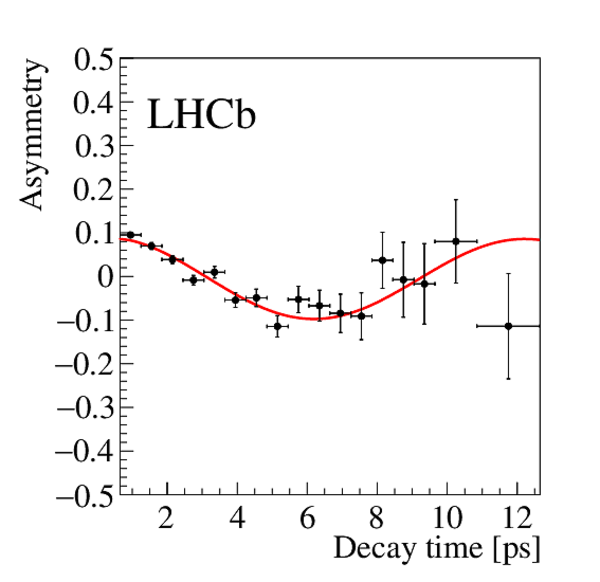
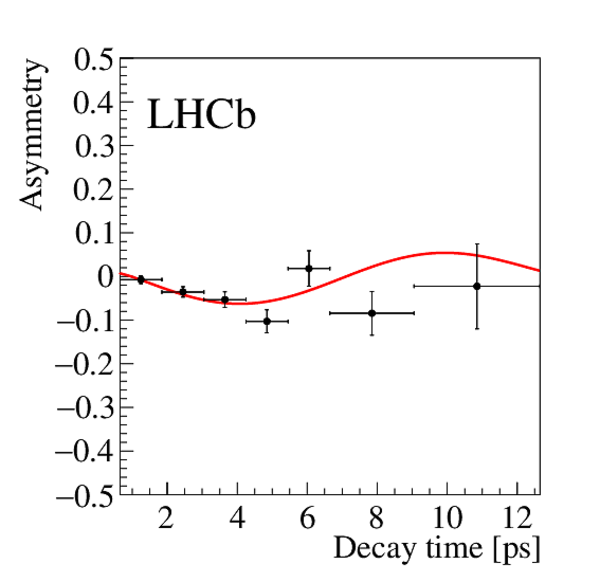
Time-dependent asymmetries of (left) $ B ^0 \rightarrow D ^- \pi ^+ $ and (right) $ B ^0_ s \rightarrow D ^-_ s \pi ^+ $ decays obtained from data. The results of the best fits are superimposed. The time-dependent asymmetry of the $ B ^0_ s \rightarrow D ^-_ s \pi ^+ $ decays is folded into one mixing period $2\pi/\Delta m_{ s } $ of the $ B ^0_ s $ meson. The parameter $t_0 = 0.3 {\mathrm{ ps}} $ corresponds to the minimum value allowed by the selection. |
Fig3a.pdf [32 KiB] HiDef png [165 KiB] Thumbnail [140 KiB] |

|
|
Fig3b.pdf [30 KiB] HiDef png [157 KiB] Thumbnail [135 KiB] |

|
|
|
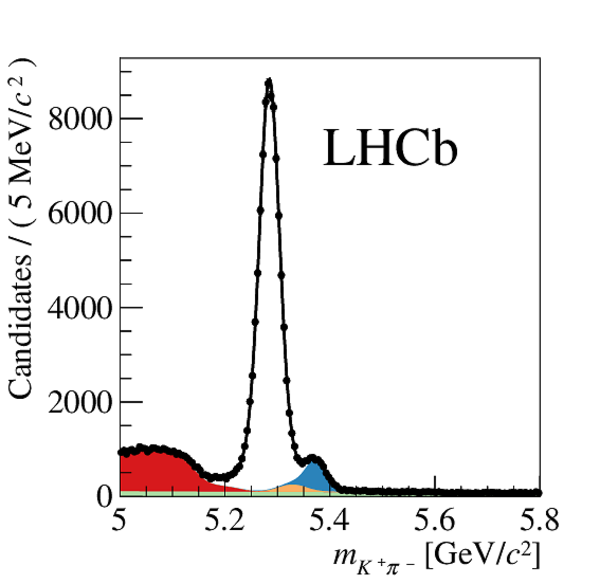
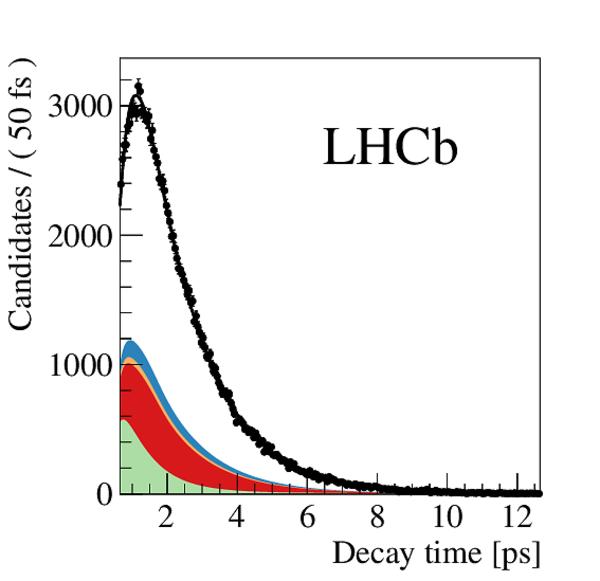
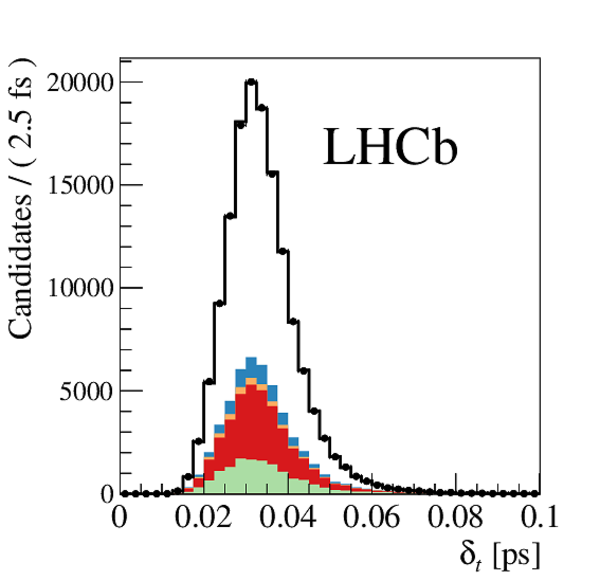
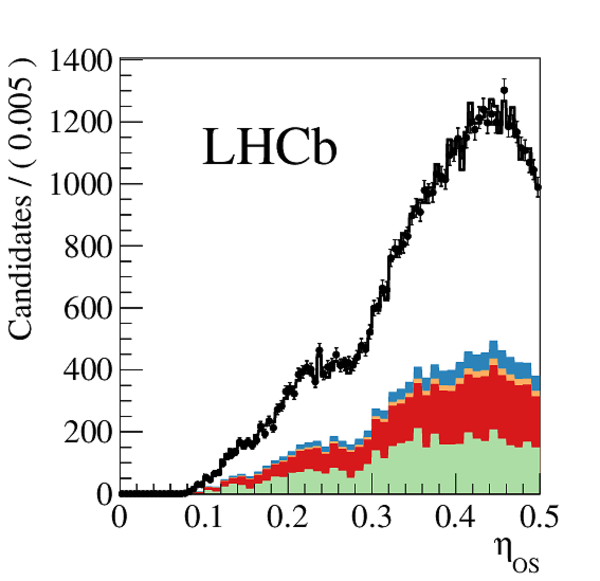
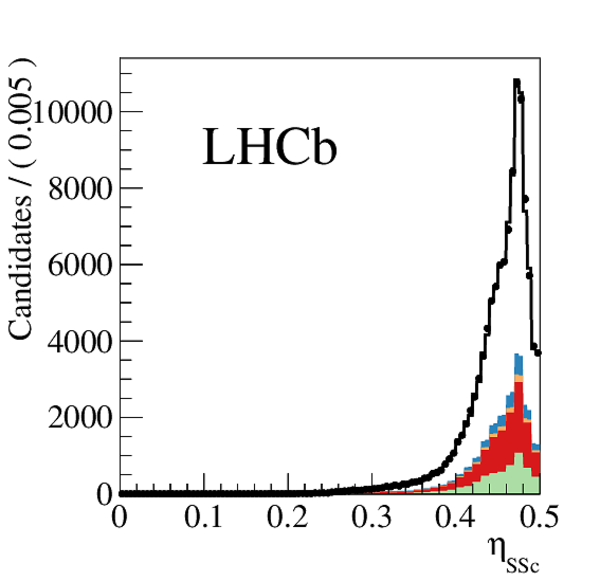
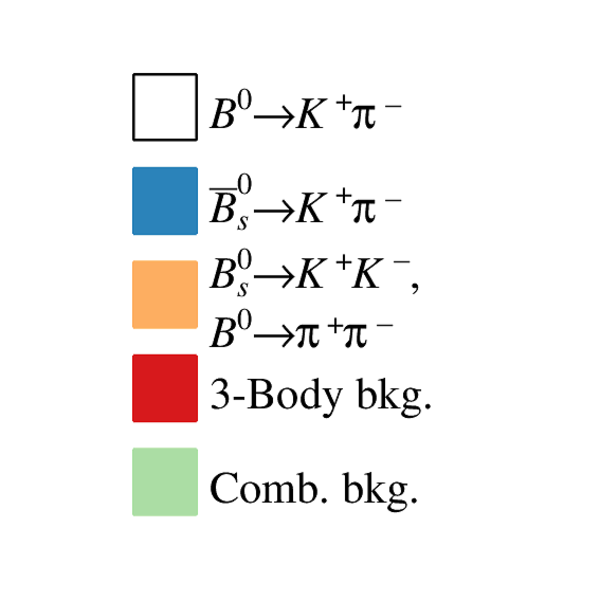
Distributions of (top left) invariant mass, (top right) decay time, (middle left) decay-time uncertainty, (middle right) $\eta_{\rm OS}$, and (bottom) $\eta_{\rm SSc}$ for candidates in the $ K ^\pm$ $\pi ^\mp$ sample. The result of the simultaneous fit is overlaid. The individual components are also shown. |
Fig4a.pdf [47 KiB] HiDef png [185 KiB] Thumbnail [154 KiB] |
|
|
Fig4b.pdf [64 KiB] HiDef png [204 KiB] Thumbnail [157 KiB] |
|
|
|
Fig4c.pdf [18 KiB] HiDef png [160 KiB] Thumbnail [143 KiB] |
|
|
|
Fig4d.pdf [36 KiB] HiDef png [240 KiB] Thumbnail [204 KiB] |
|
|
|
Fig4e.pdf [33 KiB] HiDef png [180 KiB] Thumbnail [146 KiB] |
|
|
|
Fig4f.pdf [12 KiB] HiDef png [108 KiB] Thumbnail [100 KiB] |
|
|
|
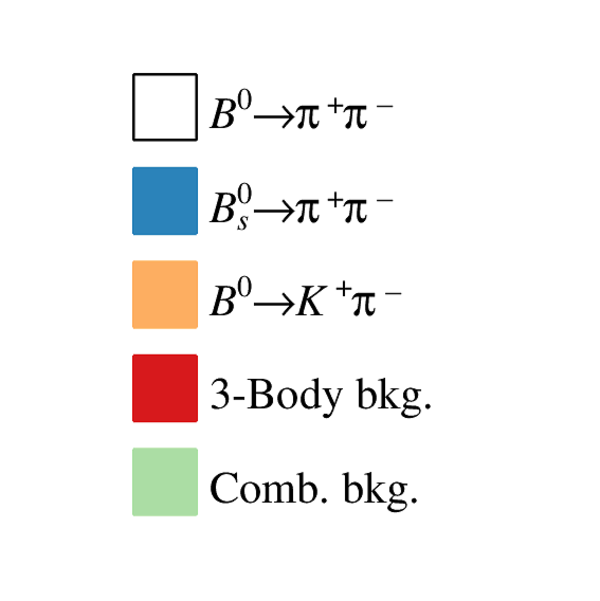
Distributions of (top left) invariant mass, (top right) decay time, (middle left) decay-time uncertainty, (middle right) $\eta_{\rm OS}$, and (bottom) $\eta_{\rm SSc}$ for candidates in the $\pi ^+$ $\pi ^-$ sample. The result of the simultaneous fit is overlaid. The individual components are also shown. |
Fig5a.pdf [46 KiB] HiDef png [209 KiB] Thumbnail [172 KiB] |

|
|
Fig5b.pdf [63 KiB] HiDef png [218 KiB] Thumbnail [161 KiB] |

|
|
|
Fig5c.pdf [19 KiB] HiDef png [165 KiB] Thumbnail [144 KiB] |

|
|
|
Fig5d.pdf [35 KiB] HiDef png [241 KiB] Thumbnail [193 KiB] |

|
|
|
Fig5e.pdf [33 KiB] HiDef png [188 KiB] Thumbnail [151 KiB] |

|
|
|
Fig5f.pdf [12 KiB] HiDef png [93 KiB] Thumbnail [83 KiB] |
|
|
|
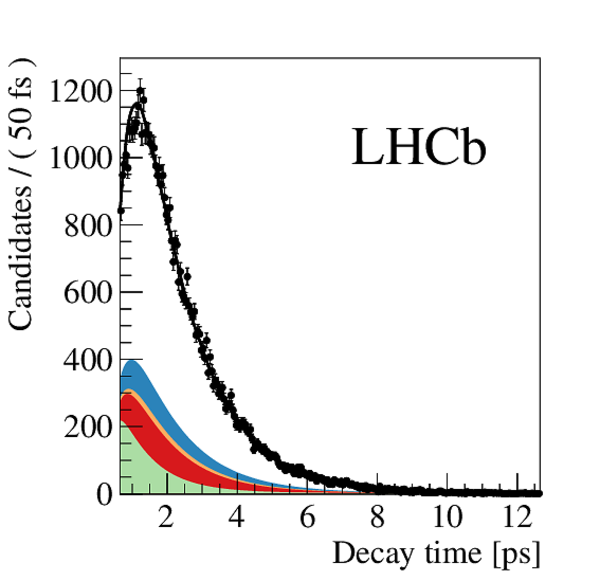
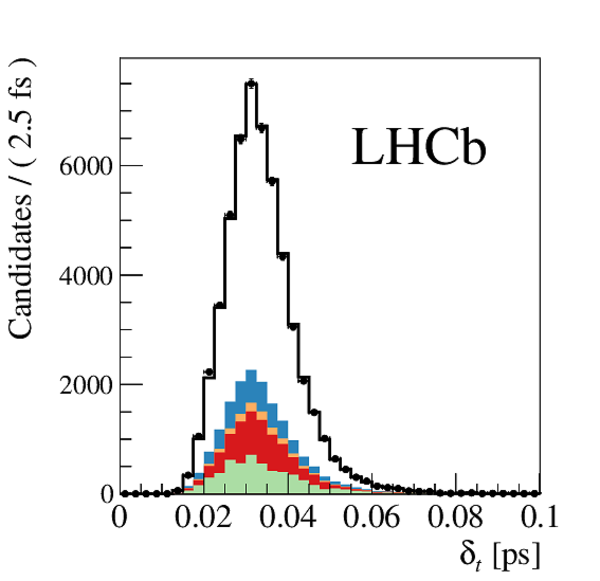
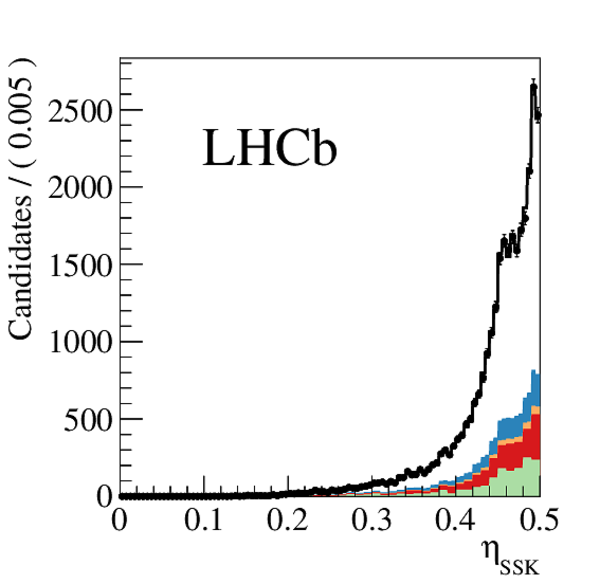
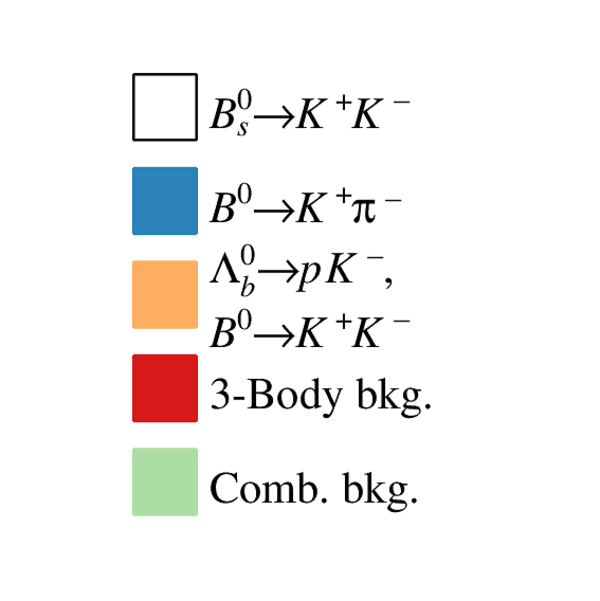
Distributions of (top left) invariant mass, (top right) decay time, (middle left) decay-time uncertainty, (middle right) $\eta_{\rm OS}$, and (bottom) $\eta_{{\rm SS} K }$ for candidates in the $ K ^+ K ^- $ sample. The result of the simultaneous fit is overlaid. The individual components are also shown. |
Fig6a.pdf [47 KiB] HiDef png [179 KiB] Thumbnail [147 KiB] |

|
|
Fig6b.pdf [63 KiB] HiDef png [222 KiB] Thumbnail [177 KiB] |
|
|
|
Fig6c.pdf [18 KiB] HiDef png [153 KiB] Thumbnail [134 KiB] |
|
|
|
Fig6d.pdf [35 KiB] HiDef png [243 KiB] Thumbnail [205 KiB] |

|
|
|
Fig6e.pdf [34 KiB] HiDef png [178 KiB] Thumbnail [149 KiB] |
|
|
|
Fig6f.pdf [12 KiB] HiDef png [110 KiB] Thumbnail [100 KiB] |
|
|
|
Time-dependent asymmetries for $ K ^\pm$ $\pi ^\mp$ candidates with invariant-mass values in the interval $5.20 < m < 5.32 {\mathrm{ Ge V /}c^2} $: (left) using the OS-tagging decision and (right) the SS-tagging decision. The result of the simultaneous fit is overlaid. |
Fig7a.pdf [31 KiB] HiDef png [163 KiB] Thumbnail [143 KiB] |

|
|
Fig7b.pdf [31 KiB] HiDef png [154 KiB] Thumbnail [138 KiB] |
|
|
|
Time-dependent asymmetries for (top) $\pi ^+$ $\pi ^-$ and (bottom) $ K ^+ K ^- $ candidates with mass values in the intervals $5.20 < m < 5.35 {\mathrm{ Ge V /}c^2} $ and $5.30 < m < 5.44 {\mathrm{ Ge V /}c^2} $, respectively: (left) using the OS-tagging decision and (right) using either the SSc-tagging decision (for the $\pi ^+$ $\pi ^-$ candidates) or the SS $ K $ -tagging decision (for the $ K ^+ K ^- $ candidates). The result of the simultaneous fit is overlaid. |
Fig8a.pdf [29 KiB] HiDef png [146 KiB] Thumbnail [129 KiB] |

|
|
Fig8b.pdf [29 KiB] HiDef png [141 KiB] Thumbnail [126 KiB] |
|
|
|
Fig8c.pdf [29 KiB] HiDef png [143 KiB] Thumbnail [123 KiB] |

|
|
|
Fig8d.pdf [28 KiB] HiDef png [139 KiB] Thumbnail [119 KiB] |

|
|
|
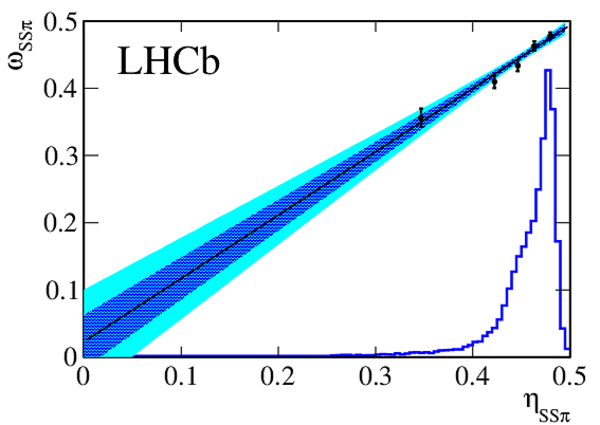
Relation between $\omega_{\rm tag}$ on $\eta_{\rm tag}$ for (top left) SS $\pi $ , (top right) SS $ p $ , (bottom left) SSc and (bottom right) SS $ K $ taggers. The black dots represent the average value of $\omega_{\rm tag}$ in bins of $\eta_{\rm tag}$, as described in the text. The black straight line represents the linear relation between $\omega_{\rm tag}$ and $\eta_{\rm tag}$ obtained from the calibration procedure. The darker and brighter areas are the corresponding 68% and 95% confidence intervals, respectively. The distributions of $\eta_{\rm tag}$ are also reported as histograms with arbitrary normalisations. |
Fig9a.pdf [17 KiB] HiDef png [266 KiB] Thumbnail [130 KiB] |
|
|
Fig9b.pdf [17 KiB] HiDef png [305 KiB] Thumbnail [139 KiB] |

|
|
|
Fig9c.pdf [17 KiB] HiDef png [242 KiB] Thumbnail [124 KiB] |

|
|
|
Fig9d.pdf [17 KiB] HiDef png [277 KiB] Thumbnail [133 KiB] |

|
|
|
Animated gif made out of all figures. |
PAPER-2018-006.gif Thumbnail |

|
![HiDef png [195 KiB]](Directory_LHCb-PAPER-2018-006/hidef_Fig1a.png)
![HiDef png [207 KiB]](Directory_LHCb-PAPER-2018-006/hidef_Fig1b.png)
![HiDef png [212 KiB]](Directory_LHCb-PAPER-2018-006/hidef_Fig1c.png)
![HiDef png [207 KiB]](Directory_LHCb-PAPER-2018-006/hidef_Fig1d.png)
![HiDef png [132 KiB]](Directory_LHCb-PAPER-2018-006/hidef_Fig2a.png)
![HiDef png [133 KiB]](Directory_LHCb-PAPER-2018-006/hidef_Fig2b.png)
![HiDef png [165 KiB]](Directory_LHCb-PAPER-2018-006/hidef_Fig3a.png)
![HiDef png [157 KiB]](Directory_LHCb-PAPER-2018-006/hidef_Fig3b.png)
![HiDef png [185 KiB]](Directory_LHCb-PAPER-2018-006/hidef_Fig4a.png)
![HiDef png [204 KiB]](Directory_LHCb-PAPER-2018-006/hidef_Fig4b.png)
![HiDef png [160 KiB]](Directory_LHCb-PAPER-2018-006/hidef_Fig4c.png)
![HiDef png [240 KiB]](Directory_LHCb-PAPER-2018-006/hidef_Fig4d.png)
![HiDef png [180 KiB]](Directory_LHCb-PAPER-2018-006/hidef_Fig4e.png)
![HiDef png [108 KiB]](Directory_LHCb-PAPER-2018-006/hidef_Fig4f.png)
![HiDef png [209 KiB]](Directory_LHCb-PAPER-2018-006/hidef_Fig5a.png)
![HiDef png [218 KiB]](Directory_LHCb-PAPER-2018-006/hidef_Fig5b.png)
![HiDef png [165 KiB]](Directory_LHCb-PAPER-2018-006/hidef_Fig5c.png)
![HiDef png [241 KiB]](Directory_LHCb-PAPER-2018-006/hidef_Fig5d.png)
![HiDef png [188 KiB]](Directory_LHCb-PAPER-2018-006/hidef_Fig5e.png)
![HiDef png [93 KiB]](Directory_LHCb-PAPER-2018-006/hidef_Fig5f.png)
![HiDef png [179 KiB]](Directory_LHCb-PAPER-2018-006/hidef_Fig6a.png)
![HiDef png [222 KiB]](Directory_LHCb-PAPER-2018-006/hidef_Fig6b.png)
![HiDef png [153 KiB]](Directory_LHCb-PAPER-2018-006/hidef_Fig6c.png)
![HiDef png [243 KiB]](Directory_LHCb-PAPER-2018-006/hidef_Fig6d.png)
![HiDef png [178 KiB]](Directory_LHCb-PAPER-2018-006/hidef_Fig6e.png)
![HiDef png [110 KiB]](Directory_LHCb-PAPER-2018-006/hidef_Fig6f.png)
![HiDef png [163 KiB]](Directory_LHCb-PAPER-2018-006/hidef_Fig7a.png)
![HiDef png [154 KiB]](Directory_LHCb-PAPER-2018-006/hidef_Fig7b.png)
![HiDef png [146 KiB]](Directory_LHCb-PAPER-2018-006/hidef_Fig8a.png)
![HiDef png [141 KiB]](Directory_LHCb-PAPER-2018-006/hidef_Fig8b.png)
![HiDef png [143 KiB]](Directory_LHCb-PAPER-2018-006/hidef_Fig8c.png)
![HiDef png [139 KiB]](Directory_LHCb-PAPER-2018-006/hidef_Fig8d.png)
![HiDef png [266 KiB]](Directory_LHCb-PAPER-2018-006/hidef_Fig9a.png)
![HiDef png [305 KiB]](Directory_LHCb-PAPER-2018-006/hidef_Fig9b.png)
![HiDef png [242 KiB]](Directory_LHCb-PAPER-2018-006/hidef_Fig9c.png)
![HiDef png [277 KiB]](Directory_LHCb-PAPER-2018-006/hidef_Fig9d.png)
Tables and captions
|
Current experimental knowledge on $ C_{\pi ^+ \pi ^- } $ , $ S_{\pi ^+ \pi ^- } $ , $ C_{ K ^+ K ^- } $ and $ S_{ K ^+ K ^- } $ . For the experimental measurements, the first uncertainties are statistical and the second systematic, whereas for the averages the uncertainties include both contributions. The correlation factors, denoted as $\rho$, are also reported. |
Table_1.pdf [67 KiB] HiDef png [53 KiB] Thumbnail [22 KiB] tex code |

|
|
Current experimental knowledge on $A_{ C P }$ for $ B ^0 \rightarrow K ^+ \pi ^- $ and $ B ^0_ s \rightarrow \pi ^+ K ^- $ decays. For the experimental measurements, the first uncertainties are statistical and the second systematic, whereas for the averages the uncertainties include both contributions. |
Table_2.pdf [81 KiB] HiDef png [56 KiB] Thumbnail [28 KiB] tex code |

|
|
Values of the parameters $\Delta m_{ d }$ , $\Delta m_{ s }$ , $\Gamma_{ d }$ , $\Gamma_{ s }$ and $\Delta\Gamma_{ s }$ [19], fixed to their central values in the fit to the data. For $\Gamma_{ s }$ and $\Delta\Gamma_{ s }$ the correlation factor between the two quantities is also reported. The decay width difference $\Delta\Gamma_{ d }$ is fixed to zero. |
Table_3.pdf [65 KiB] HiDef png [98 KiB] Thumbnail [44 KiB] tex code |

|
|
Tagging powers for the $ B ^0 \rightarrow \pi ^+ \pi ^- $ and $ B ^0_ s \rightarrow K ^+ K ^- $ decays (last two rows), with a breakdown of the OS and SS contributions. |
Table_4.pdf [67 KiB] HiDef png [86 KiB] Thumbnail [42 KiB] tex code |

|
|
Systematic uncertainties on the various $ C P$ -violating parameters. When present, the dash indicates that the uncertainty is not applicable to the given case. |
Table_5.pdf [78 KiB] HiDef png [164 KiB] Thumbnail [67 KiB] tex code |

|
|
Statistical correlations among the $ C P$ -violating parameters. |
Table_6.pdf [76 KiB] HiDef png [48 KiB] Thumbnail [22 KiB] tex code |

|
|
Values for the calibration parameters of the flavour tagging obtained from the fits. The values of $\hat{\eta}_{\rm OS}$ and $\hat{\eta}_{\rm SS}$ are fixed in the fit to $0.37$ and $0.44$, respectively. |
Table_7.pdf [50 KiB] HiDef png [169 KiB] Thumbnail [69 KiB] tex code |

|
|
Calibration parameters for the SS $ K $ tagger. |
Table_8.pdf [50 KiB] HiDef png [94 KiB] Thumbnail [38 KiB] tex code |

|
![HiDef png [53 KiB]](Directory_LHCb-PAPER-2018-006/hidef_Table_1.png)
![HiDef png [56 KiB]](Directory_LHCb-PAPER-2018-006/hidef_Table_2.png)
![HiDef png [98 KiB]](Directory_LHCb-PAPER-2018-006/hidef_Table_3.png)
![HiDef png [86 KiB]](Directory_LHCb-PAPER-2018-006/hidef_Table_4.png)
![HiDef png [164 KiB]](Directory_LHCb-PAPER-2018-006/hidef_Table_5.png)
![HiDef png [48 KiB]](Directory_LHCb-PAPER-2018-006/hidef_Table_6.png)
![HiDef png [169 KiB]](Directory_LHCb-PAPER-2018-006/hidef_Table_7.png)
![HiDef png [94 KiB]](Directory_LHCb-PAPER-2018-006/hidef_Table_8.png)
Created on 27 April 2024.