Information
LHCb-PAPER-2018-008
CERN-EP-2018-111
arXiv:1805.09820 [PDF]
(Submitted on 24 May 2018)
JHEP 09 (2018) 147
Inspire 1674704
Tools
Abstract
A search is performed for a spin-0 boson, $\phi$, produced in proton-proton collisions at centre-of-mass energies of 7 and 8 TeV, using prompt $\phi\rightarrow\mu^+\mu^-$ decays and a data sample corresponding to an integrated luminosity of approximately 3.0 ${\rm fb}^{-1}$ collected with the LHCb detector. No evidence is found for a signal in the mass range from 5.5 to 15 GeV. Upper limits are placed on the product of the production cross-section and the branching fraction into the dimuon final state. The limits are comparable to the best existing over most of the mass region considered and are the first to be set near the $\Upsilon$ resonances.
Figures and captions
|
The expected sensitivity, defined as $2\sqrt{B}$, where $B$ is the background under a dimuon peak with invariant mass ${11\mathrm{ Ge V} }$, is shown for the 12 $[ p_{\mathrm{ T}} , \eta]$ bins. For comparison, signal yields in the various bins are shown for three different production mechanisms: a $\phi$ boson produced via gluon-gluon fusion, a $\phi$ boson coming from a $H\rightarrow \phi \phi $ decay and a vector $A^\prime$ boson produced via the Drell-Yan mechanism. |
Fig1.pdf [182 KiB] HiDef png [221 KiB] Thumbnail [215 KiB] *.C file |

|
|
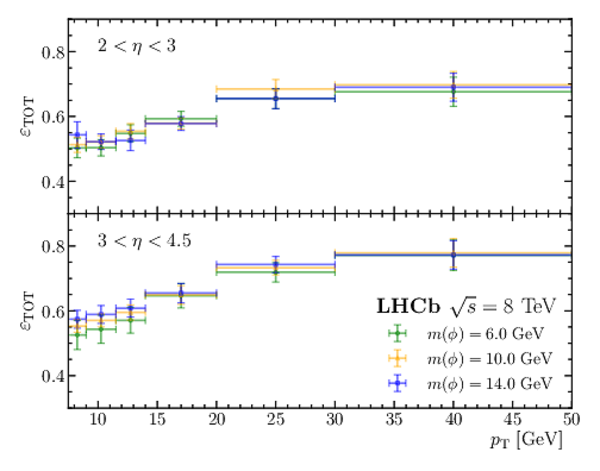
Total efficiency as a function of the $ p_{\mathrm{ T}} $ of the dimuon candidate for the two $\eta(\phi )$ bins considered, obtained for three different $\phi $ boson mass hypotheses. |
Fig2.pdf [156 KiB] HiDef png [197 KiB] Thumbnail [171 KiB] *.C file |
|
|
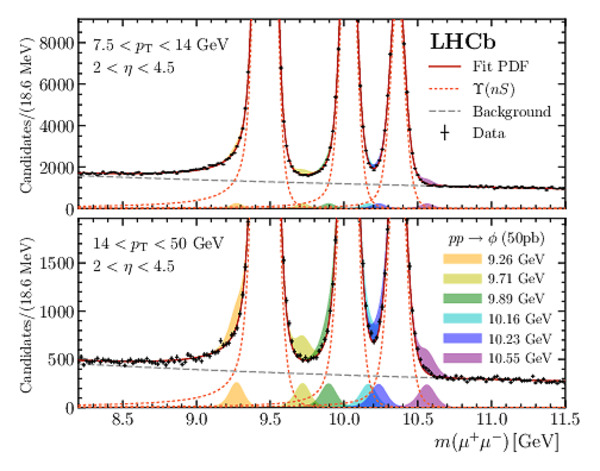
(top) Fit to the dimuon invariant mass distribution in the whole scanned region. All $[ p_{\mathrm{ T}} , \eta]$ bins as well as the 7 and 8 TeV data sets are combined. Peaks for five $\phi$ boson mass hypotheses are displayed in green, assuming $\sigma(pp \rightarrow \phi ) \times \mathcal{B} ( \phi \rightarrow \mu ^+ \mu ^- ) = 50\mathrm{ pb} $. (bottom) A closeup view of the mass spectrum in the $\Upsilon{(nS)}$ region together with $\phi$ boson mass peaks for the tested $m(\phi )$ values closest to the three $\Upsilon{(nS)}$ narrow resonances. To show how the $\Upsilon{(nS)}$ mass tails change with the kinematics, two regions of $ p_{\mathrm{ T}} $ are displayed in the plot. |
Fig3a.pdf [332 KiB] HiDef png [353 KiB] Thumbnail [266 KiB] *.C file |

|
|
Fig3b.pdf [883 KiB] HiDef png [579 KiB] Thumbnail [384 KiB] *.C file |
|
|
|
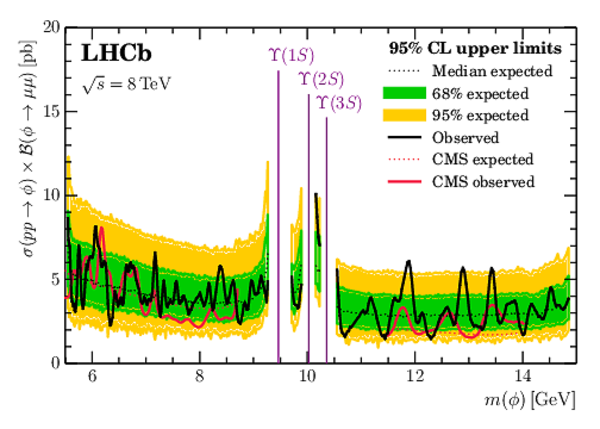
Upper limits on the direct production of a spin-0 boson decaying to $\mu^+\mu^-$ in 8 TeV $pp$ collisions. |
Fig4.pdf [250 KiB] HiDef png [475 KiB] Thumbnail [295 KiB] *.C file |
|
|
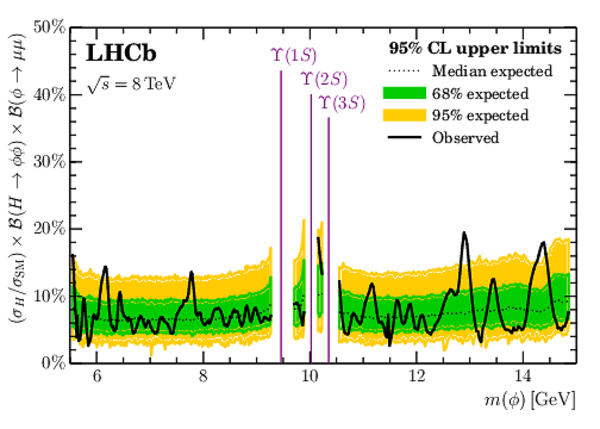
(left) Upper limits on the production of vector $A^\prime$ bosons produced in 8 TeV $pp$-collisions through Drell-Yan and decaying to $\mu^+\mu^-$. (right) Upper limits on the branching fraction of a SM Higgs decaying to two $\phi$ bosons followed by the decay of one of the two to $\mu^+\mu^-$. |
Fig5a.pdf [233 KiB] HiDef png [386 KiB] Thumbnail [252 KiB] *.C file |

|
|
Fig5b.pdf [301 KiB] HiDef png [387 KiB] Thumbnail [269 KiB] *.C file |
|
|
|
Animated gif made out of all figures. |
PAPER-2018-008.gif Thumbnail |

|
![HiDef png [221 KiB]](Directory_LHCb-PAPER-2018-008/hidef_Fig1.png)
![HiDef png [197 KiB]](Directory_LHCb-PAPER-2018-008/hidef_Fig2.png)
![HiDef png [353 KiB]](Directory_LHCb-PAPER-2018-008/hidef_Fig3a.png)
![HiDef png [579 KiB]](Directory_LHCb-PAPER-2018-008/hidef_Fig3b.png)
![HiDef png [475 KiB]](Directory_LHCb-PAPER-2018-008/hidef_Fig4.png)
![HiDef png [386 KiB]](Directory_LHCb-PAPER-2018-008/hidef_Fig5a.png)
![HiDef png [387 KiB]](Directory_LHCb-PAPER-2018-008/hidef_Fig5b.png)
Created on 27 April 2024.