Measurement of $CP$ violation in $B^{0}\rightarrow D^{\mp}\pi^{\pm}$ decays
[to restricted-access page]Information
LHCb-PAPER-2018-009
CERN-EP-2018-084
arXiv:1805.03448 [PDF]
(Submitted on 09 May 2018)
JHEP 06 (2018) 084
Inspire 1672368
Tools
Abstract
A measurement of the $CP$ asymmetries $S_{f}$ and $S_{\bar{f}}$ in $B^0\to D^{\mp}\pi^{\pm}$ decays is reported. The decays are reconstructed in a dataset collected with the LHCb experiment in proton-proton collisions at centre-of-mass energies of 7 and 8 TeV and corresponding to an integrated luminosity of $3.0 \rm{ fb}^{-1}$. The $CP$ asymmetries are measured to be $S_{f} = 0.058 \pm 0.020 (\rm{stat}) \pm 0.011(\rm{syst})$ and $S_{\bar{f}} = 0.038\pm 0.020 (\text{stat})\pm 0.007 (\text{syst})$. These results are in agreement with, and more precise than, previous determinations. They are used to constrain $|\sin\left(2\beta+\gamma\right)|$ and $\gamma$ to intervals that are consistent with the current world-average values.
Figures and captions
|
Invariant mass distributions of the (left) pion-like and (right) kaon-like samples with fit projections overlaid. The simultaneous fit of the two distributions is described in the text and yields a $\chi^2$ per degree of freedom of 1.18. The $B\rightarrow D ^\mp \rho$ component includes both $ B ^0 \rightarrow D ^\mp \rho^\pm$ and $ B ^\mp \rightarrow D ^\mp \rho^0$ decays. |
Fig1_a.pdf [60 KiB] HiDef png [264 KiB] Thumbnail [182 KiB] *.C file |

|
|
Fig1_b.pdf [62 KiB] HiDef png [302 KiB] Thumbnail [204 KiB] *.C file |

|
|
|
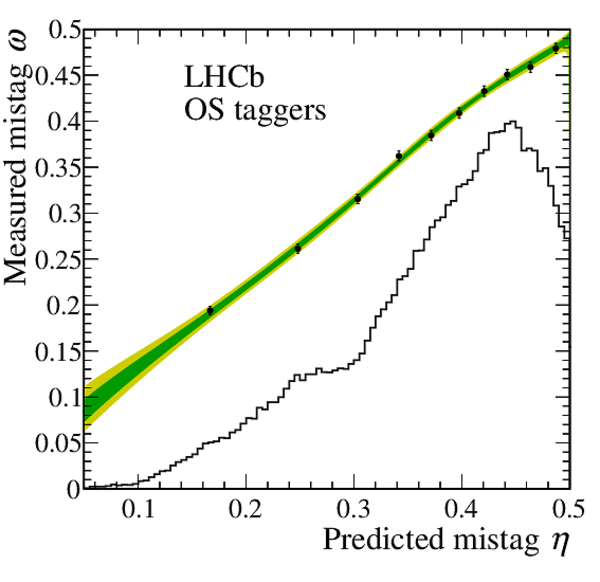
Measured mistag fraction $\omega$ versus predicted mistag probability $\eta$ of the combination of (left) OS and (right) SS taggers as determined in signal decays with the fit described in Sect. 6. The black histograms are the distributions of the mistag probabilities in arbitrary units. The shaded areas correspond to the 68% and 95% confidence-level regions of the calibration functions and do not include systematic uncertainties on the parameters. The calibration functions and the distributions of mistag probabilities are shown summing over candidates tagged as either $ B ^0$ or $\overline{ B }{} {}^0$ . |
Fig2_a.pdf [101 KiB] HiDef png [268 KiB] Thumbnail [222 KiB] *.C file |
|
|
Fig2_b.pdf [101 KiB] HiDef png [246 KiB] Thumbnail [208 KiB] *.C file |

|
|
|
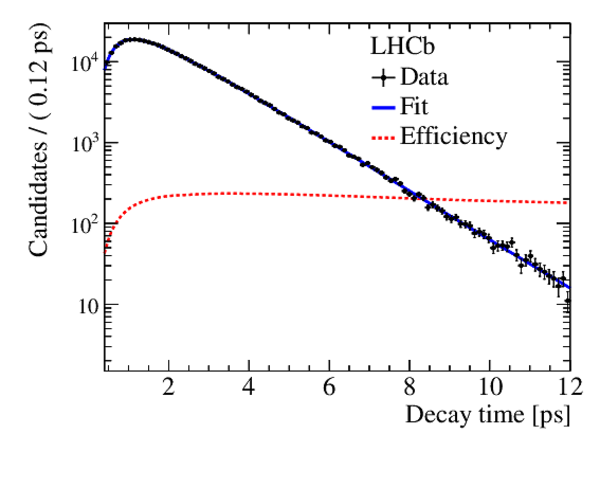
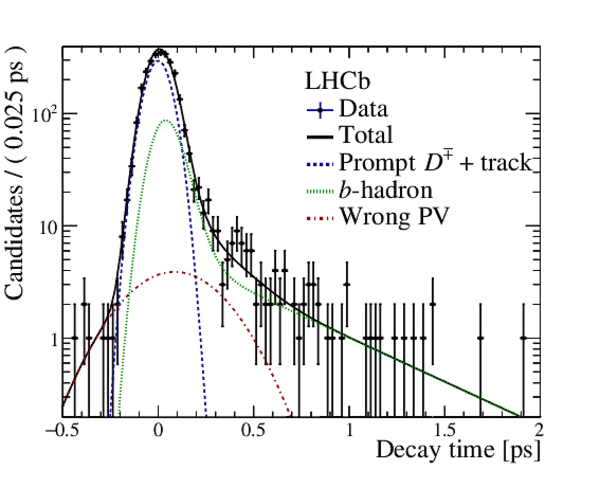
Background-subtracted decay-time distribution for tagged candidates. The solid blue curve is the projection of the signal PDF. The red dotted curve indicates the efficiency function $\varepsilon\left(t\right)$ in arbitrary units. |
Fig3.pdf [34 KiB] HiDef png [165 KiB] Thumbnail [144 KiB] *.C file |
|
|
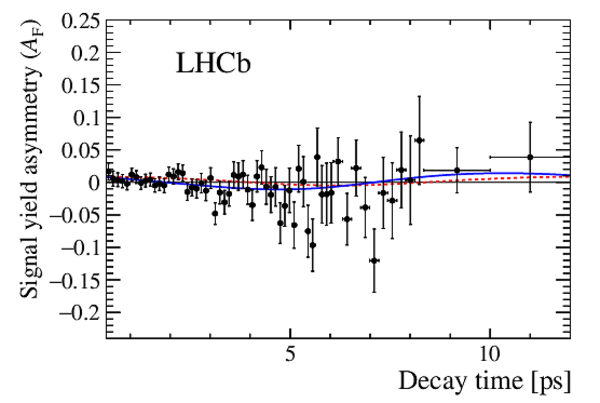
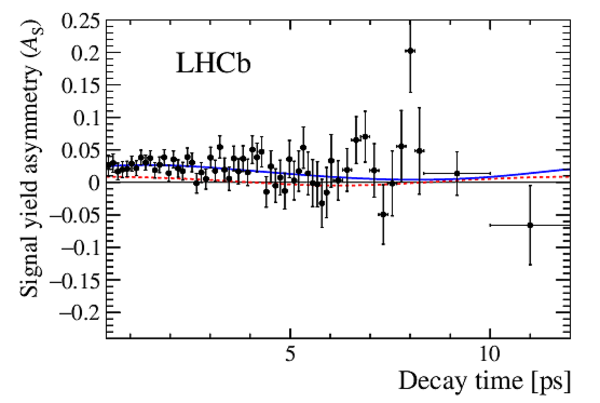
Decay-time-dependent signal-yield asymmetries for (left) the favoured and (right) the suppressed decays. The signal-yield asymmetries are defined in Eq. 12 and Eq. 13. The blue solid curve is the projection of the signal PDF, the red dotted curve indicates the projection of the fit when $ C P$ conservation is imposed. |
Fig4_a.pdf [22 KiB] HiDef png [172 KiB] Thumbnail [157 KiB] *.C file |
|
|
Fig4_b.pdf [22 KiB] HiDef png [173 KiB] Thumbnail [159 KiB] *.C file |
|
|
|
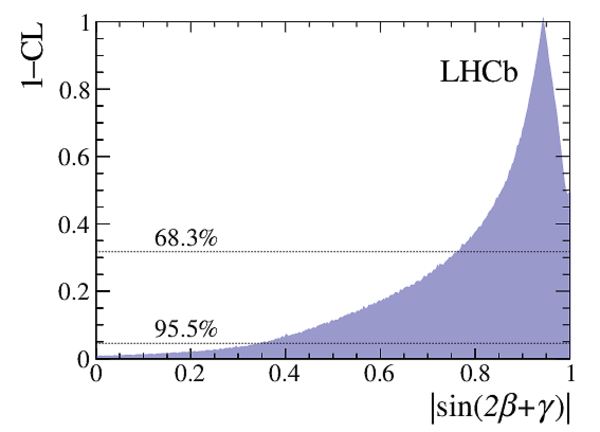
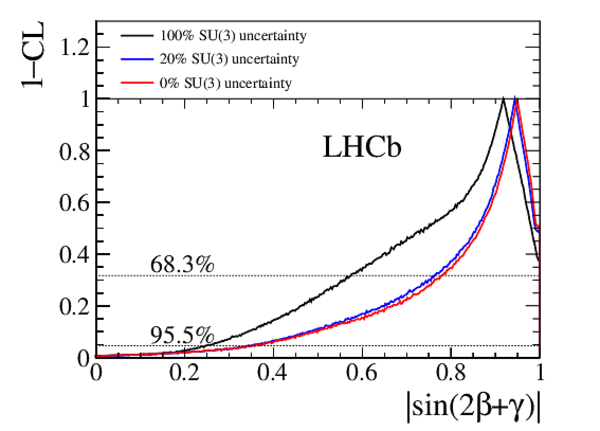
1--CL as a function of $|\sin(2\beta+\gamma)|$. |
Fig5.pdf [16 KiB] HiDef png [165 KiB] Thumbnail [127 KiB] *.C file |
|
|
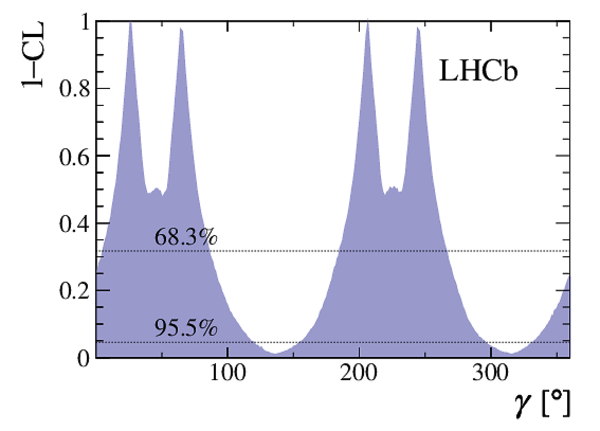
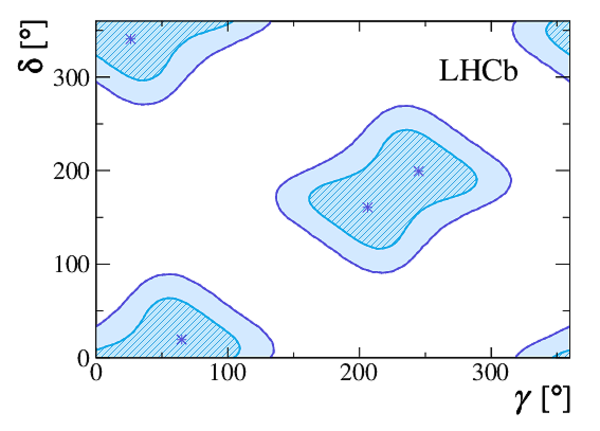
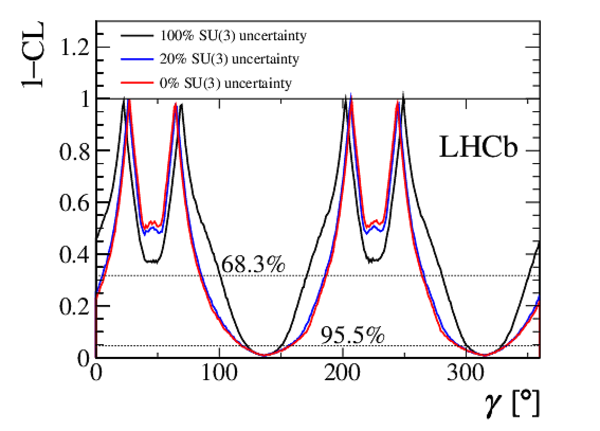
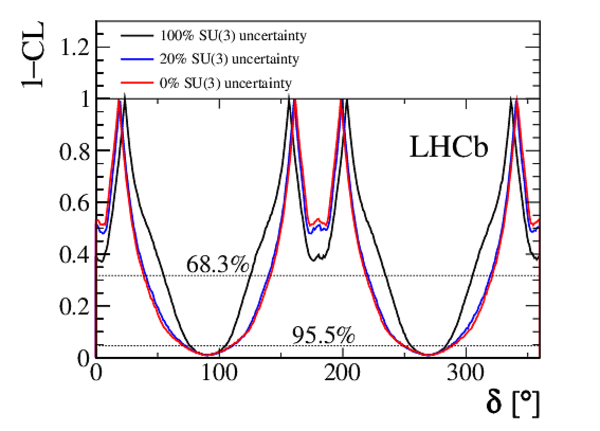
(Left) 1--CL as a function of $\gamma$ and (right) confidence regions for $\gamma$ and $\delta$. The confidence regions hold the $39\%$ and $87\%$ CL. Points denote the preferred values. |
Fig6_a.pdf [16 KiB] HiDef png [232 KiB] Thumbnail [144 KiB] *.C file |
|
|
Fig6_b.pdf [18 KiB] HiDef png [463 KiB] Thumbnail [256 KiB] *.C file |
|
|
|
Animated gif made out of all figures. |
PAPER-2018-009.gif Thumbnail |

|
Tables and captions
|
Systematic uncertainties on the $ C P$ asymmetries $S_{f}$ and $S_{\bar f}$. The total uncertainty is the sum in quadrature of the individual contributions. |
Table_1.pdf [57 KiB] HiDef png [133 KiB] Thumbnail [48 KiB] tex code |

|
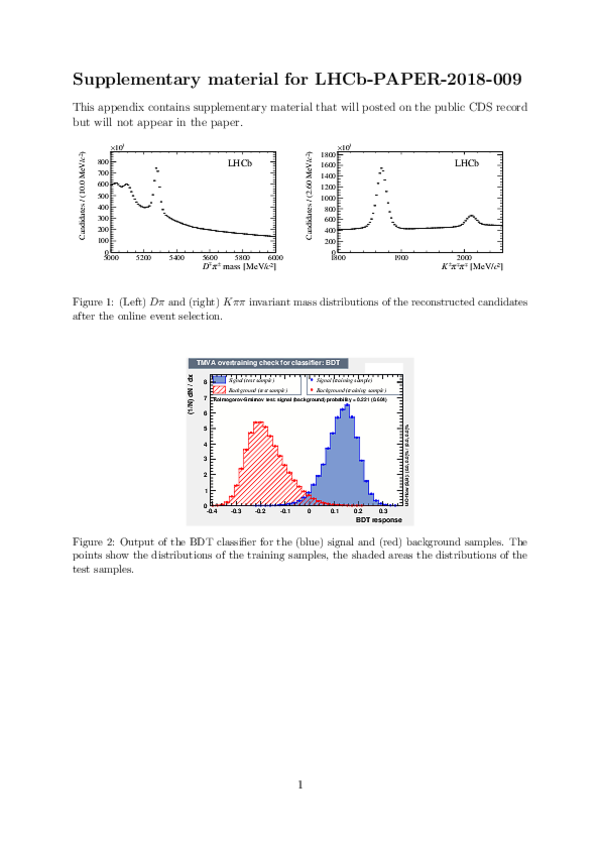
Supplementary Material [file]


![HiDef png [264 KiB]](Directory_LHCb-PAPER-2018-009/hidef_Fig1_a.png)
![HiDef png [302 KiB]](Directory_LHCb-PAPER-2018-009/hidef_Fig1_b.png)
![HiDef png [268 KiB]](Directory_LHCb-PAPER-2018-009/hidef_Fig2_a.png)
![HiDef png [246 KiB]](Directory_LHCb-PAPER-2018-009/hidef_Fig2_b.png)
![HiDef png [165 KiB]](Directory_LHCb-PAPER-2018-009/hidef_Fig3.png)
![HiDef png [172 KiB]](Directory_LHCb-PAPER-2018-009/hidef_Fig4_a.png)
![HiDef png [173 KiB]](Directory_LHCb-PAPER-2018-009/hidef_Fig4_b.png)
![HiDef png [165 KiB]](Directory_LHCb-PAPER-2018-009/hidef_Fig5.png)
![HiDef png [232 KiB]](Directory_LHCb-PAPER-2018-009/hidef_Fig6_a.png)
![HiDef png [463 KiB]](Directory_LHCb-PAPER-2018-009/hidef_Fig6_b.png)
![HiDef png [133 KiB]](Directory_LHCb-PAPER-2018-009/hidef_Table_1.png)
![HiDef png [108 KiB]](Directory_LHCb-PAPER-2018-009/supplementary/hidef_Fig1-S_a.png)
![HiDef png [98 KiB]](Directory_LHCb-PAPER-2018-009/supplementary/hidef_Fig1-S_b.png)
![HiDef png [318 KiB]](Directory_LHCb-PAPER-2018-009/supplementary/hidef_Fig10-S.png)
![HiDef png [321 KiB]](Directory_LHCb-PAPER-2018-009/supplementary/hidef_Fig11-S.png)
![HiDef png [221 KiB]](Directory_LHCb-PAPER-2018-009/supplementary/hidef_Fig12-S.png)
![HiDef png [586 KiB]](Directory_LHCb-PAPER-2018-009/supplementary/hidef_Fig2-S.png)
![HiDef png [271 KiB]](Directory_LHCb-PAPER-2018-009/supplementary/hidef_Fig3-S_a.png)
![HiDef png [261 KiB]](Directory_LHCb-PAPER-2018-009/supplementary/hidef_Fig3-S_b.png)
![HiDef png [276 KiB]](Directory_LHCb-PAPER-2018-009/supplementary/hidef_Fig4-S.png)
![HiDef png [185 KiB]](Directory_LHCb-PAPER-2018-009/supplementary/hidef_Fig5-S.png)
![HiDef png [150 KiB]](Directory_LHCb-PAPER-2018-009/supplementary/hidef_Fig6-S_a.png)
![HiDef png [147 KiB]](Directory_LHCb-PAPER-2018-009/supplementary/hidef_Fig6-S_b.png)
![HiDef png [209 KiB]](Directory_LHCb-PAPER-2018-009/supplementary/hidef_Fig7-S.png)
![HiDef png [228 KiB]](Directory_LHCb-PAPER-2018-009/supplementary/hidef_Fig8-S.png)
![HiDef png [224 KiB]](Directory_LHCb-PAPER-2018-009/supplementary/hidef_Fig9-S.png)
Created on 02 May 2024.