Measurement of $D_s^{\pm}$ production asymmetry in $pp$ collisions at $\sqrt{s} =7$ and 8 TeV
[to restricted-access page]Information
LHCb-PAPER-2018-010
CERN-EP-2018-073
arXiv:1805.09869 [PDF]
(Submitted on 24 May 2018)
JHEP 08 (2018) 008
Inspire 1674916
Tools
Abstract
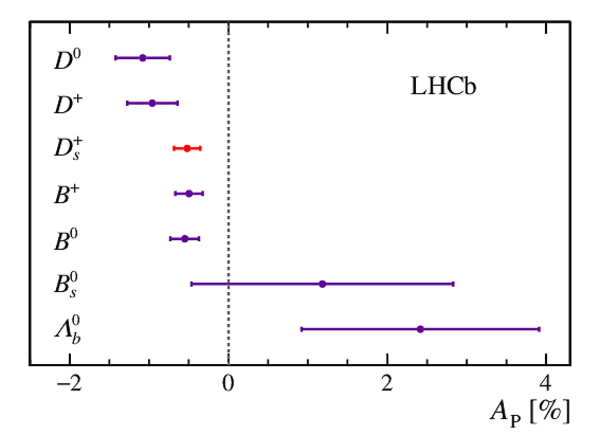
The inclusive $D_s^{\pm}$ production asymmetry is measured in $pp$ collisions collected by the LHCb experiment at centre-of-mass energies of $\sqrt{s} =7$ and 8 TeV. Promptly produced $D_s^{\pm}$ mesons are used, which decay as $D_s^{\pm}\to\phi\pi^{\pm}$, with $\phi\to K^+K^-$. The measurement is performed in bins of transverse momentum, $p_{\rm T}$, and rapidity, $y$, covering the range $2.5<p_{\rm T}<25.0$ GeV$/c$ and $2.0<y<4.5$. No kinematic dependence is observed. Evidence of nonzero $D_s^{\pm}$ production asymmetry is found with a significance of 3.3 standard deviations.
Figures and captions
|
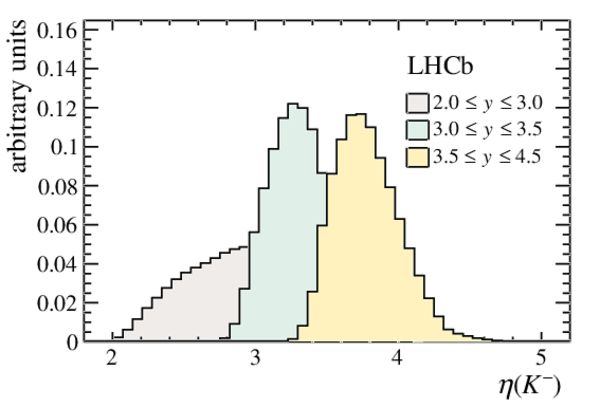
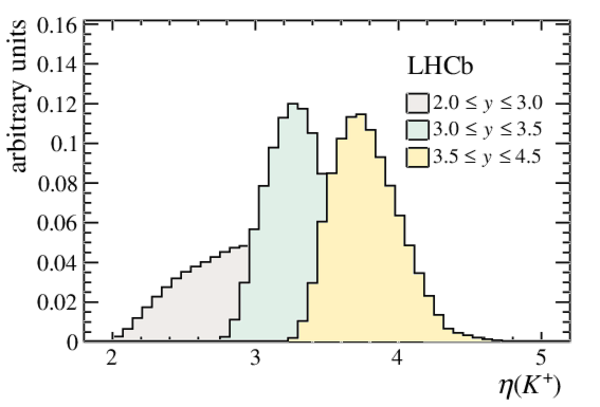
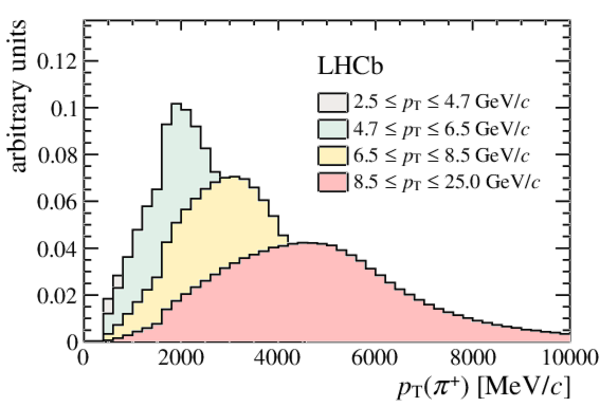
Distribution of $ D ^+_ s $ candidates for the $\sqrt{s} =7$ and 8 TeV data sets as a function of $p_{\mathrm{ T}}$ and $ y$ . The binning scheme used for the $ A_{\rm P}( D ^+_ s )$ measurement is overlaid. |
Fig1a.pdf [148 KiB] HiDef png [1 MiB] Thumbnail [543 KiB] *.C file |

|
|
Fig1b.pdf [170 KiB] HiDef png [1 MiB] Thumbnail [581 KiB] *.C file |

|
|
|
Invariant mass distribution of the $ D ^+_ s $ candidates in the kinematic range (left) $2.0<y<3.0$ and $2.5< p_{\mathrm{ T}} <4.7 {\mathrm{ Ge V /}c} $, and (right) $3.5<y<4.5$ and $8.5< p_{\mathrm{ T}} <25.0 {\mathrm{ Ge V /}c} $ for the $\sqrt{s} =8$ TeV data set recorded with MagDown . Also shown is the result of the fit, indicating the signal and combinatorial background. |
Fig2a.pdf [67 KiB] HiDef png [289 KiB] Thumbnail [209 KiB] *.C file |

|
|
Fig2b.pdf [65 KiB] HiDef png [312 KiB] Thumbnail [236 KiB] *.C file |

|
|
|
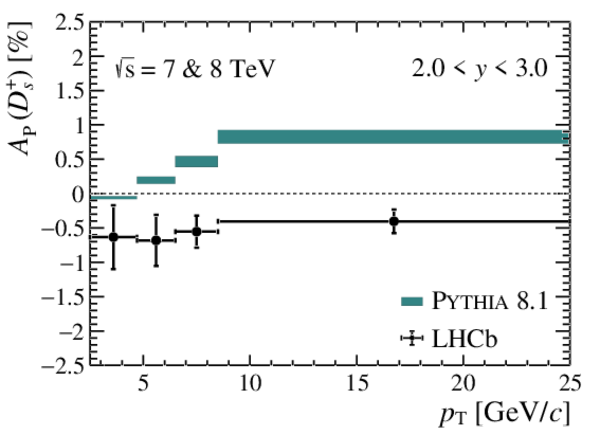
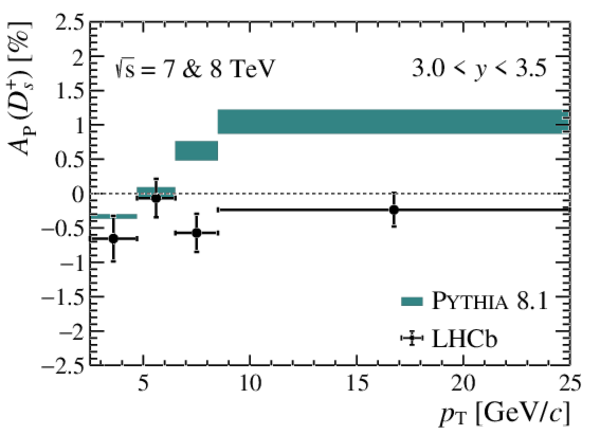
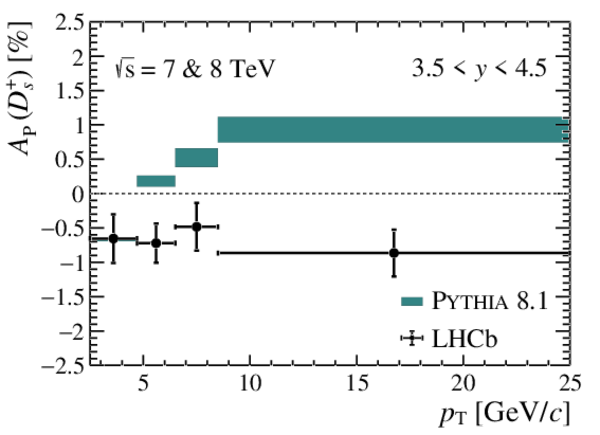
Results of the LHCb measurement of the $ D ^+_ s $ production asymmetry as a function of $p_{\mathrm{ T}}$ for three different bins of rapidity, compared to the results from Pythia . Both are for the combined $\sqrt{s} =7$ and 8 TeV data sets. The uncertainties on the Pythia predictions are statistical only. |
Fig3a.pdf [14 KiB] HiDef png [180 KiB] Thumbnail [157 KiB] *.C file |
|
|
Fig3b.pdf [14 KiB] HiDef png [182 KiB] Thumbnail [156 KiB] *.C file |
|
|
|
Fig3c.pdf [14 KiB] HiDef png [180 KiB] Thumbnail [155 KiB] *.C file |
|
|
|
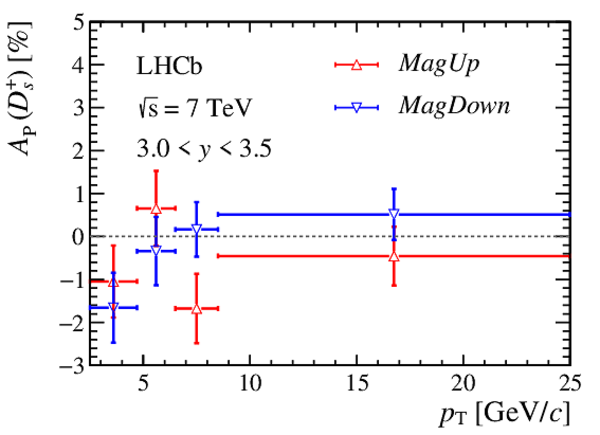
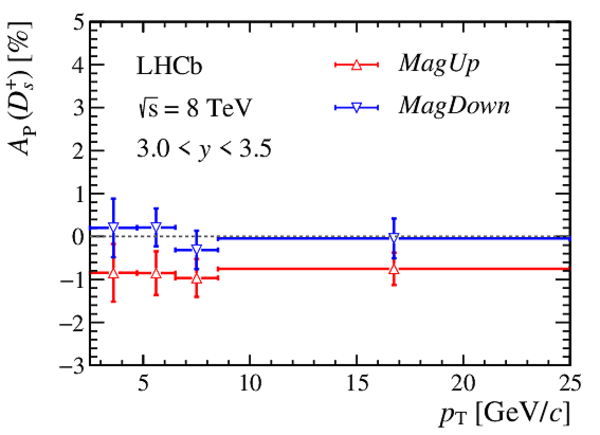
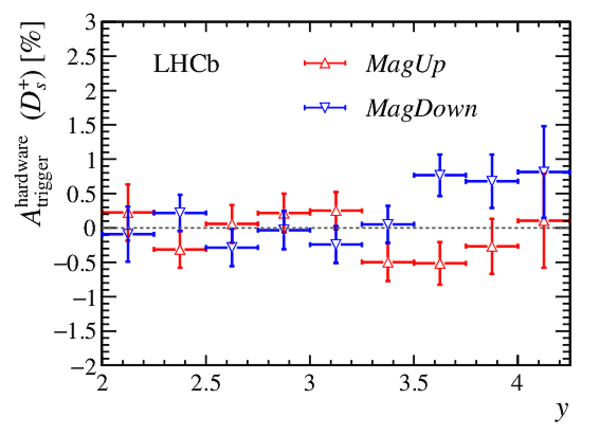
Results of the LHCb measurement of the $ D ^+_ s $ production asymmetry as a function of $p_{\mathrm{ T}}$ for three different bins of rapidity for the (left) $\sqrt{s} =7\mathrm{ Te V} $ and (right) $8\mathrm{ Te V} $ data sets, split between the magnet polarities Mag Up and MagDown . |
Fig4a.pdf [14 KiB] HiDef png [143 KiB] Thumbnail [141 KiB] *.C file |

|
|
Fig4b.pdf [14 KiB] HiDef png [142 KiB] Thumbnail [142 KiB] *.C file |

|
|
|
Fig4c.pdf [14 KiB] HiDef png [143 KiB] Thumbnail [142 KiB] *.C file |
|
|
|
Fig4d.pdf [14 KiB] HiDef png [145 KiB] Thumbnail [143 KiB] *.C file |
|
|
|
Fig4e.pdf [14 KiB] HiDef png [141 KiB] Thumbnail [140 KiB] *.C file |

|
|
|
Fig4f.pdf [14 KiB] HiDef png [142 KiB] Thumbnail [142 KiB] *.C file |

|
|
|
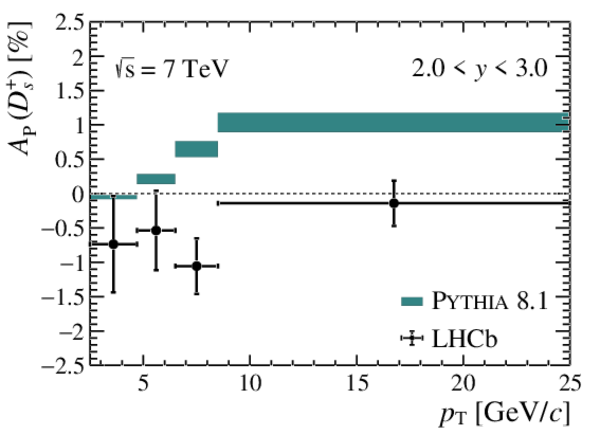
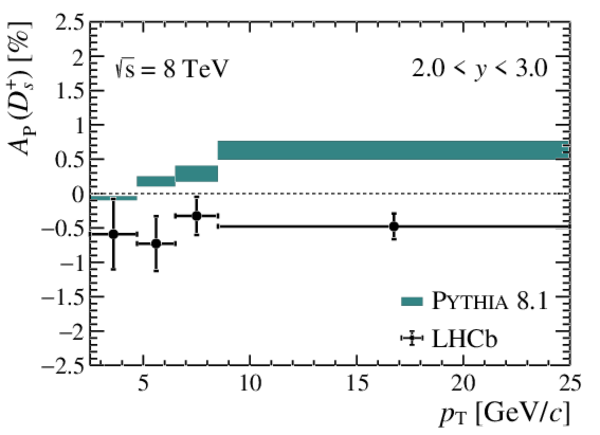
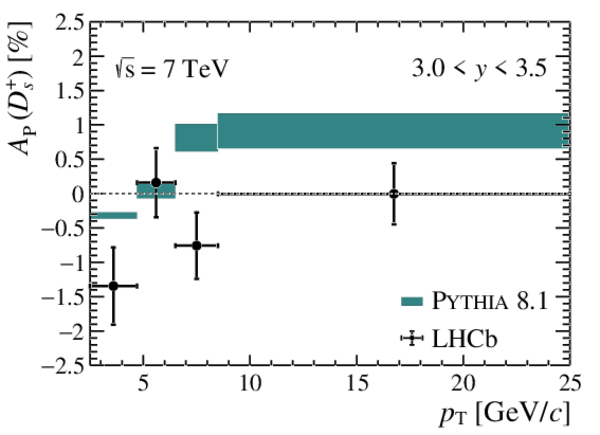
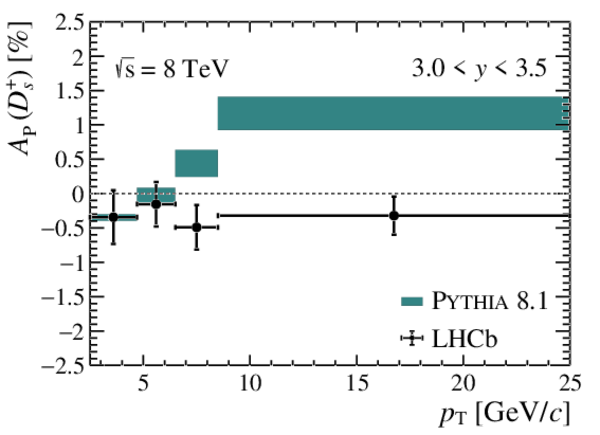
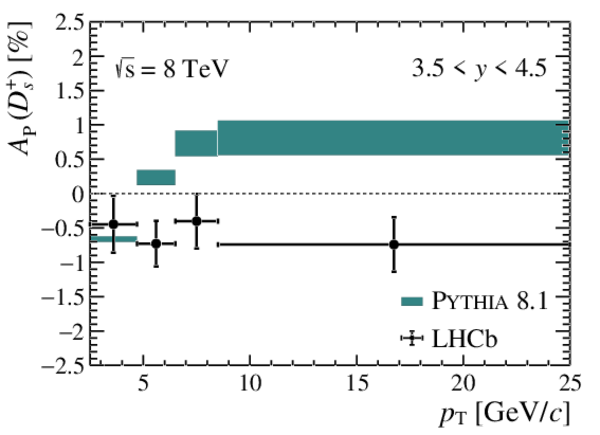
Results of the LHCb measurement of the $ D ^+_ s $ production asymmetry as a function of $p_{\mathrm{ T}}$ for three different bins of rapidity for the (left) $\sqrt{s} =7\mathrm{ Te V} $ and (right) $8\mathrm{ Te V} $ data sets, compared to the results from Pythia . The uncertainties of the Pythia prediction are statistical only. |
Fig5a.pdf [14 KiB] HiDef png [178 KiB] Thumbnail [154 KiB] *.C file |
|
|
Fig5b.pdf [14 KiB] HiDef png [177 KiB] Thumbnail [155 KiB] *.C file |
|
|
|
Fig5c.pdf [14 KiB] HiDef png [182 KiB] Thumbnail [156 KiB] *.C file |
|
|
|
Fig5d.pdf [14 KiB] HiDef png [179 KiB] Thumbnail [154 KiB] *.C file |
|
|
|
Fig5e.pdf [14 KiB] HiDef png [177 KiB] Thumbnail [154 KiB] *.C file |

|
|
|
Fig5f.pdf [14 KiB] HiDef png [177 KiB] Thumbnail [153 KiB] *.C file |
|
|
|
Animated gif made out of all figures. |
PAPER-2018-010.gif Thumbnail |

|
![HiDef png [1 MiB]](Directory_LHCb-PAPER-2018-010/hidef_Fig1a.png)
![HiDef png [1 MiB]](Directory_LHCb-PAPER-2018-010/hidef_Fig1b.png)
![HiDef png [289 KiB]](Directory_LHCb-PAPER-2018-010/hidef_Fig2a.png)
![HiDef png [312 KiB]](Directory_LHCb-PAPER-2018-010/hidef_Fig2b.png)
![HiDef png [180 KiB]](Directory_LHCb-PAPER-2018-010/hidef_Fig3a.png)
![HiDef png [182 KiB]](Directory_LHCb-PAPER-2018-010/hidef_Fig3b.png)
![HiDef png [180 KiB]](Directory_LHCb-PAPER-2018-010/hidef_Fig3c.png)
![HiDef png [143 KiB]](Directory_LHCb-PAPER-2018-010/hidef_Fig4a.png)
![HiDef png [142 KiB]](Directory_LHCb-PAPER-2018-010/hidef_Fig4b.png)
![HiDef png [143 KiB]](Directory_LHCb-PAPER-2018-010/hidef_Fig4c.png)
![HiDef png [145 KiB]](Directory_LHCb-PAPER-2018-010/hidef_Fig4d.png)
![HiDef png [141 KiB]](Directory_LHCb-PAPER-2018-010/hidef_Fig4e.png)
![HiDef png [142 KiB]](Directory_LHCb-PAPER-2018-010/hidef_Fig4f.png)
![HiDef png [178 KiB]](Directory_LHCb-PAPER-2018-010/hidef_Fig5a.png)
![HiDef png [177 KiB]](Directory_LHCb-PAPER-2018-010/hidef_Fig5b.png)
![HiDef png [182 KiB]](Directory_LHCb-PAPER-2018-010/hidef_Fig5c.png)
![HiDef png [179 KiB]](Directory_LHCb-PAPER-2018-010/hidef_Fig5d.png)
![HiDef png [177 KiB]](Directory_LHCb-PAPER-2018-010/hidef_Fig5e.png)
![HiDef png [177 KiB]](Directory_LHCb-PAPER-2018-010/hidef_Fig5f.png)
Tables and captions
|
Raw and detection asymmetries in percent, for the 7 and 8 TeV data sets. The detection asymmetries are determined on the data combined from all kinematic bins. The first uncertainty is statistical, the second systematic. |
Table_1.pdf [61 KiB] HiDef png [88 KiB] Thumbnail [41 KiB] tex code |

|
|
Values of the $ D ^+_ s $ production asymmetry in percent, including, respectively, the statistical and systematic uncertainties for each of the $ D ^+_ s $ kinematic bins using the combined $\sqrt{s} =7$ and $8\mathrm{ Te V} $ data sets. The statistical and systematic uncertainties include the corresponding contributions from the detection asymmetries, and are therefore correlated between the bins. |
Table_2.pdf [48 KiB] HiDef png [48 KiB] Thumbnail [23 KiB] tex code |

|
|
Values of the $ D ^+_ s $ production asymmetry in percent, including, respectively, the statistical and systematic uncertainty for each of the $ D ^+_ s $ kinematic bins using the $\sqrt{s} =7\mathrm{ Te V} $ data set. |
Table_3.pdf [48 KiB] HiDef png [46 KiB] Thumbnail [22 KiB] tex code |

|
|
Values of the $ D ^+_ s $ production asymmetry in percent, including, respectively, the statistical and systematic uncertainty for each of the $ D ^+_ s $ kinematic bins using the $\sqrt{s} =8\mathrm{ Te V} $ data set. |
Table_4.pdf [48 KiB] HiDef png [47 KiB] Thumbnail [22 KiB] tex code |

|
![HiDef png [88 KiB]](Directory_LHCb-PAPER-2018-010/hidef_Table_1.png)
![HiDef png [48 KiB]](Directory_LHCb-PAPER-2018-010/hidef_Table_2.png)
![HiDef png [46 KiB]](Directory_LHCb-PAPER-2018-010/hidef_Table_3.png)
![HiDef png [47 KiB]](Directory_LHCb-PAPER-2018-010/hidef_Table_4.png)
Supplementary Material [file]
| Supplementary material full pdf |
supple[..].pdf [248 KiB] |
|
|
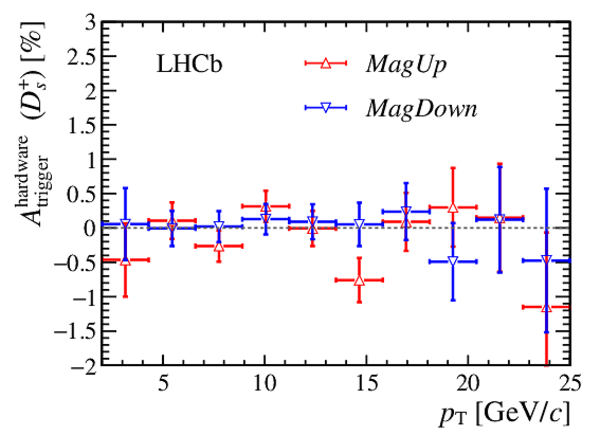
This ZIP file contains supplementary material for the publication LHCb-PAPER-2018-010. The files are: supplementary.pdf : An overview of the extra figures *.pdf, *.png, *.eps, *.C : The figures in various formats |
Fig1a.pdf [16 KiB] HiDef png [180 KiB] Thumbnail [167 KiB] *C file |
|
|
Fig1b.pdf [15 KiB] HiDef png [165 KiB] Thumbnail [156 KiB] *C file |
|
|
|
Fig2.pdf [13 KiB] HiDef png [78 KiB] Thumbnail [66 KiB] *C file |
|
|
|
Fig3a.pdf [15 KiB] HiDef png [253 KiB] Thumbnail [215 KiB] *C file |

|
|
|
Fig3b.pdf [14 KiB] HiDef png [161 KiB] Thumbnail [140 KiB] *C file |
|
|
|
Fig3c.pdf [15 KiB] HiDef png [254 KiB] Thumbnail [215 KiB] *C file |

|
|
|
Fig3d.pdf [14 KiB] HiDef png [162 KiB] Thumbnail [140 KiB] *C file |
|
|
|
Fig3e.pdf [15 KiB] HiDef png [233 KiB] Thumbnail [195 KiB] *C file |
|
|
|
Fig3f.pdf [14 KiB] HiDef png [156 KiB] Thumbnail [135 KiB] *C file |

|
![HiDef png [180 KiB]](Directory_LHCb-PAPER-2018-010/supplementary/hidef_Fig1a.png)
![HiDef png [165 KiB]](Directory_LHCb-PAPER-2018-010/supplementary/hidef_Fig1b.png)
![HiDef png [78 KiB]](Directory_LHCb-PAPER-2018-010/supplementary/hidef_Fig2.png)
![HiDef png [253 KiB]](Directory_LHCb-PAPER-2018-010/supplementary/hidef_Fig3a.png)
![HiDef png [161 KiB]](Directory_LHCb-PAPER-2018-010/supplementary/hidef_Fig3b.png)
![HiDef png [254 KiB]](Directory_LHCb-PAPER-2018-010/supplementary/hidef_Fig3c.png)
![HiDef png [162 KiB]](Directory_LHCb-PAPER-2018-010/supplementary/hidef_Fig3d.png)
![HiDef png [233 KiB]](Directory_LHCb-PAPER-2018-010/supplementary/hidef_Fig3e.png)
![HiDef png [156 KiB]](Directory_LHCb-PAPER-2018-010/supplementary/hidef_Fig3f.png)
Created on 27 April 2024.