Measurement of the time-integrated $CP$ asymmetry in $D^0 \rightarrow K^0_S K^0_S$ decays
[to restricted-access page]Information
LHCb-PAPER-2018-012
CERN-EP-2018-133
arXiv:1806.01642 [PDF]
(Submitted on 05 Jun 2018)
JHEP 11 (2018) 048
Inspire 1676395
Tools
Abstract
A measurement of the time-integrated $CP$ asymmetry in $D^0\rightarrow K^0_S K^0_S$ decays is reported. The data correspond to an integrated luminosity of about $2$ fb$^{-1}$ collected in 2015-2016 by the LHCb collaboration in $pp$ collisions at a centre-of-mass energy of $13$ TeV. The $D^0$ candidate is required to originate from a $D^{\ast +} \rightarrow D^0 \pi^+$ decay, allowing the determination of the flavour of the $D^0$ meson using the pion charge. The $D^0 \rightarrow K^{+}K^{-}$ decay, which has a well measured $CP$ asymmetry, is used as a calibration channel. The $CP$ asymmetry for $D^0\rightarrow K^0_S K^0_S$ is measured to be \begin{equation*} \mathcal{A}^{CP}(D^0\rightarrow K^0_S K^0_S) = (4.3\pm 3.4\pm 1.0)\%, \end{equation*} where the first uncertainty is statistical and the second is systematic. This result is combined with the previous LHCb measurement at lower centre-of-mass energies to obtain \begin{equation*} \mathcal{A}^{CP}(D^0\rightarrow K^0_S K^0_S) = (2.3\pm 2.8\pm 0.9)\%. \end{equation*}
Figures and captions
|
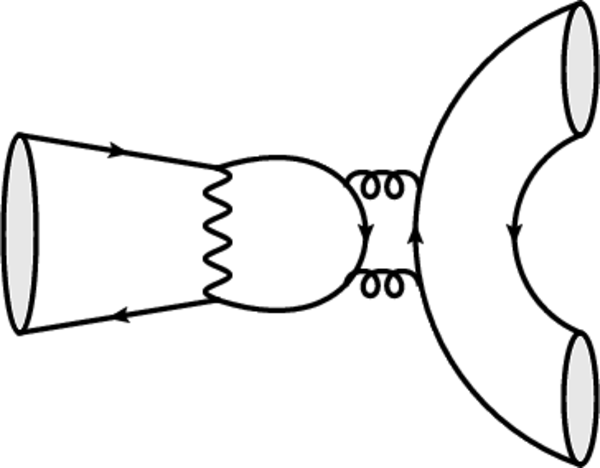
Exchange (left) and penguin annihilation (right) diagrams contributing to the $ D ^0 \rightarrow K ^0_{\mathrm{ \scriptscriptstyle S}} K ^0_{\mathrm{ \scriptscriptstyle S}} $ amplitude. Based on Ref. [5]. |
Figure_1a.pdf [5 KiB] HiDef png [95 KiB] Thumbnail [71 KiB] *.C file |

|
|
Figure_1b.pdf [6 KiB] HiDef png [105 KiB] Thumbnail [76 KiB] *.C file |
|
|
|
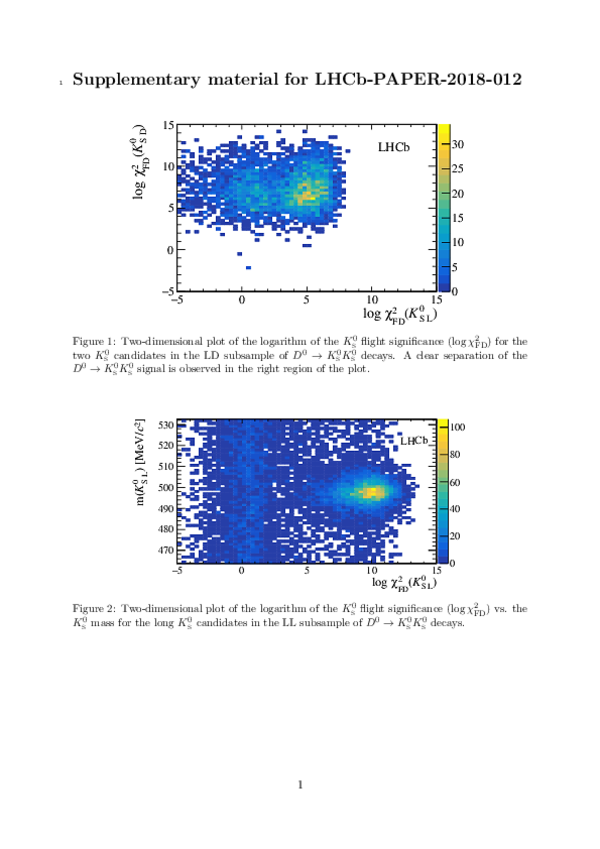
Two-dimensional distribution of the logarithm of the $ K ^0_{\mathrm{ \scriptscriptstyle S}}$ flight distance significance ($\log \chi^2_{\text{FD}} $) for the two $ K ^0_{\mathrm{ \scriptscriptstyle S}}$ candidates in the LL subsample of $ D ^0 \rightarrow K ^0_{\mathrm{ \scriptscriptstyle S}} K ^0_{\mathrm{ \scriptscriptstyle S}} $ decays. The $ D ^0 \rightarrow K ^0_{\mathrm{ \scriptscriptstyle S}} K ^0_{\mathrm{ \scriptscriptstyle S}} $ signal can be observed in the upper right region of the plot. The contour corresponds to Eq. 6. |
Figure_2.pdf [24 KiB] HiDef png [527 KiB] Thumbnail [473 KiB] *.C file |

|
|
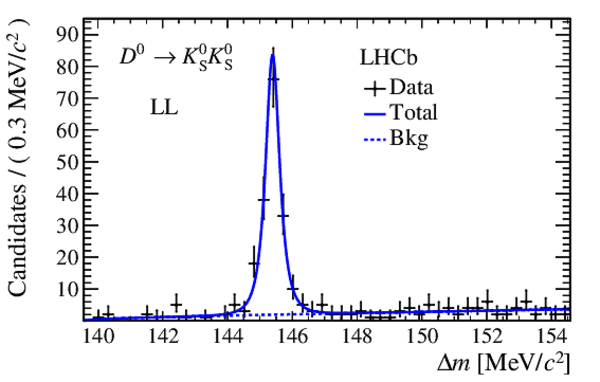
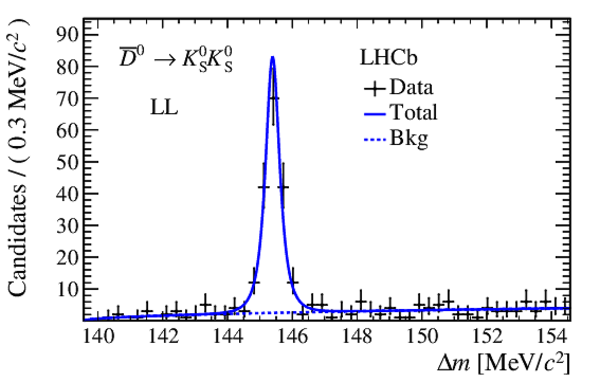
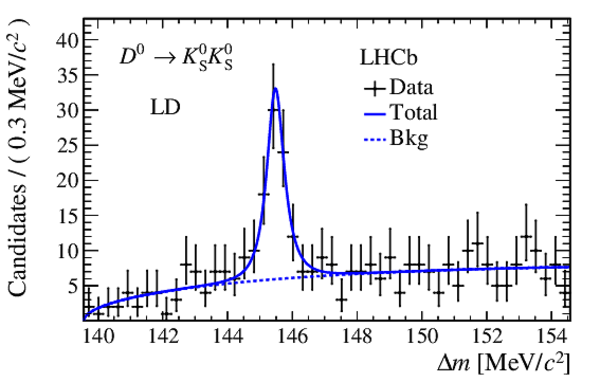
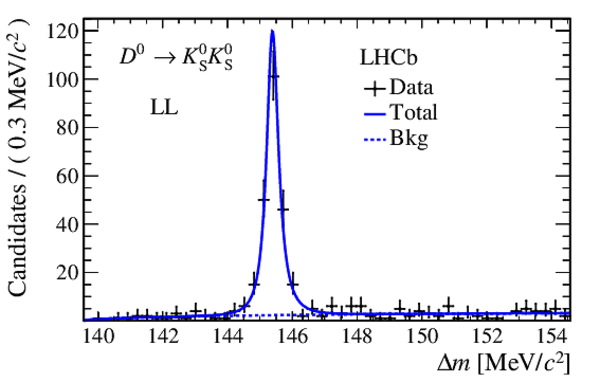
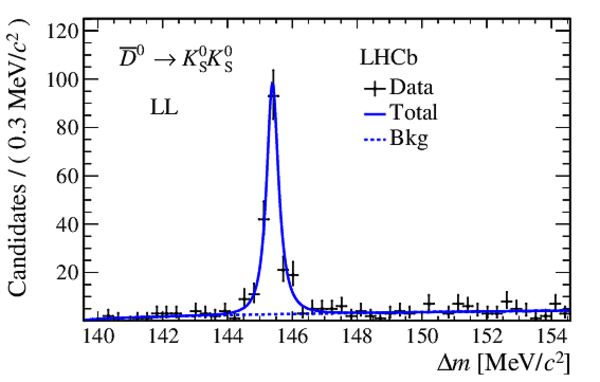
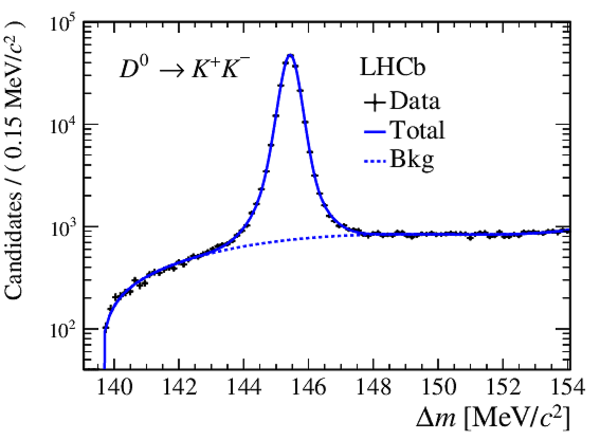
Results of fits to $\Delta m$ distributions of $ D ^0 \rightarrow K ^0_{\mathrm{ \scriptscriptstyle S}} K ^0_{\mathrm{ \scriptscriptstyle S}} $ candidates for MagUp magnet polarity. The fit to (a) $D^{\ast +} \rightarrow D ^0 \pi ^+ $ and (b) $D^{\ast -} \rightarrow \overline{ D }{} {}^0 \pi ^- $ candidates for the LL sample and the fit to (c) $D^{\ast +} \rightarrow D ^0 \pi ^+ $ and (d) $D^{\ast -} \rightarrow \overline{ D }{} {}^0 \pi ^- $ candidates for the LD sample are shown. The black crosses represent the data points, the solid blue curve is the total fit function, and the dashed blue curve is the background component of the fit. |
Figure_3a.pdf [19 KiB] HiDef png [193 KiB] Thumbnail [178 KiB] *.C file |
|
|
Figure_3b.pdf [19 KiB] HiDef png [195 KiB] Thumbnail [181 KiB] *.C file |
|
|
|
Figure_3c.pdf [19 KiB] HiDef png [199 KiB] Thumbnail [191 KiB] *.C file |
|
|
|
Figure_3d.pdf [19 KiB] HiDef png [199 KiB] Thumbnail [190 KiB] *.C file |

|
|
|
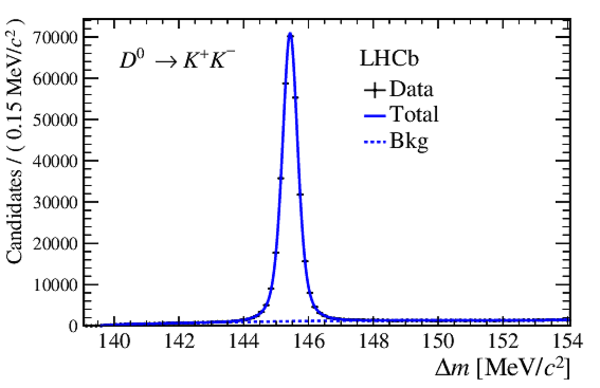
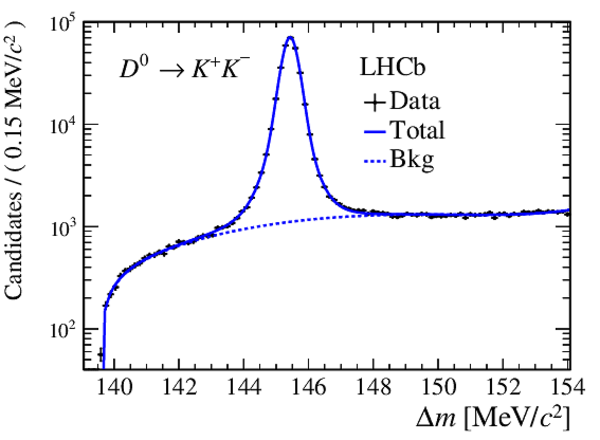
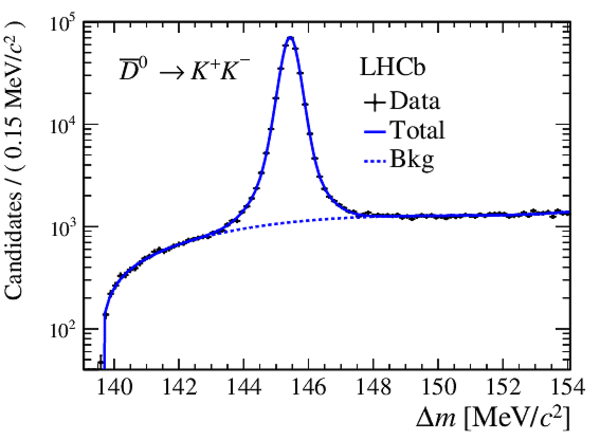
Results of fits to $\Delta m$ distributions of $ D ^0 \rightarrow K^+K^-$ candidates for the MagUp magnet polarity. The fits to (a) $D^{\ast +} \rightarrow D ^0 \pi ^+ $ candidates and (b) $D^{\ast -} \rightarrow \overline{ D }{} {}^0 \pi ^- $ candidates are shown. The black points represent the data, the dashed blue and solid blue curves represent the background component and the total fit function, respectively. |
Figure_4a.pdf [27 KiB] HiDef png [195 KiB] Thumbnail [168 KiB] *.C file |

|
|
Figure_4b.pdf [26 KiB] HiDef png [177 KiB] Thumbnail [144 KiB] *.C file |

|
|
|
Values of $ {\Delta\mathcal{A}}^{ C P }$ obtained for both magnet polarities on the LL and LD samples, along with the average of these measurements. Only statistical uncertainties are shown. |
Figure_5.pdf [13 KiB] HiDef png [313 KiB] Thumbnail [192 KiB] *.C file |

|
|
Animated gif made out of all figures. |
PAPER-2018-012.gif Thumbnail |

|
Tables and captions
|
Fit results on the $ D ^0 \rightarrow K ^0_{\mathrm{ \scriptscriptstyle S}} K ^0_{\mathrm{ \scriptscriptstyle S}} $ LL and LD samples for each magnet polarity, where $N_{\mathrm{obs}}$ represents the number of candidates fitted. The purity is determined in the range $ 144.5 < \Delta m < 146.5 {\mathrm{ Me V /}c^2} $. For each sample, a $\chi^2 $ test statistic for the fitted model and binned data for positively and negatively charged candidates is constructed. The quantity $\mathcal{P}_{\rm fit}$ is the probability of observing a $\chi^2 $ value greater than that observed in the fit to real data, determined using simulated pseudoexperiments sampled from the fitted model. |
Table_1.pdf [55 KiB] HiDef png [51 KiB] Thumbnail [22 KiB] tex code |

|
|
Systematic uncertainties on the quantities $ {\mathcal{A}}^{\mathrm{raw}}$ and $\Delta {\mathcal{A}}^{ C P } $. The total systematic uncertainties in the last row are obtained by summing the corresponding contributions in each column in quadrature. Uncertainties are expressed in units of $10^{-3}$. |
Table_2.pdf [76 KiB] HiDef png [54 KiB] Thumbnail [25 KiB] tex code |

|
Supplementary Material [file]


![HiDef png [95 KiB]](Directory_LHCb-PAPER-2018-012/hidef_Figure_1a.png)
![HiDef png [105 KiB]](Directory_LHCb-PAPER-2018-012/hidef_Figure_1b.png)
![HiDef png [527 KiB]](Directory_LHCb-PAPER-2018-012/hidef_Figure_2.png)
![HiDef png [193 KiB]](Directory_LHCb-PAPER-2018-012/hidef_Figure_3a.png)
![HiDef png [195 KiB]](Directory_LHCb-PAPER-2018-012/hidef_Figure_3b.png)
![HiDef png [199 KiB]](Directory_LHCb-PAPER-2018-012/hidef_Figure_3c.png)
![HiDef png [199 KiB]](Directory_LHCb-PAPER-2018-012/hidef_Figure_3d.png)
![HiDef png [195 KiB]](Directory_LHCb-PAPER-2018-012/hidef_Figure_4a.png)
![HiDef png [177 KiB]](Directory_LHCb-PAPER-2018-012/hidef_Figure_4b.png)
![HiDef png [313 KiB]](Directory_LHCb-PAPER-2018-012/hidef_Figure_5.png)
![HiDef png [51 KiB]](Directory_LHCb-PAPER-2018-012/hidef_Table_1.png)
![HiDef png [54 KiB]](Directory_LHCb-PAPER-2018-012/hidef_Table_2.png)
![HiDef png [257 KiB]](Directory_LHCb-PAPER-2018-012/supplementary/hidef_Figure_1S.png)
![HiDef png [393 KiB]](Directory_LHCb-PAPER-2018-012/supplementary/hidef_Figure_2S.png)
![HiDef png [184 KiB]](Directory_LHCb-PAPER-2018-012/supplementary/hidef_Figure_3aS.png)
![HiDef png [181 KiB]](Directory_LHCb-PAPER-2018-012/supplementary/hidef_Figure_3bS.png)
![HiDef png [200 KiB]](Directory_LHCb-PAPER-2018-012/supplementary/hidef_Figure_3cS.png)
![HiDef png [204 KiB]](Directory_LHCb-PAPER-2018-012/supplementary/hidef_Figure_3dS.png)
![HiDef png [187 KiB]](Directory_LHCb-PAPER-2018-012/supplementary/hidef_Figure_4aS.png)
![HiDef png [187 KiB]](Directory_LHCb-PAPER-2018-012/supplementary/hidef_Figure_4bS.png)
![HiDef png [179 KiB]](Directory_LHCb-PAPER-2018-012/supplementary/hidef_Figure_5aS.png)
![HiDef png [177 KiB]](Directory_LHCb-PAPER-2018-012/supplementary/hidef_Figure_5bS.png)
![HiDef png [178 KiB]](Directory_LHCb-PAPER-2018-012/supplementary/hidef_Figure_6aS.png)
![HiDef png [180 KiB]](Directory_LHCb-PAPER-2018-012/supplementary/hidef_Figure_6bS.png)
Created on 27 April 2024.