Observation of $B_s^0 \to \overline{D}^{*0} \phi$ and search for $B^0 \to \overline{D}^0 \phi$ decays
[to restricted-access page]Information
LHCb-PAPER-2018-015
CERN-EP-2018-158
arXiv:1807.01892 [PDF]
(Submitted on 05 Jul 2018)
Phys. Rev. D98 071103(R) (2018)
Inspire 1681146
Tools
Abstract
The first observation of the $B_s^0 \to \overline{D}^{*0} \phi$ decay is reported, with a significance of more than seven standard deviations, from an analysis of $pp$ collision data corresponding to an integrated luminosity of 3 fb$^{-1}$, collected with the LHCb detector at centre-of-mass energies of $7$ and $8$ TeV. The branching fraction is measured relative to that of the topologically similar decay $B^0 \to \overline{D}^0 \pi^+\pi^-$ and is found to be $\mathcal{B}(B_s^0 \to \overline{D}^{*0} \phi) = (3.7 \pm 0.5 \pm 0.3 \pm 0.2) \times 10^{-5}$, where the first uncertainty is statistical, the second systematic, and the third from the branching fraction of the $B^0 \to \overline{D}^0 \pi^+\pi^-$ decay. The fraction of longitudinal polarisation in this decay is measured to be ${f_{\rm L} =(73 \pm 15 \pm 3)\%}$. The most precise determination of the branching fraction for the $B_s^0 \to \overline{D}^{0} \phi$ decay is also obtained, $\mathcal{B}(B_s^0 \to \overline{D}^{0} \phi) = (3.0 \pm 0.3 \pm 0.2 \pm 0.2) \times 10^{-5}$. An upper limit, $\mathcal{B}(B^0 \to \overline{D}^{0} \phi) < 2.0 \ (2.2) \times 10^{-6}$ at $90\%$ (95\%) confidence level is set. A constraint on the $\omega-\phi$ mixing angle $\delta$ is set at $|\delta| < 5.2^\circ (5.5^\circ)$ at $90\%$ ($95\%$) confidence level.
Figures and captions
|
Diagrams that contribute to the (a) colour-suppressed $ B ^0_ s \rightarrow \overline{ D }{} ^{(*)0}/D^{(*)0} \phi$, (b) $W$-exchange OZI-suppressed $ B ^0 \rightarrow \overline{ D }{} {}^0 / D ^0 \phi$ and the (c) colour-suppressed $ B ^0 \rightarrow \overline{ D }{} {}^0 \omega$ decays. |
Fig1.pdf [217 KiB] HiDef png [328 KiB] Thumbnail [127 KiB] *.C file |

|
|
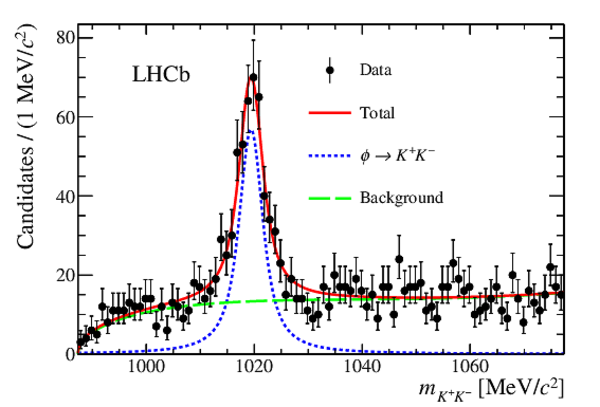
Fit to the $m_{ K ^+ K ^- }$ invariant-mass distribution. Data points are shown in black, the fitted total PDF as a solid (red) line and the component PDFs as dashed lines: (green) background and (blue) signal. |
Fig2.pdf [23 KiB] HiDef png [246 KiB] Thumbnail [199 KiB] *.C file |
|
|
Fit to the $m_{\overline{ D }{} {}^0 K ^+ K ^- }$ invariant-mass distribution of $\overline{ D }{} {}^0 \phi$ candidates obtained using the sPlot technique. Data are shown as black points. The total fit function is displayed as a red solid line and the different contributions are represented as dashed lines and shadowed area: (blue short dashed) the $ B ^0_ s \rightarrow \overline{ D }{} {}^0 \phi$ and $ B ^0 \rightarrow \overline{ D }{} {}^0 \phi$ signal decays, the $ B ^0_ s \rightarrow \overline{ D }{} {}^{*0} \phi$ signal decay, with (cyan long dashed) longitudinal and (pink middle dashed) transverse polarisation and (green shaded area) the combinatorial background. |
Fig3.pdf [33 KiB] HiDef png [320 KiB] Thumbnail [214 KiB] *.C file |

|
|
Animated gif made out of all figures. |
PAPER-2018-015.gif Thumbnail |

|
![HiDef png [328 KiB]](Directory_LHCb-PAPER-2018-015/hidef_Fig1.png)
![HiDef png [246 KiB]](Directory_LHCb-PAPER-2018-015/hidef_Fig2.png)
![HiDef png [320 KiB]](Directory_LHCb-PAPER-2018-015/hidef_Fig3.png)
Tables and captions
|
Relative systematic uncertainties given in percent on the ratios of branching fractions and on longitudinal polarisation. |
Table_1.pdf [77 KiB] HiDef png [49 KiB] Thumbnail [22 KiB] tex code |

|
![HiDef png [49 KiB]](Directory_LHCb-PAPER-2018-015/hidef_Table_1.png)
Created on 02 May 2024.