Measurement of $Z\rightarrow\tau^+\tau^-$ production in proton-proton collisions at $\sqrt{s} = 8$ TeV
[to restricted-access page]Information
LHCb-PAPER-2018-016
CERN-EP-2018-147
arXiv:1806.05008 [PDF]
(Submitted on 13 Jun 2018)
JHEP 09 (2018) 159
Inspire 1677775
Tools
Abstract
A measurement of $Z\rightarrow\tau^+\tau^-$ production cross-section is presented using data, corresponding to an integrated luminosity of 2 fb$^{-1}$, from $pp$ collisions at $\sqrt{s}=8$ TeV collected by the LHCb experiment. The $\tau^+\tau^-$ candidates are reconstructed in final states with the first tau lepton decaying leptonically, and the second decaying either leptonically or to one or three charged hadrons. The production cross-section is measured for $Z$ bosons with invariant mass between 60 and 120 GeV/$c^2$, which decay to tau leptons with transverse momenta greater than 20 GeV/$c$ and pseudorapidities between 2.0 and 4.5. The cross-section is determined to be $\sigma_{pp\rightarrow{}Z\rightarrow{}\tau^+\tau^-} = 95.8 \pm 2.1 \pm 4.6 \pm 0.2 \pm 1.1 \mathrm{pb}$, where the first uncertainty is statistical, the second is systematic, the third is due to the LHC beam energy uncertainty, and the fourth to the integrated luminosity uncertainty. This result is compatible with NNLO Standard model predictions. The ratio of the cross-sections for $Z\rightarrow\tau^+\tau^-$ to $Z\rightarrow\mu^+\mu^-$ ($Z\rightarrow{}e^+e^-$), determined to be $1.01 \pm 0.05$ ($1.02 \pm 0.06$), is consistent with the lepton-universality hypothesis in $Z$ decays.
Figures and captions
|
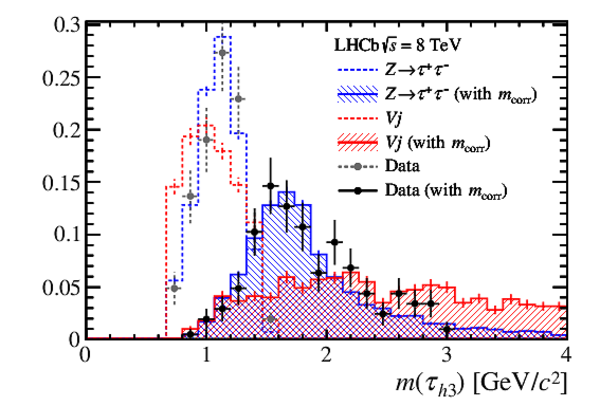
Distributions of invariant (dashed line) and corrected (full line, shaded) mass of $\tau_{h Z \rightarrow \tau ^+\tau ^- }$ (blue) events and the $ V j$ (red) background. |
fig1.pdf [18 KiB] HiDef png [378 KiB] Thumbnail [262 KiB] *.C file |
|
|
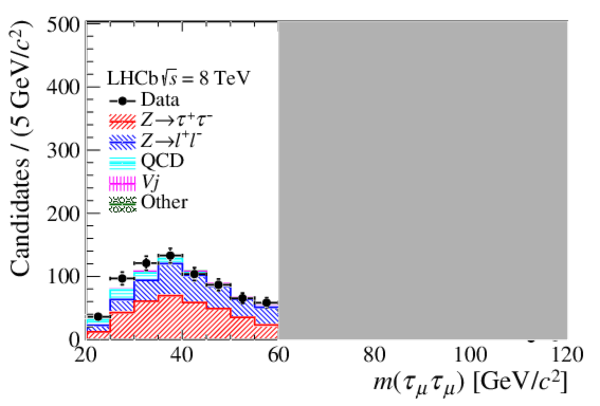
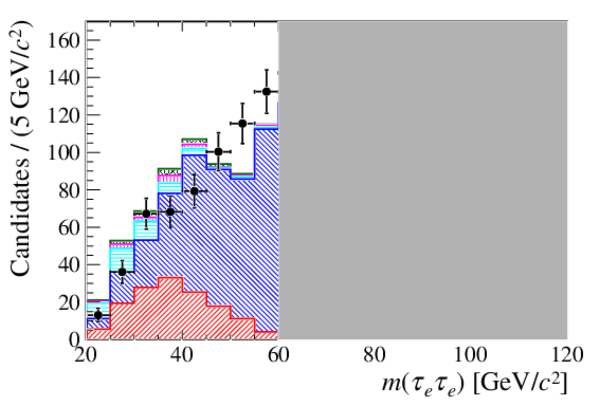
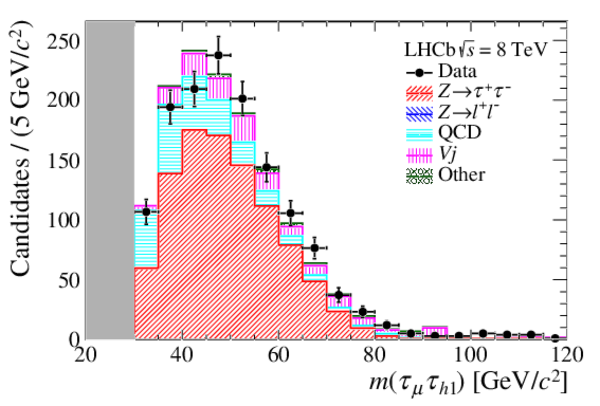
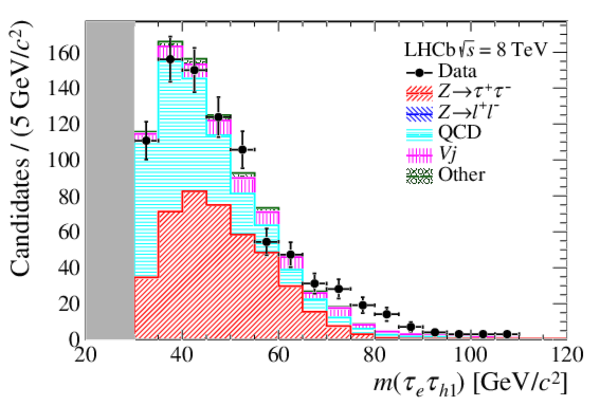
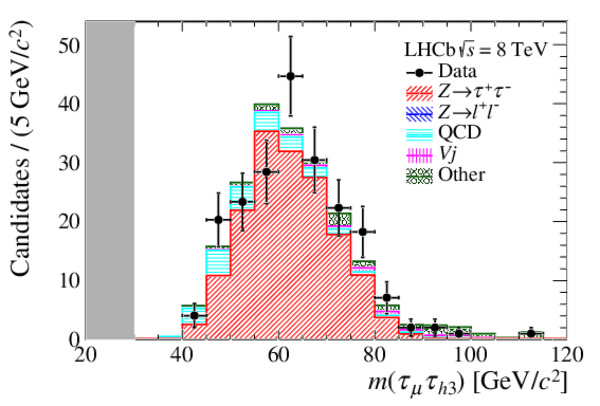
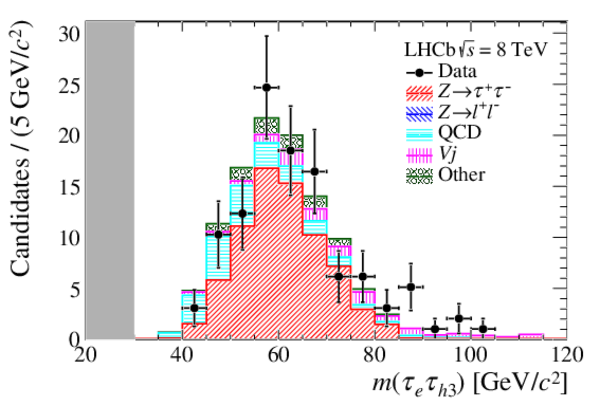
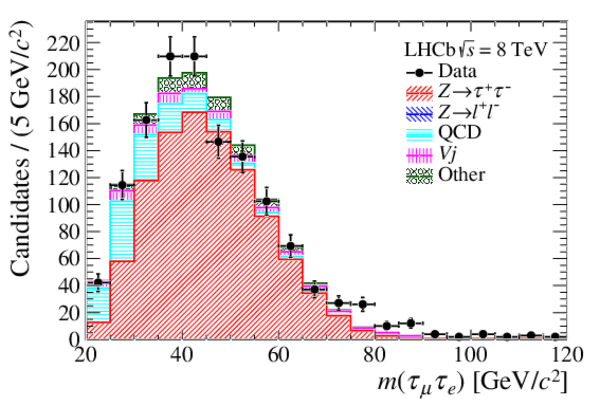
Invariant-mass distributions for (a) $\tau_{\mu}\tau_{\mu}$ {} , (b) $\tau_{e}\tau_{e}$ {} , (c) $\tau_{\mu}\tau_{h}$ candidates with the excluded mass ranges indicated by the gray areas. The $ Z \rightarrow \tau ^+\tau ^- $ simulation (red) is normalised to the observed signal. The $ Z $ (blue), QCD (brown), and electroweak (magenta) backgrounds are estimated from data. The $ t \overline t $ , $ VV$ backgrounds and cross-feed (green) are estimated from simulation (see text) and generally not visible. |
fig2a.pdf [23 KiB] HiDef png [337 KiB] Thumbnail [204 KiB] *.C file |
|
|
fig2b.pdf [23 KiB] HiDef png [538 KiB] Thumbnail [283 KiB] *.C file |
|
|
|
fig2c.pdf [22 KiB] HiDef png [660 KiB] Thumbnail [366 KiB] *.C file |
|
|
|
fig2d.pdf [22 KiB] HiDef png [538 KiB] Thumbnail [318 KiB] *.C file |
|
|
|
fig2e.pdf [21 KiB] HiDef png [588 KiB] Thumbnail [324 KiB] *.C file |
|
|
|
fig2f.pdf [21 KiB] HiDef png [526 KiB] Thumbnail [304 KiB] *.C file |
|
|
|
fig2g.pdf [23 KiB] HiDef png [776 KiB] Thumbnail [421 KiB] *.C file |
|
|
|
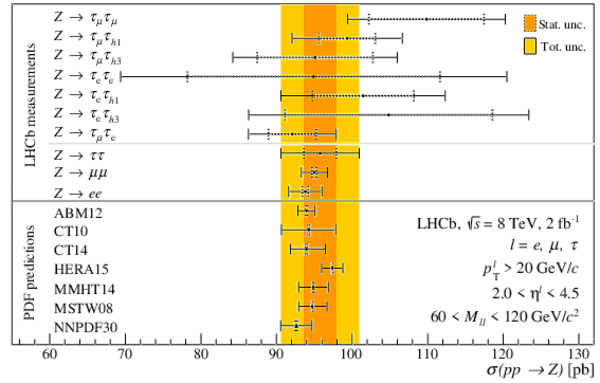
Summary of the measurements of $ Z \rightarrow l^+l^-$ production cross-section inside the LHCb acceptance region from $pp$ collisions at 8$\mathrm{ Te V}$. The error bar represents the total uncertainty. The dotted inner error bar corresponds to the statistical contribution. The coloured band corresponds to the combined measurement of $ Z \rightarrow \tau ^+\tau ^- $ from this analysis. The last 7 rows represent the NNLO predictions with different parameterizations of the PDFs. |
fig3.pdf [16 KiB] HiDef png [296 KiB] Thumbnail [227 KiB] *.C file |
|
|
Animated gif made out of all figures. |
PAPER-2018-016.gif Thumbnail |

|
![HiDef png [378 KiB]](Directory_LHCb-PAPER-2018-016/hidef_fig1.png)
![HiDef png [337 KiB]](Directory_LHCb-PAPER-2018-016/hidef_fig2a.png)
![HiDef png [538 KiB]](Directory_LHCb-PAPER-2018-016/hidef_fig2b.png)
![HiDef png [660 KiB]](Directory_LHCb-PAPER-2018-016/hidef_fig2c.png)
![HiDef png [538 KiB]](Directory_LHCb-PAPER-2018-016/hidef_fig2d.png)
![HiDef png [588 KiB]](Directory_LHCb-PAPER-2018-016/hidef_fig2e.png)
![HiDef png [526 KiB]](Directory_LHCb-PAPER-2018-016/hidef_fig2f.png)
![HiDef png [776 KiB]](Directory_LHCb-PAPER-2018-016/hidef_fig2g.png)
![HiDef png [296 KiB]](Directory_LHCb-PAPER-2018-016/hidef_fig3.png)
Tables and captions
|
Expected backgrounds yields and total number of candidates observed. In the last row the uncertainties are the statistical and systematic contributions combined. |
[Error creating the table] | |
|
Relative uncertainties of the various contributions affecting the cross-section measurement, given in percent. The uncertainties are correlated between streams, except in rows denoted with $^\dagger$. |
Table_2.pdf [54 KiB] HiDef png [80 KiB] Thumbnail [36 KiB] tex code |

|
![HiDef png [80 KiB]](Directory_LHCb-PAPER-2018-016/hidef_Table_2.png)
Created on 27 April 2024.