Prompt $\Lambda^+_c$ production in $p\mathrm{Pb}$ collisions at $\sqrt{s_{NN}} = 5.02$ TeV
[to restricted-access page]Information
LHCb-PAPER-2018-021
CERN-EP-2018-193
arXiv:1809.01404 [PDF]
(Submitted on 05 Sep 2018)
JHEP 02 (2019) 102
Inspire 1692810
Tools
Abstract
The production of $\Lambda^+_c$ baryons produced directly at the interacting point is studied in proton-lead collisions collected with the LHCb detector at the LHC. The data sample corresponds to an integrated luminosity of $1.58\mathrm{nb}^{-1}$ recorded at a nucleon-nucleon centre-of-mass energy of $\sqrt{s_{NN}}=5.02$ TeV. Measurements of the differential cross-section and the forward-backward production ratio are reported for $\Lambda^+_c$ baryons with transverse momenta in the range $2<p_{T}<10$GeV/$c$ and rapidities in the ranges $1.5<y^*<4.0$ and $-4.5<y^*<-2.5$ in the nucleon-nucleon centre-of-mass system. The ratio of cross-sections of $\Lambda^+_c$ baryons and $D^0$ mesons is also reported. The results are compared with next-to-leading order calculations that use nuclear parton distribution functions.
Figures and captions
|
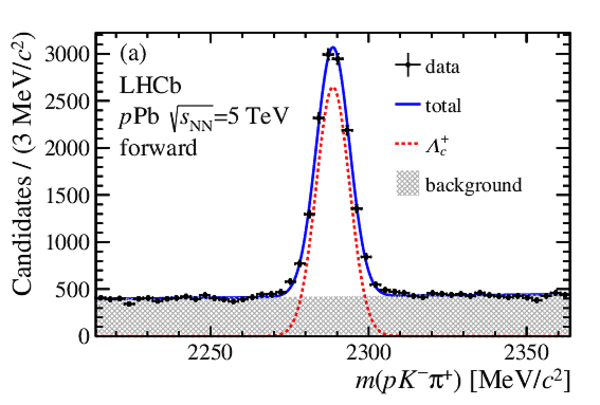
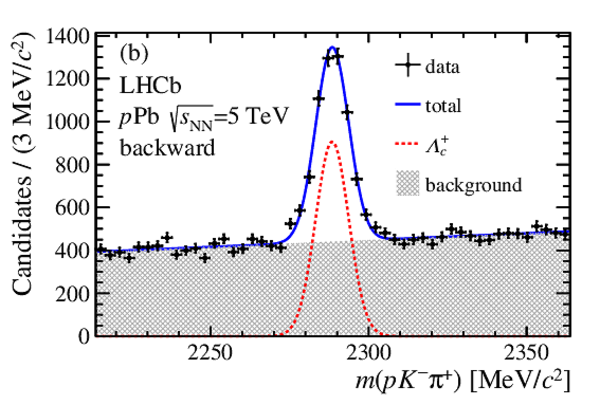
Distributions of the invariant mass, $m( p K ^- \pi ^+ )$, in the range $2< p_{\mathrm{ T}} <10 {\mathrm{ Ge V /}c} $ for (a) the forward data sample with $1.5<y^*<4.0$ and (b) the backward data sample with $-4.5<y^*<-2.5$. The red dotted line is the inclusive $\Lambda ^+_ c $ candidates, the grey shaded area is the combinatorial background and the blue solid line is the sum of the two. |
Fig1a.pdf [28 KiB] HiDef png [423 KiB] Thumbnail [296 KiB] *.C file |
|
|
Fig1b.pdf [28 KiB] HiDef png [688 KiB] Thumbnail [447 KiB] *.C file |
|
|
|
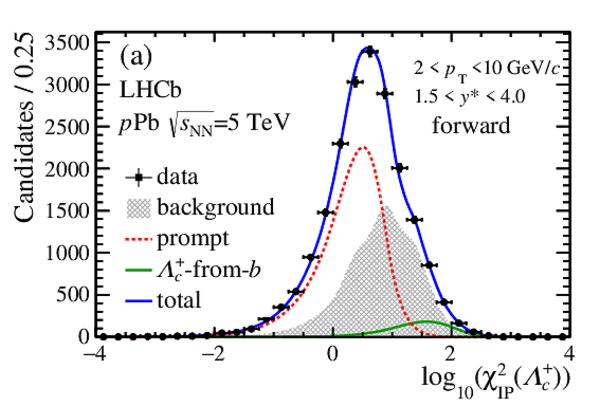
Distributions of $\log_{10}\chi^2_{\text{IP}} (\Lambda ^+_ c ) $ in the range $2< p_{\mathrm{ T}} <10 {\mathrm{ Ge V /}c} $ with the fit results overlaid for (a) the forward data sample with $1.5<y^*<4.0$, and (b) the backward data sample with $-4.5<y^*<-2.5$. The solid blue curve is the sum. The red dotted line is the prompt component, the green is the $\Lambda ^+_ c \mathrm{\text{-}from\text{-}} b $ component and the grey shaded area denotes the combinatorial background. |
Fig2a.pdf [23 KiB] HiDef png [362 KiB] Thumbnail [278 KiB] *.C file |
|
|
Fig2b.pdf [24 KiB] HiDef png [451 KiB] Thumbnail [336 KiB] *.C file |

|
|
|
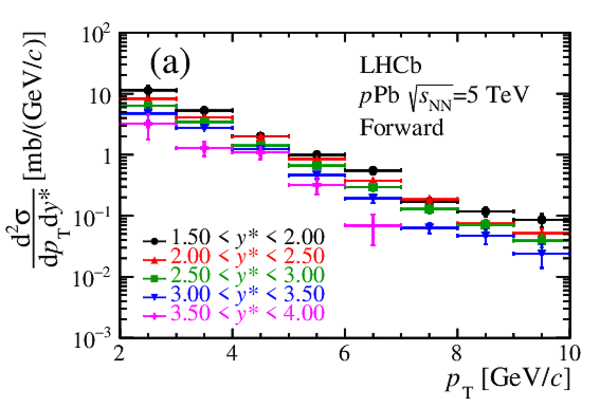
Double-differential cross-section of prompt $\Lambda ^+_ c $ baryons in $ p\mathrm{Pb} $ collisions in the (a) forward and (b) backward collision samples. The uncertainty represents the quadratic sum of the statistical and the systematic uncertainties. |
Fig3a.pdf [19 KiB] HiDef png [212 KiB] Thumbnail [177 KiB] *.C file |
|
|
Fig3b.pdf [18 KiB] HiDef png [204 KiB] Thumbnail [172 KiB] *.C file |

|
|
|
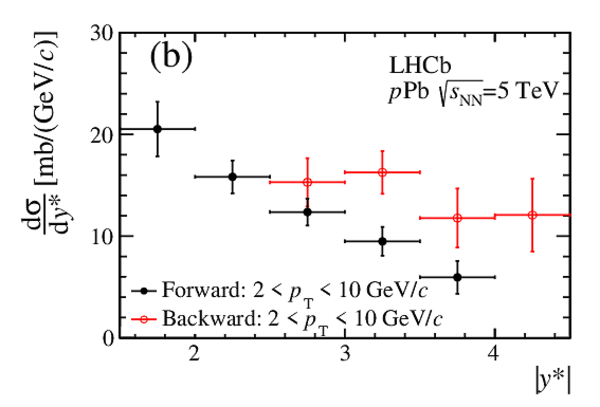
Differential cross-section of prompt $\Lambda ^+_ c $ baryons in $ p\mathrm{Pb} $ collisions as a function of (a) $ p_{\mathrm{ T}} $ and (b) $y^{*}$ in the forward and backward samples. The forward and backward differential cross-sections $\mathrm{d}\sigma/\mathrm{d} p_{\mathrm{ T}} $ in the common rapidity region $2.5<|y^*|<4.0$ are scaled by 0.1 to improve the visibility. The box on each point represents the systematic uncertainty and the error bar represents the sum in quadrature of the statistical and the systematic uncertainties. |
Fig4a.pdf [16 KiB] HiDef png [178 KiB] Thumbnail [170 KiB] *.C file |

|
|
Fig4b.pdf [14 KiB] HiDef png [129 KiB] Thumbnail [123 KiB] *.C file |
|
|
|
(a) Forward-backward production ratios $R_\mathrm{FB}$ as a function of $ p_{\mathrm{ T}} $ integrated over $2.5<|y^*|<4.0$ for $ p_{\mathrm{ T}} $ less than $7 {\mathrm{ Ge V /}c} $ and $2.5<|y^*|<3.5$ for $ p_{\mathrm{ T}} $ greater than $7 {\mathrm{ Ge V /}c} $, and (b) $R_\mathrm{FB}$ as a function of $y^*$ integrated over $2< p_{\mathrm{ T}} <10 {\mathrm{ Ge V /}c} $. The box on each point represents the systematic uncertainty and the error bar represents the sum in quadrature of the statistical and the systematic uncertainties. |
Fig5a.pdf [17 KiB] HiDef png [651 KiB] Thumbnail [371 KiB] *.C file |

|
|
Fig5b.pdf [16 KiB] HiDef png [521 KiB] Thumbnail [304 KiB] *.C file |

|
|
|
The cross-section ratio $ R_{\Lambda ^+_ c / D ^0 }$ between $\Lambda ^+_ c $ baryons and $ D ^0$ mesons as a function of $ p_{\mathrm{ T}} $ integrated over four different rapidity regions. The box on each point represents the systematic uncertainty and the error bar represents the sum in quadrature of the statistical and the systematic uncertainties. The coloured curves represent HELAC-Onia calculations with nPDF EPS09LO/NLO and nCTEQ15. |
Fig6a.pdf [16 KiB] HiDef png [157 KiB] Thumbnail [137 KiB] *.C file |
|
|
Fig6b.pdf [16 KiB] HiDef png [160 KiB] Thumbnail [139 KiB] *.C file |

|
|
|
Fig6c.pdf [15 KiB] HiDef png [158 KiB] Thumbnail [139 KiB] *.C file |

|
|
|
Fig6d.pdf [15 KiB] HiDef png [158 KiB] Thumbnail [137 KiB] *.C file |

|
|
|
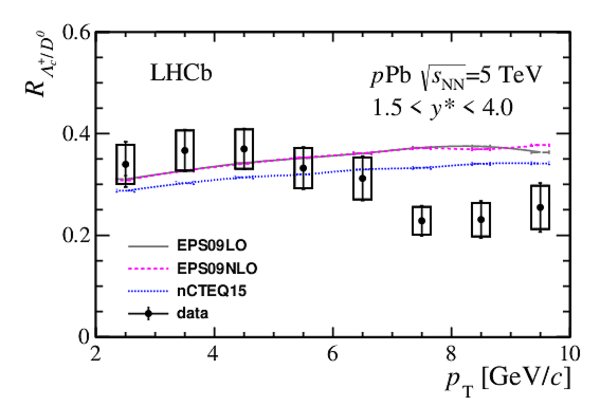
The cross-section ratio $ R_{\Lambda ^+_ c / D ^0 }$ between $\Lambda ^+_ c $ baryons and $ D ^0$ mesons as a function of $y^*$ integrated over $2< p_{\mathrm{ T}} <10 {\mathrm{ Ge V /}c} $. The box on each point represents the systematic uncertainty and the error bar represents the sum in quadrature of the statistical and the systematic uncertainties. The coloured curves show HELAC-Onia calculations incorporating nPDFs EPS09LO/NLO and nCTEQ15. The open circle is the value measured by the ALICE collaboration [21]. The error bar shows the total uncertainty and the grey square the systematic. |
Fig7.pdf [19 KiB] HiDef png [172 KiB] Thumbnail [124 KiB] *.C file |

|
|
Animated gif made out of all figures. |
PAPER-2018-021.gif Thumbnail |

|
![HiDef png [423 KiB]](Directory_LHCb-PAPER-2018-021/hidef_Fig1a.png)
![HiDef png [688 KiB]](Directory_LHCb-PAPER-2018-021/hidef_Fig1b.png)
![HiDef png [362 KiB]](Directory_LHCb-PAPER-2018-021/hidef_Fig2a.png)
![HiDef png [451 KiB]](Directory_LHCb-PAPER-2018-021/hidef_Fig2b.png)
![HiDef png [212 KiB]](Directory_LHCb-PAPER-2018-021/hidef_Fig3a.png)
![HiDef png [204 KiB]](Directory_LHCb-PAPER-2018-021/hidef_Fig3b.png)
![HiDef png [178 KiB]](Directory_LHCb-PAPER-2018-021/hidef_Fig4a.png)
![HiDef png [129 KiB]](Directory_LHCb-PAPER-2018-021/hidef_Fig4b.png)
![HiDef png [651 KiB]](Directory_LHCb-PAPER-2018-021/hidef_Fig5a.png)
![HiDef png [521 KiB]](Directory_LHCb-PAPER-2018-021/hidef_Fig5b.png)
![HiDef png [157 KiB]](Directory_LHCb-PAPER-2018-021/hidef_Fig6a.png)
![HiDef png [160 KiB]](Directory_LHCb-PAPER-2018-021/hidef_Fig6b.png)
![HiDef png [158 KiB]](Directory_LHCb-PAPER-2018-021/hidef_Fig6c.png)
![HiDef png [158 KiB]](Directory_LHCb-PAPER-2018-021/hidef_Fig6d.png)
![HiDef png [172 KiB]](Directory_LHCb-PAPER-2018-021/hidef_Fig7.png)
Tables and captions
|
Systematic and statistical uncertainties for the differential cross-sections. The ranges indicate the variation over the ($ p_{\mathrm{ T}} , y^*$) bins. |
Table_1.pdf [71 KiB] HiDef png [109 KiB] Thumbnail [52 KiB] tex code |

|
|
Measured differential cross-section (in $\mathrm{ mb} /( {\mathrm{ Ge V /}c} )$) of prompt $\Lambda ^+_ c $ baryons as a function of $ p_{\mathrm{ T}} $ in $ p\mathrm{Pb} $ forward and backward data in different rapidity regions. The right column shows the results for $ p_{\mathrm{ T}} > 7 {\mathrm{ Ge V /}c} $ and $2.5<|y^*|<3.5$, which are used to compute the $ R_\mathrm{FB} $ values at $ p_{\mathrm{ T}} > 7 {\mathrm{ Ge V /}c} $. The first uncertainties are statistical and the second are systematic. |
Table_2.pdf [60 KiB] HiDef png [139 KiB] Thumbnail [65 KiB] tex code |

|
|
Differential cross-section (in $\mathrm{ mb} $) for prompt $\Lambda ^+_ c $ baryons as a function of $|y^{*}|$ in $ p\mathrm{Pb} $ forward and backward data. The first uncertainties are statistical and the second are systematic. |
Table_3.pdf [59 KiB] HiDef png [229 KiB] Thumbnail [97 KiB] tex code |

|
|
Forward-backward prompt $\Lambda ^+_ c $ production ratio $ R_\mathrm{FB} $ as a function of $ p_{\mathrm{ T}} $ in the common range $2.5<|y^*|<4.0$. The first uncertainty is statistical and the second is systematic. |
Table_5.pdf [49 KiB] HiDef png [149 KiB] Thumbnail [60 KiB] tex code |

|
|
$ R_\mathrm{FB} $ ratio as a function of $|y^*|$ in the range $2< p_{\mathrm{ T}} <10 {\mathrm{ Ge V /}c} $. The first uncertainty is statistical and the second is systematic. |
Table_6.pdf [55 KiB] HiDef png [73 KiB] Thumbnail [29 KiB] tex code |

|
|
Production ratio $ R_{\Lambda ^+_ c / D ^0 } $ as a function of $ p_{\mathrm{ T}} $ in the forward and backward rapidity regions. The first uncertainty is statistical and the second is systematic. |
Table_7.pdf [59 KiB] HiDef png [236 KiB] Thumbnail [112 KiB] tex code |

|
|
Production ratio $ R_{\Lambda ^+_ c / D ^0 } $ as a function of $y^*$ for $2< p_{\mathrm{ T}} <10 {\mathrm{ Ge V /}c} $. The first uncertainty is statistical and the second is systematic. |
Table_8.pdf [57 KiB] HiDef png [156 KiB] Thumbnail [69 KiB] tex code |

|
![HiDef png [109 KiB]](Directory_LHCb-PAPER-2018-021/hidef_Table_1.png)
![HiDef png [139 KiB]](Directory_LHCb-PAPER-2018-021/hidef_Table_2.png)
![HiDef png [229 KiB]](Directory_LHCb-PAPER-2018-021/hidef_Table_3.png)
![HiDef png [149 KiB]](Directory_LHCb-PAPER-2018-021/hidef_Table_5.png)
![HiDef png [73 KiB]](Directory_LHCb-PAPER-2018-021/hidef_Table_6.png)
![HiDef png [236 KiB]](Directory_LHCb-PAPER-2018-021/hidef_Table_7.png)
![HiDef png [156 KiB]](Directory_LHCb-PAPER-2018-021/hidef_Table_8.png)
Created on 27 April 2024.