Angular moments of the decay $\Lambda_b^0 \rightarrow \Lambda \mu^{+} \mu^{-}$ at low hadronic recoil
[to restricted-access page]Information
LHCb-PAPER-2018-029
CERN-EP-2018-197
arXiv:1808.00264 [PDF]
(Submitted on 01 Aug 2018)
JHEP 09 (2018) 146
Inspire 1684712
Tools
Abstract
An analysis of the angular distribution of the decay $\Lambda_b^0 \rightarrow \Lambda \mu^{+} \mu^{-}$ is presented, using data collected with the LHCb detector between 2011 and 2016 and corresponding to an integrated luminosity of approximately $5 fb^{-1}$. Angular observables are determined using a moment analysis of the angular distribution at low hadronic recoil, corresponding to the dimuon invariant mass squared range $15 < q^{2} < 20 GeV^2/c^4$. The full basis of observables is measured for the first time. The lepton-side, hadron-side and combined forward-backward asymmetries of the decay are determined to be \begin{align} A_{FB}^{l} & = -0.39 \pm 0.04 \rm{stat} \pm 0.01 \rm{syst}, \nonumber\\ A_{FB}^{h} & = -0.30 \pm 0.05 \rm{stat} \pm 0.02 \rm{syst}, \nonumber\\ A_{FB}^{lh} & = +0.25 \pm 0.04 \rm{stat} \pm 0.01 \rm{syst}. \nonumber \end{align} The measurements are consistent with Standard Model predictions.
Figures and captions
|
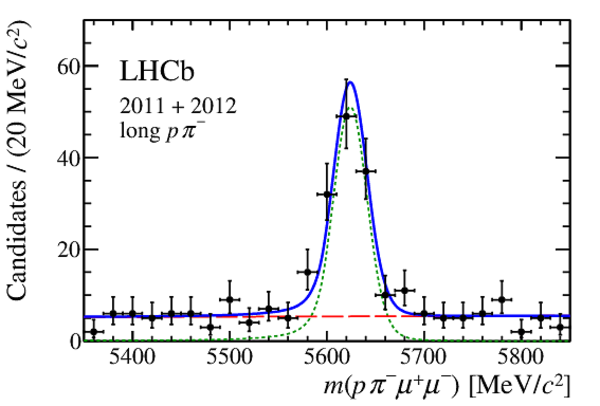
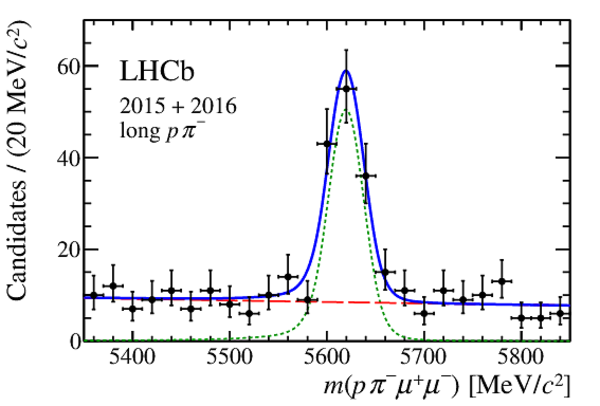
Distribution of $p\pi ^- \mu ^+\mu ^- $ invariant mass for (left) long- and (right) downstream-track $p\pi ^- $ categories in the (top) Run 1 data and (bottom) Run 2 data. The result of the fit to each sample of data is indicated by the solid blue line. The signal and background components are illustrated by the dotted green and dashed red lines, respectively. |
Fig1a.pdf [17 KiB] HiDef png [213 KiB] Thumbnail [182 KiB] *.C file |
|
|
Fig1b.pdf [17 KiB] HiDef png [221 KiB] Thumbnail [191 KiB] *.C file |

|
|
|
Fig1c.pdf [17 KiB] HiDef png [221 KiB] Thumbnail [189 KiB] *.C file |
|
|
|
Fig1d.pdf [17 KiB] HiDef png [231 KiB] Thumbnail [198 KiB] *.C file |

|
|
|
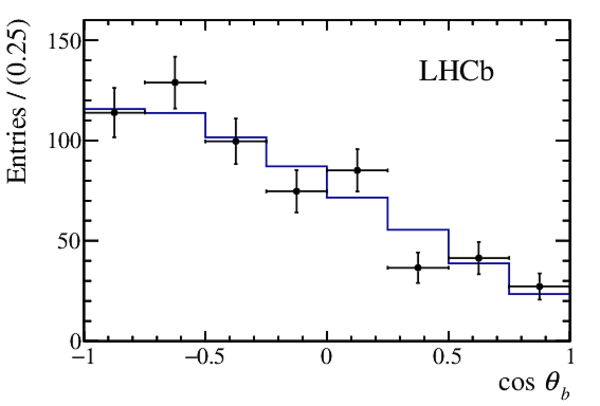
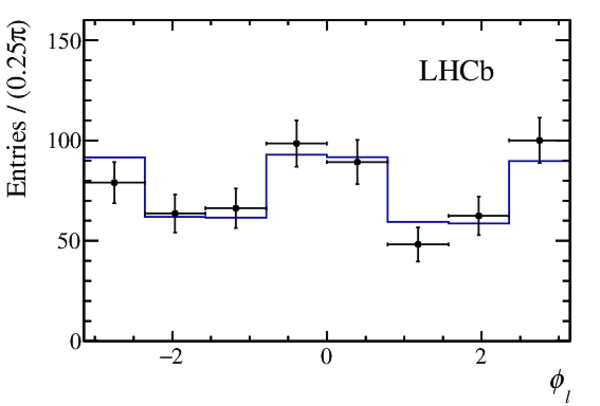
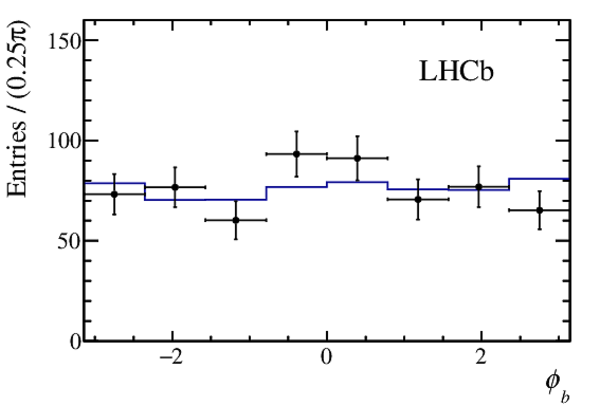
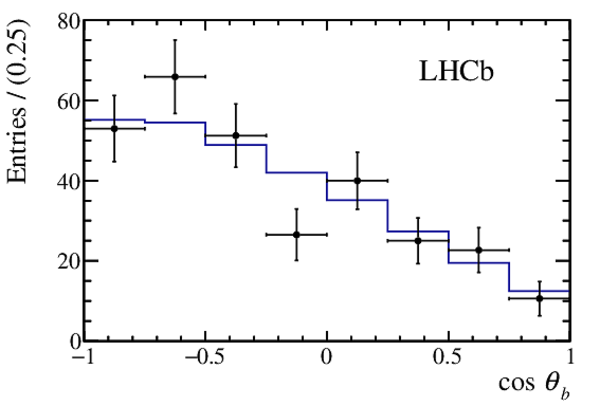
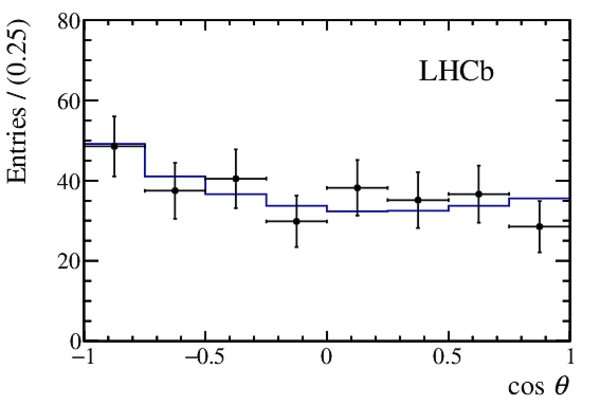
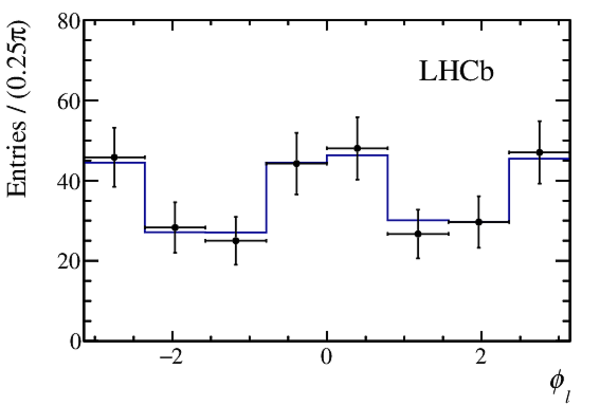
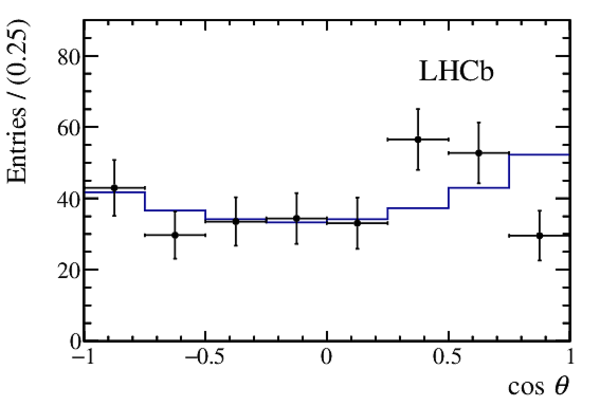
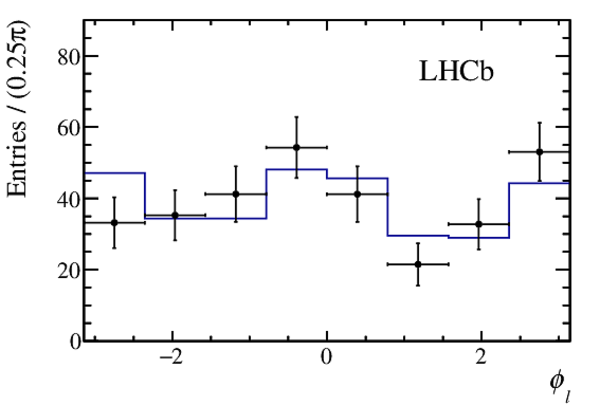
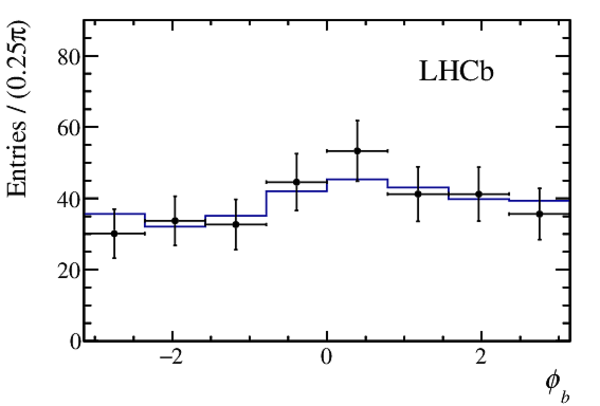
One-dimensional projections of the angular distributions of the candidates (black points), combining Run 1 and Run 2 data, as well as candidates reconstructed in the long- and downstream-track $p\pi ^- $ categories. The background is subtracted from the data but no efficiency correction is applied. The projection of each angular distribution obtained from the moment analysis multiplied by the efficiency distribution is superimposed. The large variation in $\phi_\ell$ is primarily due to the angular acceptance. |
Fig2a.pdf [14 KiB] HiDef png [81 KiB] Thumbnail [78 KiB] *.C file |

|
|
Fig2b.pdf [14 KiB] HiDef png [81 KiB] Thumbnail [77 KiB] *.C file |
|
|
|
Fig2c.pdf [14 KiB] HiDef png [79 KiB] Thumbnail [76 KiB] *.C file |

|
|
|
Fig2d.pdf [14 KiB] HiDef png [74 KiB] Thumbnail [69 KiB] *.C file |
|
|
|
Fig2e.pdf [14 KiB] HiDef png [72 KiB] Thumbnail [69 KiB] *.C file |
|
|
|
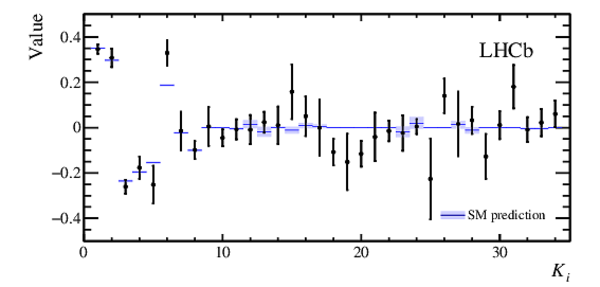
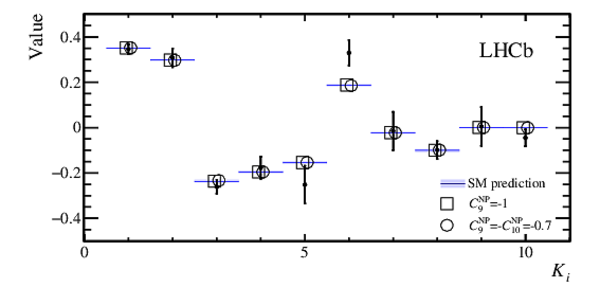
Angular observables combining the results for the moments obtained from Run 1 and Run 2 data, as well as candidates reconstructed in the long- and downstream-track $ p \pi ^- $ categories. The blue line represents the SM predictions obtained using the \texttt{EOS} software. The thickness of the light-blue band represents the uncertainty on the SM predictions. |
Fig3.pdf [14 KiB] HiDef png [54 KiB] Thumbnail [55 KiB] *.C file |

|
|
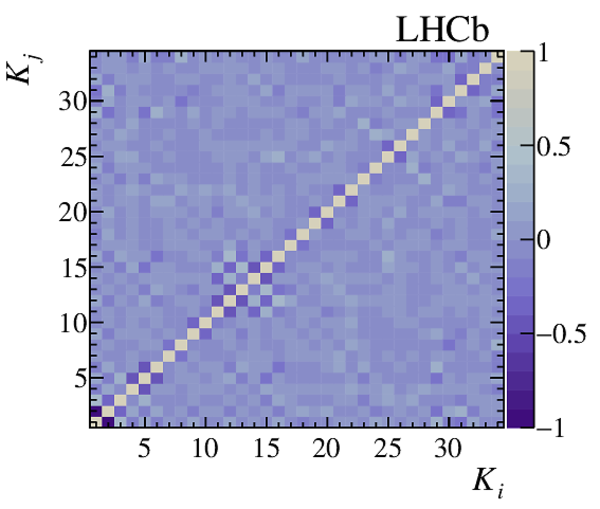
Correlation coefficients between observables for the combined Run 1 and Run 2 data. The correlations are estimated using bootstrapped samples. |
Fig4.pdf [19 KiB] HiDef png [273 KiB] Thumbnail [263 KiB] *.C file |

|
|
Correlation coefficients between the observables (top) in the Run 1 data and (bottom) in the Run 2 data. The correlations are estimated using bootstrapped samples. |
Fig5a.pdf [19 KiB] HiDef png [281 KiB] Thumbnail [268 KiB] *.C file |
|
|
Fig5b.pdf [19 KiB] HiDef png [280 KiB] Thumbnail [266 KiB] *.C file |

|
|
|
Animated gif made out of all figures. |
PAPER-2018-029.gif Thumbnail |

|
Tables and captions
|
Angular observables combining the results of the moments obtained from Run 1 and Run 2 data, as well as candidates reconstructed in the long- and downstream-track $ p \pi ^- $ categories. The first and second uncertainties are statistical and systematic, respectively. |
Table_1.pdf [51 KiB] HiDef png [217 KiB] Thumbnail [107 KiB] tex code |

|
|
Sources of systematic uncertainty on the $K_i$ angular observables, together with the mean and the range of uncertainty values assigned to the 34 $K_i$ parameters in each case. The variation of each source of systematic uncertainty between the different observables depends on the structure of the weighting functions used to extract the observable and its correlation with the angular efficiency. |
Table_2.pdf [60 KiB] HiDef png [73 KiB] Thumbnail [33 KiB] tex code |

|
|
Measured values for the angular observables from the Run 1 data combining the results of the moments obtained from the candidates reconstructed in the long- and downstream-track $ p \pi ^- $ categories. The first and second uncertainties are statistical and systematic, respectively. |
Table_3.pdf [51 KiB] HiDef png [214 KiB] Thumbnail [106 KiB] tex code |

|
|
Measured values for the angular observables from the Run 2 data combining the results of the moments obtained from the candidates reconstructed in the long- and downstream-track $ p \pi ^- $ categories. The first and second uncertainties are statistical and systematic, respectively. |
Table_4.pdf [51 KiB] HiDef png [216 KiB] Thumbnail [107 KiB] tex code |

|
Supplementary Material [file]


![HiDef png [213 KiB]](Directory_LHCb-PAPER-2018-029/hidef_Fig1a.png)
![HiDef png [221 KiB]](Directory_LHCb-PAPER-2018-029/hidef_Fig1b.png)
![HiDef png [221 KiB]](Directory_LHCb-PAPER-2018-029/hidef_Fig1c.png)
![HiDef png [231 KiB]](Directory_LHCb-PAPER-2018-029/hidef_Fig1d.png)
![HiDef png [81 KiB]](Directory_LHCb-PAPER-2018-029/hidef_Fig2a.png)
![HiDef png [81 KiB]](Directory_LHCb-PAPER-2018-029/hidef_Fig2b.png)
![HiDef png [79 KiB]](Directory_LHCb-PAPER-2018-029/hidef_Fig2c.png)
![HiDef png [74 KiB]](Directory_LHCb-PAPER-2018-029/hidef_Fig2d.png)
![HiDef png [72 KiB]](Directory_LHCb-PAPER-2018-029/hidef_Fig2e.png)
![HiDef png [54 KiB]](Directory_LHCb-PAPER-2018-029/hidef_Fig3.png)
![HiDef png [273 KiB]](Directory_LHCb-PAPER-2018-029/hidef_Fig4.png)
![HiDef png [281 KiB]](Directory_LHCb-PAPER-2018-029/hidef_Fig5a.png)
![HiDef png [280 KiB]](Directory_LHCb-PAPER-2018-029/hidef_Fig5b.png)
![HiDef png [217 KiB]](Directory_LHCb-PAPER-2018-029/hidef_Table_1.png)
![HiDef png [73 KiB]](Directory_LHCb-PAPER-2018-029/hidef_Table_2.png)
![HiDef png [214 KiB]](Directory_LHCb-PAPER-2018-029/hidef_Table_3.png)
![HiDef png [216 KiB]](Directory_LHCb-PAPER-2018-029/hidef_Table_4.png)
![HiDef png [85 KiB]](Directory_LHCb-PAPER-2018-029/supplementary/hidef_Fig1_S.png)
![HiDef png [84 KiB]](Directory_LHCb-PAPER-2018-029/supplementary/hidef_Fig2_S.png)
![HiDef png [83 KiB]](Directory_LHCb-PAPER-2018-029/supplementary/hidef_Fig3a_S.png)
![HiDef png [84 KiB]](Directory_LHCb-PAPER-2018-029/supplementary/hidef_Fig3b_S.png)
![HiDef png [82 KiB]](Directory_LHCb-PAPER-2018-029/supplementary/hidef_Fig3c_S.png)
![HiDef png [76 KiB]](Directory_LHCb-PAPER-2018-029/supplementary/hidef_Fig3d_S.png)
![HiDef png [74 KiB]](Directory_LHCb-PAPER-2018-029/supplementary/hidef_Fig3e_S.png)
![HiDef png [83 KiB]](Directory_LHCb-PAPER-2018-029/supplementary/hidef_Fig4a_S.png)
![HiDef png [83 KiB]](Directory_LHCb-PAPER-2018-029/supplementary/hidef_Fig4b_S.png)
![HiDef png [81 KiB]](Directory_LHCb-PAPER-2018-029/supplementary/hidef_Fig4c_S.png)
![HiDef png [76 KiB]](Directory_LHCb-PAPER-2018-029/supplementary/hidef_Fig4d_S.png)
![HiDef png [76 KiB]](Directory_LHCb-PAPER-2018-029/supplementary/hidef_Fig4e_S.png)
![HiDef png [131 KiB]](Directory_LHCb-PAPER-2018-029/supplementary/hidef_Fig5a_S.png)
![HiDef png [134 KiB]](Directory_LHCb-PAPER-2018-029/supplementary/hidef_Fig5b_S.png)
![HiDef png [125 KiB]](Directory_LHCb-PAPER-2018-029/supplementary/hidef_Fig5c_S.png)
![HiDef png [130 KiB]](Directory_LHCb-PAPER-2018-029/supplementary/hidef_Fig5d_S.png)
![HiDef png [125 KiB]](Directory_LHCb-PAPER-2018-029/supplementary/hidef_Fig5e_S.png)
![HiDef png [136 KiB]](Directory_LHCb-PAPER-2018-029/supplementary/hidef_Fig5f_S.png)
Created on 27 April 2024.